Source: FDA, National Drug Code (US) Revision Year: 2020
X-linked hypophosphatemia is caused by excess fibroblast growth factor 23 (FGF23) which suppresses renal tubular phosphate reabsorption and the renal production of 1,25 dihydroxy vitamin D. Burosumab-twza binds to and inhibits the biological activity of FGF23 restoring renal phosphate reabsorption and increasing the serum concentration of 1,25 dihydroxy vitamin D.
Following SC administration in XLH and TIO patients, higher burosumab-twza concentrations were associated with greater increase of serum phosphorus levels. The increase in serum phosphorus was reversible and returned to baseline with elimination of systemic burosumab-twza.
Ratio of renal tubular maximum reabsorption rate of phosphate to glomerular filtration rate (TmP/GFR) showed dose-dependent increases from baseline [see Clinical Studies (14)].
Elevation in serum total FGF23 was observed after initiation of burosumab-twza treatment, however, the clinical implication is unknown.
The following pharmacokinetic parameters were observed in patients with XLH administered the approved recommended starting dosage based on a 70 kg patient, unless otherwise specified. Based on the population PK analysis, the PK characteristics of burosumab-twza were similar between patients with XLH and TIO.
Burosumab-twza exhibited linear pharmacokinetics following SC injections within the dose range of 0.1 to 1 mg/kg (0.08 to 0.8 times the maximum approved recommended dosage based on a 70 kg patient with XLH).
The steady-state trough mean (± SD) concentration of burosumab-twza was 5.8 (± 3.4) mcg/mL in adult XLH patients.
The burosumab-twza mean Tmax values ranged from 8 to 11 days.
The apparent volume of distribution of burosumab-twza is 8 L.
The apparent clearance is 0.290 L/day. The half-life of burosumab-twza is approximately 19 days.
The exact pathway for burosumab-twza metabolism has not been characterized. Burosumab-twza is expected to be degraded into small peptides and amino acids via catabolic pathways.
No clinical significant difference in burosumab-twza pharmacokinetics was observed based on age.
The effect of renal or hepatic impairment on the pharmacokinetics of burosumab-twza is unknown.
The steady-state trough concentration was 15.8 (± 9.4) mcg/mL in XLH patients aged 5-12 years, and 11.2 (± 4.6) mcg/mL in XLH patients aged 1-4 years.
Clearance and volume of distribution of burosumab-twza increases with body weight.
No drug interaction studies have been conducted with CRYSVITA.
The carcinogenic potential of burosumab-twza has not been evaluated in long term animal studies.
Studies have not been performed to evaluate the mutagenic potential of burosumab-twza.
No specific fertility studies have been performed in animals to evaluate the effects of burosumab-twza.
Toxicology studies with burosumab-twza of up to 40 weeks duration in cynomolgus monkeys did not show significant adverse effects on female reproductive organs at doses up to 16-fold human exposure at the maximum recommended human dose (MRHD) of 2 mg/kg every 2 weeks. In male monkeys, minimal mineralization of the rete testis or seminiferous tubules associated with hyperphosphatemia was observed at 3- to 9-fold human exposure at the MRHD of 2 mg/kg every 2 weeks, but semen analysis did not show any adverse effects.
In rabbits and cynomolgus monkeys, inhibition of FGF23 signaling by burosumab-twza increased serum phosphate and 1,25 dihydroxy vitamin D. Ectopic mineralization in multiple tissues and organs was observed at doses of burosumab-twza that resulted in supra-physiologic serum phosphate levels. In a study in wild type (WT) and hypophosphatemic Hyp mice, a murine model of XLH, ectopic mineralization was markedly less in Hyp mice.
In adult cynomolgus monkeys, burosumab-twza increased bone turnover, mineral content and/or mineral density and cortical thickness at 9- to 16-fold human exposure at the MRHD of 2 mg/kg every 2 weeks. Adverse effects on bone, including reductions in bone mineral density, bone mineralization and bone strength were observed in adult male monkeys at 9- to 11-fold human exposure at the MRHD of 2 mg/kg every 2 weeks.
In juvenile cynomolgus monkeys, burosumab-twza increased bone turnover, mineral content and/or mineral density and/or cortical thickness at 0.2- to 2-fold clinical pediatric exposure. Bone mineralization was decreased in a male monkey at 2-fold pediatric exposure but there was no effect on bone strength. Burosumab-twza did not affect bone development in juvenile monkeys at doses up to 2-fold pediatric exposure.
CRYSVITA has been evaluated in three studies enrolling a total of 126 pediatric patients with XLH.
Study 1 (NCT 02915705) is a 64-week randomized, open-label study in 61 pediatric XLH patients, 1 to 12 years old that compared treatment with CRYSVITA to active control (oral phosphate and active vitamin D). At time of first dose the mean age of patients was 6.3 years and 44% were male. All patients had radiographic evidence of rickets at baseline, with an RSS score of ≥2.0 and had received oral phosphate and active vitamin D analogs for a mean (SD) duration of 4 (3.1) years. Oral phosphate and active vitamin D analogs were discontinued prior to study enrollment for a 7-day washout period and then reinitiated for patients in the active control group. Patients were randomized to receive either CRYSVITA at a starting dose of 0.8 mg/kg every two weeks or oral phosphate (recommended dose 20-60 mg/kg/day) and active vitamin D (recommended doses calcitriol 20-30 ng/kg/day or alfacalcidol 40-60 ng/kg/day). Patients randomized to active control received a mean oral phosphate dose of approximately 41 mg/kg/day (range 18 to 110 mg/kg/day) at Week 40 and approximately 46 mg/kg/day (range 18 mg/kg/day to 166 mg/kg/day) at Week 64. They also received either a mean oral calcitriol dose of 26 ng/kg/day at Week 40 and 27 ng/kg/day at Week 64 or a therapeutically equivalent amount of alfacalcidol. Eight patients in the CRYSVITA arm titrated up to 1.2 mg/kg based on serum phosphorus measurements. All patients completed at least 64 weeks on study.
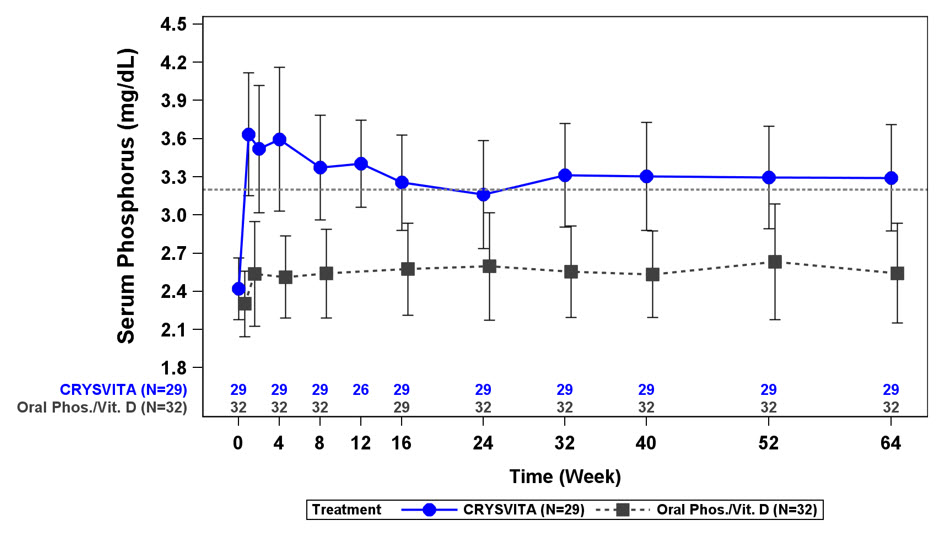
In Study 1, CRYSVITA increased mean (SD) serum phosphorus levels from 2.4 (0.24) mg/dL at baseline to 3.3 (0.43) mg/dL at Week 40 and to 3.3 (0.42) mg/dL at Week 64. In the active control group, mean (SD) serum phosphorus concentrations increased from 2.3 (0.26) mg/dL at baseline to 2.5 (0.34) mg/dL at Week 40 and to 2.5 (0.39) mg/dL at Week 64. The renal phosphate reabsorptive capacity as assessed by TmP/GFR increased in the CRYSVITA-treated patients from a mean (SD) of 2.2 (0.37) mg/dL at baseline to 3.4 (0.67) mg/dL and 3.3 (0.65) mg/dL at Week 40 and Week 64, respectively. In the active control group, mean (SD) TmP/GFR decreased from 2.0 (0.33) mg/dL at Baseline to 1.8 (0.35) mg/dL at Week 40, and remained below baseline at Week 64 at 1.9 (0.49) mg/dL.
Figure 1. Serum Phosphorus Concentration and Change from Baseline (mg/dL) (Mean ± SD) by Treatment Group in Children 1-12 Years in Study 1:
The dotted line represents the lower limit of normal (3.2 mg/dL) for patients in Study 1.
Radiographs were examined to assess XLH-related rickets using the 10-point Thacher Rickets Severity Score (RSS) and the 7-point Radiographic Global Impression of Change (RGI-C). The RSS score is assigned based on images of the wrist and knee from a single timepoint, with higher scores indicating greater rickets severity. The RGI-C score is assigned based on side-by-side comparisons of wrist and knee radiographs from two timepoints, with higher scores indicating greater improvement in radiographic evidence of rickets. A RGI-C score of +2.0 was defined as radiographic evidence of substantial healing.
In Study 1, baseline mean (SD) total RSS was 3.2 (0.98) in the CRYSVITA group and 3.2 (1.14) in the active control group. After 40 weeks of treatment with CRYSVITA, mean total RSS decreased from 3.2 to 1.1 (0.72) and from 3.2 to 2.5 (1.09) in the active control group. LS mean (SE) RGI-C Global score was +1.9 (0.11) in the CRYSVITA group and +0.8 (0.11) in the active control group at Week 40 (see Table 10). At Week 40, 21 of the 29 patients in the CRYSVITA group and 2 of the 32 patients in the active control arm achieved a RGI-C global score ≥ +2.0. These findings were maintained at Week 64 as shown in Table 10.
Table 10. Rickets Response in Children 1-12 Years Receiving CRYSVITA Every 2 Weeks in Study 1:
| Endpoint Timepoint | CRYSVITA Every 2 Weeks (N=29) | Active Control (N=32) |
|---|---|---|
| RSS Total Score | ||
| Baseline Mean (SD) | 3.2 (0.98) | 3.2 (1.14) |
| LS Mean change from baseline in total score* (reduction indicates improvement) with 95% CI | ||
| Week 40 | -2.0 (-2.33, -1.75) | -0.7 (-0.98, -0.43) |
| Week 64 | -2.2 (-2.46, -2.00) | -1.0 (-1.31, -0.72) |
| RGI-C Global Score† | ||
| LS Mean score* (positive indicates healing) with 95% CI | ||
| Week 40 | +1.9 (+1.70, +2.14) | +0.8 (+0.56, +0.99) |
| Week 64 | +2.06 (+1.91, +2.20) | +1.03 (+0.77, +1.30) |
* The estimates of LS mean and 95% CI for Week 4 0 are from an ANCOVA model
accounting for treatment group, baseline RSS and baseline age stratification factor; the estimates for Week 64 are from a generalized estimating equation (GEE) model accounting for treatment group, visit, treatment by visit interaction, baseline RSS and baseline age stratification factor.
† RGI-C at Week 4 0 is the primary endpoint of Study 1
In Study 1, lower extremity skeletal abnormalities were assessed by RGI-C in standing long leg radiographs. At Week 64, the CRYSVITA group maintained greater improvement compared with the active control group (LS mean [SE]: +1.25 [0.17] versus +0.29 [0.12]; difference of +0.97 (95% CI: +0.57, +1.37, GEE model)).
For Study 1, mean (SD) serum total alkaline phosphatase activity decreased from 511 (125) at baseline to 337 (86) U/L in the CRYSVITA group (mean change: -33%) and from 523 (154) at baseline to 495 (182) U/L in the active control group (mean change: -5%) at Week 64.
In Study 1, CRYSVITA treatment for 64 weeks increased standing mean (SD) height Z score from -2.32 (1.17) at baseline to -2.11 (1.11) at Week 64 (LS mean change (SE) of +0.17 (0.07)). In the active control group, mean (SD) height Z score increased from -2.05 (0.87) at baseline to -2.03 (0.83) at Week 64 (LS mean (SE) change of +0.02 (0.04)). The difference between the treatment groups at Week 64 was +0.14 (95% CI: 0.00, +0.29).
Study 2 (NCT 02163577) is a randomized, open-label study in 52 prepubescent XLH patients, 5 to 12 years old, which compared treatment with CRYSVITA administered every 2 weeks versus every 4 weeks. Following an initial 16-week dose titration phase, patients completed 48-weeks of treatment with CRYSVITA every 2 weeks. All 52 patients completed at least 64 weeks on study; no patient discontinued. Burosumab-twza dose was adjusted to target a fasting serum phosphorus concentration of 3.5 to 5.0 mg/dL based on the fasting phosphorus level the day of dosing. Twenty-six of 52 patients received CRYSVITA every two weeks up to a maximum dose of 2 mg/kg. The average dose was 0.73 mg/kg (range: 0.3, 1.5) at Week 16, 0.98 mg/kg (range: 0.4, 2.0) at Week 40 and 1.04 mg/kg (range: 0.4, 2.0) at Week 60. The remaining 26 patients received CRYSVITA every four weeks. At study entry, the mean age of patients was 8.5 years and 46% were male. Ninety-six percent had received oral phosphate and active vitamin D analogs for a mean (SD) duration of 7 (2.4) years. Oral phosphate and active vitamin D analogs were discontinued prior to study enrollment. Ninety-four percent of patients had radiographic evidence of rickets at baseline.
Study 3 (NCT 02750618) is a 64-week open-label study in 13 pediatric XLH patients, 1 to 4 years old. Patients received CRYSVITA at a dose of 0.8 mg/kg every two weeks with 3 patients titrating up to 1.2 mg/kg based on serum phosphorus measurements. All patients completed at least 40 weeks on study; no patients discontinued. At study entry, the mean age of patients was 2.9 years and 69% were male. All patients had radiographic evidence of rickets at baseline and 12 patients had received oral phosphate and active vitamin D analogs for a mean (SD) duration of 16.7 (14.4) months. Oral phosphate and active vitamin D analogs were discontinued prior to study enrollment.
In Study 2, CRYSVITA increased mean (SD) serum phosphorus levels from 2.4 (0.40) at baseline to 3.3 (0.40) and 3.4 (0.45) mg/dL at Week 40 and Week 64 in the patients who received CRYSVITA every 2 weeks. The ratio of renal tubular maximum reabsorption rate of phosphate to glomerular filtration rate (TmP/GFR) increased in these patients from mean (SD) of 2.2 (0.49) at baseline to 3.3 (0.60) and 3.4 (0.53) mg/dL at Week 40 and Week 64.
In Study 3, CRYSVITA increased mean (SD) serum phosphorus levels from 2.5 (0.28) mg/dL at baseline to 3.5 (0.49) mg/dL at Week 40.
In Study 2, baseline mean (SD) RSS total score was 1.9 (1.17) in patients receiving CRYSVITA every two weeks. After 40 weeks of treatment with CRYSVITA, mean total RSS decreased from 1.9 to 0.8 (see Table 11). After 40 weeks of treatment with CRYSVITA, the mean RGI-C Global score was +1.7 in patients receiving CRYSVITA every two weeks. Eighteen out of 26 patients achieved an RGI-C score of ≥ +2.0. These findings were maintained at Week 64 as shown in Table 11.
In Study 3, baseline mean (SD) total RSS was 2.9 (1.37) in 13 patients. After 40 weeks of treatment with CRYSVITA, mean total RSS decreased from 2.9 to 1.2 and the mean (SE) RGI-C Global score was +2.3 (0.08) (see Table 11). All 13 patients achieved a RGI-C global score ≥ +2.0.
Table 11. Rickets Response in Children 1-12 Years Receiving CRYSVITA Every 2 Weeks in Study 2 and Study 3:
| Endpoint Timepoint | CRYSVITA Every 2 Weeks | |
|---|---|---|
| Study 2* (N=26) | Study 3† (N=13) | |
| RSS Total Score | ||
| Baseline Mean (SD) | 1.9 (1.17) | 2.9 (1.37) |
| LS Mean change from baseline in total score (reduction indicates improvement) with 95% CI | ||
| Week 40 | -1.1 (-1.28, -0.85) | -1.7 (-2.03, -1.44) |
| Week 64 | -1.0 (-1.2, -0.79) | |
| RGI-C Global Score | ||
| LS Mean score (positive indicates healing) with 95% CI | ||
| Week 40 | +1.7 (+1.48, +1.84) | +2.3 (+2.16, +2.51) |
| Week 64 | +1.6 (+1.34, +1.78) | |
* The estimates of LS mean and 95% CI are from a generalized estimating equation (GEE) model accounting for regimen, visit, regimen by visit interaction, baseline RSS for study 2.
† The estimates of LS mean and 95% CI for Week 40 are from an ANCOVA model accounting for age and baseline RSS for study 3.
In Study 3, the mean (SE) change in lower limb deformity as assessed by RGI-C, using standing long leg radiographs, was +1.3 (0.14) at Week 40.
For Study 2, mean (SD) serum total alkaline phosphatase activity was 462 (110) U/L at baseline and decreased to 354 (73) U/L at Week 64 (-23%) in the patients who received CRYSVITA every 2 weeks.
For Study 3, mean (SD) serum total alkaline phosphatase activity was 549 (194) U/L at baseline and decreased to 335 (88) U/L at Week 40 (mean change: -36%).
In Study 2, CRYSVITA treatment for 64 weeks increased standing mean (SD) height Z score from -1.72 (1.03) at baseline to -1.54 (1.13) in the patients who received CRYSVITA every two weeks (LS mean change of +0.19 (95% CI: 0.09 to 0.29).
Study 4 (NCT 02526160) is a randomized, double-blind, placebo-controlled study in 134 adult XLH patients. The study comprises a 24-week placebo-controlled treatment phase followed by a 24-week open-label treatment period in which all patients received CRYSVITA. CRYSVITA was administered at a dose of 1 mg/kg every 4 weeks. At study entry, the mean age of patients was 40 years (range 19 to 66 years) and 35% were male. All patients had skeletal pain associated with XLH/osteomalacia at baseline. The baseline mean (SD) serum phosphorus concentration was below the lower limit of normal at 1.98 (0.31) mg/dL. Oral phosphate and active vitamin D analogs were not allowed during the study. Out of the 134 patients enrolled in the study, one patient in the CRYSVITA group discontinued treatment during the 24-week placebo-controlled treatment period, and 7 patients discontinued CRYSVITA during the open-label treatment period.
Study 5 (NCT 02537431) is a 48-week, open-label, single-arm study in 14 adult XLH patients to assess the effects of CRYSVITA on improvement of osteomalacia as determined by histologic and histomorphometric evaluation of iliac crest bone biopsies. Patients received 1 mg/kg CRYSVITA every four weeks. At study entry, the mean age of patients was 40 years (range 25 to 52 years) and 43% were male. Oral phosphate and active vitamin D analogs were not allowed during the study.
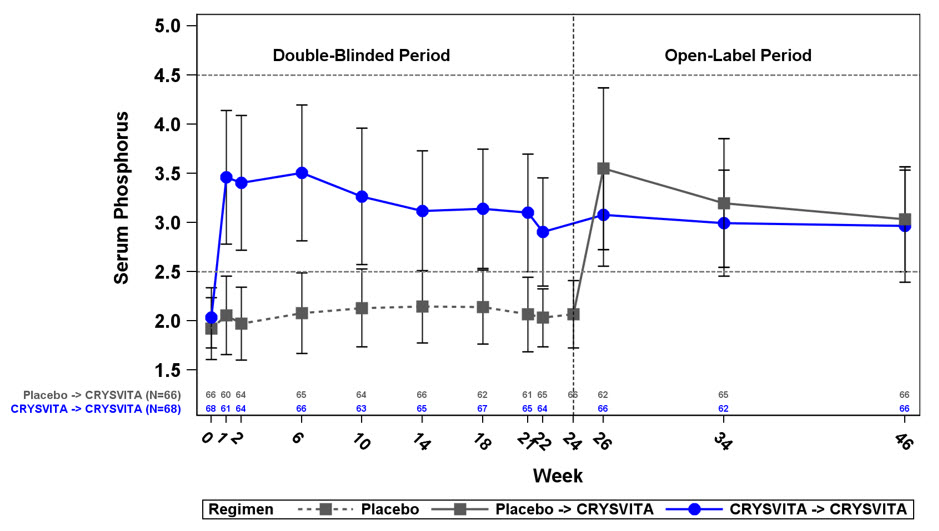
In Study 4 at baseline, mean (SD) serum phosphorus was 1.9 (0.32) and 2.0 (0.30) mg/dL in the placebo and CRYSVITA groups respectively. During the initial 24-week double-blind, placebo-controlled period, mean (SD) serum phosphorus across the midpoints of dose intervals (2 weeks post dose) was 2.1 (0.30) and 3.2 (0.53) mg/dL in the placebo and CRYSVITA groups, and mean (SD) serum phosphorus across the ends of dose intervals was 2.0 (0.30) and 2.7 (0.45) mg/dL in the placebo and CRYSVITA groups.
A total of 94% of patients treated with CRYSVITA achieved a serum phosphorus level above the lower limit of normal (LLN) compared to 8% in the placebo group through Week 24 (see Table 12).
Table 12. Proportion of Adult Patients Achieving Mean Serum Phosphorus Levels Above the LLN at the Midpoint of the Dose Interval During the 24-Week Placebo-Controlled Period of Study 4:
| Placebo (N=66) | CRYSVITA (N=68) | |
|---|---|---|
| Achieved Mean Serum Phosphorus > LLN Across Midpoints of Dose Intervals Through Week 24 – n (%) | 5 (8%) | 64 (94%) |
| 95% CI | (3.3, 16.5) | (85.8, 97.7) |
| p-value* | <0.0001 |
The 95% CIs are calculated using the Wilson score method.
* P-value is from Cochran-Mantel-Haenszel (CMH) testing for association between achieving the primary endpoint and treatment group, adjusting for randomization stratifications.
During the open-label treatment period, serum phosphorus was maintained during continued CRYSVITA therapy, with no evidence of loss of effect through Week 48.
Figure 2. Mean (± SD) Serum Phosphorus Peak Concentrations (mg/dL) in Study 4*,†:
* Placebo subjects cross over to receive open-label CRYSVITA treatment at Week 24
† The dotted lines represent the upper limit of normal (4.5 mg/dL) and lower limit of normal (2.5 mg/dL) for patients in Study 4
At baseline, the mean (SD) ratio of renal tubular maximum reabsorption rate of phosphate to glomerular filtration rate (TmP/GFR) was 1.60 (0.37) and 1.68 (0.40) mg/dL in the placebo and CRYSVITA groups respectively. At Week 22 (midpoint of a dose interval), mean (SD) TmP/GFR was 1.69 (0.37) and 2.73 (0.75) mg/dL in the placebo and CRYSVITA groups. At Week 24 (end of a dose interval), mean (SD) TmP/GFR was 1.73 (0.42) and 2.21 (0.48) mg/dL in the placebo and CRYSVITA groups. During the open-label treatment period, TmP/GFR remained stable during continued CRYSVITA therapy through Week 48.
In Study 4, a skeletal survey was conducted at baseline to identify osteomalacia-related fractures and pseudofractures. Osteomalacia-related fractures are defined as atraumatic lucencies extending across both bone cortices and pseudofractures are defined as atraumatic lucencies extending across one cortex. There were 52% of patients who had either active (unhealed) fractures (12%) or active pseudofractures (47%) at baseline. The active fractures and pseudofractures were predominantly located in the femurs, tibia/fibula, and metatarsals of the feet. Assessment of these active fracture/pseudofracture sites at Week 24 demonstrated a higher rate of complete healing in the CRYSVITA group compared to placebo as shown in Table 13. During the double-blind, placebo-controlled treatment period through Week 24, a total of 6 new fractures or pseudofractures appeared in 68 patients receiving CRYSVITA, compared to 8 new abnormalities in 66 patients receiving placebo (see Table 13).
Table 13. Comparison of Fracture Healing with CRYSVITA vs Placebo in Study 4 Double Blind Period:
| Active Fractures | Active Pseudofractures | Total Fractures | ||||
|---|---|---|---|---|---|---|
| Placebo n (%) | CRYSVITA n (%) | Placebo n (%) | CRYSVITA n (%) | Placebo n (%) | CRYSVITA n (%) | |
| No. of fractures at baseline | 13 | 14 | 78 | 51 | 91 | 65 |
| Healed at Week 24 | 0 (0%) | 7 (50%) | 7 (9%) | 21 (41%) | 7 (8%) | 28 (43%) |
During the open-label treatment period, the patients who continued receiving CRYSVITA showed continued healing of fractures at Week 48 [active fractures (n = 8, 57%), active pseudofractures (n = 33, 65%)]. In the ‘placebo to CRYSVITA’ group, fracture healing at Week 48 was observed for active fractures (n = 6, 46%), and active pseudofractures (n = 26, 33%).
Study 4 evaluated patient-reported XLH-related symptoms (pain, joint stiffness, and physical function).
At 24 weeks, the CRYSVITA arm showed a mean improvement from baseline (-7.9) compared to the placebo arm (+0.3) in the stiffness severity score (range 0 to 100; lower scores are reflective of symptom improvement).
At 24 weeks, no significant difference between CRYSVITA and placebo was demonstrated in patient-reported pain intensity or physical function score.
In Study 5, after 48 weeks of treatment, healing of osteomalacia was observed in ten patients as demonstrated by decreases in Osteoid volume/Bone volume (OV/BV) from a mean (SD) score of 26% (12.4) at baseline to 11% (6.5), a change of -57%. Osteoid thickness (O.Th) declined in eleven patients from a mean (SD) of 17 (4.1) micrometers to 12 (3.1) micrometers, a change of -33%. Mineralization lag time (MLt) declined in 6 patients from a mean (SD) of 594 (675) days to 156 (77) days, a mean change of -74%.
CRYSVITA has been evaluated in two studies enrolling a total of 27 patients with TIO.
Study 6 (NCT 02304367) is a single-arm open-label study that enrolled 14 adult patients with a confirmed diagnosis of FGF23-related hypophosphatemia produced by an underlying tumor that was not amenable to surgical excision or could not be located. Of the 14 TIO patients enrolled in Study 6, eight were male, and patients ranged from 33 years to 68 years of age (Median 59.5 years). Oral phosphate and active vitamin D analogs were discontinued two weeks prior to study enrollment. Patients received CRYSVITA every 4 weeks at a weight based starting dose of 0.3 mg/kg that was titrated to achieve a fasting serum phosphorus level of 2.5 to 4.0 mg/dL. The mean dose was 0.83 mg/kg at Week 20, 0.87 mg/kg at Week 48, 0.77 mg/kg at Week 96 and 0.71 mg/kg at Week 144.
Study 7 (NCT 02722798) is a single-arm open-label study. In Study 7, 13 adult patients with a confirmed diagnosis of TIO received CRYSVITA. Of the 13 TIO patients who received treatment in Study 7, six were male, and patients ranged from 41 years to 73 years of age (Median 58.0 years). Oral phosphate and active vitamin D analogs were discontinued two weeks prior to study enrollment. Patients received CRYSVITA every 4 weeks at a weight based starting dose of 0.3 mg/kg that was titratedto achieve a fasting serum phosphorus level of 2.5 to 4.0 mg/dL. The mean (SD) dose was 0.91 (0.59) mg/kg at Week 48, and 0.96 (0.70) mg/kg at Week 88.
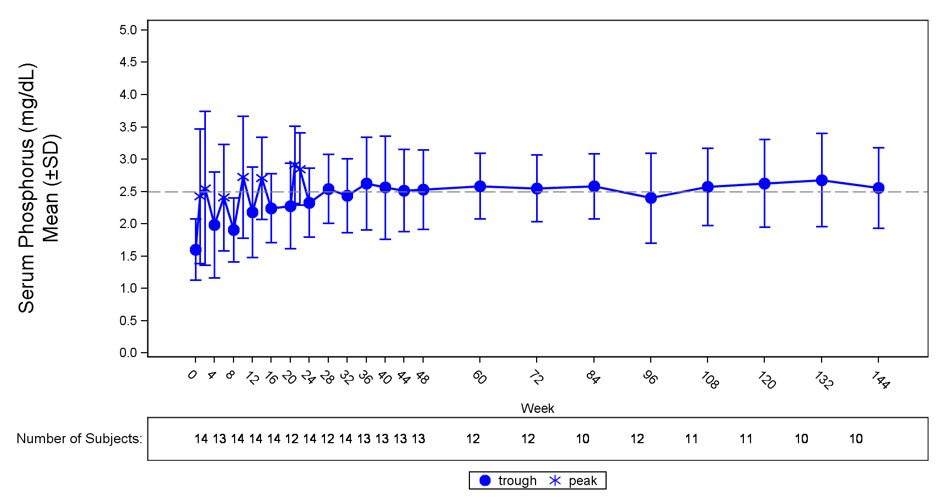
In Study 6, CRYSVITA increased mean (SD) serum phosphorus levels from 1.60 (0.47) mg/dL at baseline to 2.64 (0.76) mg/dL averaged across the midpoint of dose intervals through Week 24 with 50% of patients (7/14) achieving a mean serum phosphorus level above the LLN averaged across the midpoint of dose intervals through Week 24. Increase in the mean serum phosphorus concentrations was sustained near or above the LLN through Week 144 (Figure 3). The ratio of renal tubular maximum reabsorption rate of phosphate to glomerular filtration rate (TmP/GFR) increased in these patients from a mean (SD) of 1.12 (0.54) mg/dL at baseline to 2.12 (0.64) mg/dL at Week 48, and remained stable through Week 144.
Figure 3. Serum Phosphorus Concentration and Change from Baseline in Study 6 (mg/dL):
The dotted line represents the lower limit of normal (2.5 mg/dL) for patients in study 6.
In Study 7, CRYSVITA increased mean (SD) serum phosphorus levels from 1.62 (0.49) mg/dL at baseline to 2.63 (0.87) mg/dL averaged across the midpoint of dose intervals through Week 24 with 69% of patients (9/13) achieving a mean serum phosphorus level above the LLN averaged across the midpoint on dose interval through Week 24. Mean serum phosphorus concentrations were sustained above LLN through Week 88. The renal phosphate reabsorptive capacity, as assessed by TmP/GFR, increased from a mean (SD) of 1.15 (0.43) mg/dL at baseline to 2.30 mg/dL (0.48) mg/dL at Week 48.
In Study 6, osteomalacia was present at baseline in nine out of 11 patients with paired bone biopsies, and healing was assessed after 48 weeks of treatment. In these 9 patients with osteomalacia at baseline, OV/BV decreased from a mean (SD) score of 21.2% (19.9) at baseline to 13.9% (16.7), a change of -34%. O.Th declined from a mean (SD) of 18.9 (11.9) micrometers to 12.1 (10.1) micrometers, a change of -36%. MLt declined in 3 patients from a mean (SD) of 667 (414) days to 331 (396) days, a change of -50%.
In Study 7, osteomalacia was present at baseline in all 3 patients with paired bone biopsies, and healing was assessed after 48 weeks of treatment. In these 3 patients, OV/BV decreased from a mean (SD) score of 14.0% (15.2) at baseline to 9.2% (5.5), a change of -34%. O.Th declined from a mean (SD) of 16.0 (13.7) micrometers to 13.5 (7.1) micrometers, a change of -16%.
In Study 6, 99mtechnetium-labelled whole body bone scans were performed at baseline and subsequent timepoints during the study on all 14 patients. Bone scans allow for assessment of sites of increased tracer uptake in a wide range of bone conditions, including osteomalacia. In patients with TIO, increased tracer uptake on bone scan is presumed to be nontraumatic fractures and pseudofractures. At baseline, all patients had areas of tracer uptake with a total of 249 bone abnormalities across 14 patients. The number of areas of tracer uptake decreased from Week 48 through Week 144, suggesting healing of the bone abnormalities.
© All content on this website, including data entry, data processing, decision support tools, "RxReasoner" logo and graphics, is the intellectual property of RxReasoner and is protected by copyright laws. Unauthorized reproduction or distribution of any part of this content without explicit written permission from RxReasoner is strictly prohibited. Any third-party content used on this site is acknowledged and utilized under fair use principles.