Source: European Medicines Agency (EU) Revision Year: 2023 Publisher: Janssen-Cilag International NV, Turnhoutseweg 30, B-2340 Beerse, Belgium
Pharmacotherapeutic group: Drugs used in diabetes, blood glucose lowering drugs, excluding insulins
ATC code: A10BK02
The SGLT2 transporter, expressed in the proximal renal tubules, is responsible for the majority of the reabsorption of filtered glucose from the tubular lumen. Patients with diabetes have been shown to have elevated renal glucose reabsorption which may contribute to persistent elevated blood glucose concentrations. Canagliflozin is an orally-active inhibitor of SGLT2. By inhibiting SGLT2, canagliflozin reduces reabsorption of filtered glucose and lowers the renal threshold for glucose (RTG), and thereby increases UGE, lowering elevated plasma glucose concentrations by this insulin-independent mechanism in patients with type 2 diabetes. The increased UGE with SGLT2 inhibition also translates to an osmotic diuresis, with the diuretic effect leading to a reduction in systolic blood pressure; the increase in UGE results in a loss of calories and therefore a reduction in body weight, as has been demonstrated in studies of patients with type 2 diabetes.
Canagliflozin’s action to increase UGE directly lowering plasma glucose is independent of insulin. Improvement in homeostasis model assessment for beta-cell function (HOMA beta-cell) and improved beta-cell insulin secretion response to a mixed-meal challenge has been observed in clinical studies with canagliflozin.
In phase 3 studies, pre-meal administration of canagliflozin 300 mg provided a greater reduction in postprandial glucose excursion than observed with the 100 mg dose. This effect at the 300 mg dose of canagliflozin may, in part, be due to local inhibition of intestinal SGLT1 (an important intestinal glucose transporter) related to transient high concentrations of canagliflozin in the intestinal lumen prior to medicinal product absorption (canagliflozin is a low potency inhibitor of the SGLT1 transporter). Studies have shown no glucose malabsorption with canagliflozin.
Canagliflozin increases the delivery of sodium to the distal tubule by blocking SGLT2-dependent glucose and sodium reabsorption thereby increasing tubuloglomerular feedback, which is associated with a reduction in intraglomerular pressure and a decrease in hyperfiltration in preclinical models of diabetes and clinical studies.
Following single and multiple oral doses of canagliflozin to patients with type 2 diabetes, dose-dependent decreases in RTG and increases in UGE were observed. From a starting value of RTG of approximately 13 mmol/L, maximal suppression of 24-hour mean RTG was seen with the 300 mg daily dose to approximately 4 mmol/L to 5 mmol/L in patients with type 2 diabetes in phase 1 studies, suggesting a low risk for treatment-induced hypoglycaemia. The reductions in RTG led to increased UGE in subjects with type 2 diabetes treated with either 100 mg or 300 mg of canagliflozin ranging from 77 g/day to 119 g/day across the phase 1 studies; the UGE observed translates to a loss of 308 kcal/day to 476 kcal/day. The reductions in RTG and increases in UGE were sustained over a 26-week dosing period in patients with type 2 diabetes. Moderate increases (generally <400 mL to 500 mL) in daily urine volume were seen that attenuated over several days of dosing. Urinary uric acid excretion was transiently increased by canagliflozin (increased by 19% compared to baseline on day 1 and then attenuating to 6% on day 2 and 1% on day 13). This was accompanied by a sustained reduction in serum uric acid concentration of approximately 20%.
In a single-dose study in patients with type 2 diabetes, treatment with 300 mg before a mixed meal delayed intestinal glucose absorption and reduced postprandial glucose through both a renal and a non-renal mechanism.
Both improvement in glycaemic control and reduction of cardiovascular morbidity and mortality are an integral part of the treatment of type 2 diabetes.
A total of 10,501 patients with type 2 diabetes participated in ten double-blind, controlled clinical efficacy and safety studies conducted to evaluate the effects of Invokana on glycaemic control. The racial distribution was 72% White, 16% Asian, 5% Black, and 8% other groups. 17% of patients were Hispanic. 58% of patients were male. Patients had an overall mean age of 59.5 years (range 21 years to 96 years), with 3,135 patients ≥65 years of age and 513 patients ≥75 years of age. 58% of patients had a body mass index (BMI) ≥30 kg/m². In the clinical development programme, 1,085 patients with a baseline eGFR 30 mL/min/1.73 m² to <60 mL/min/1.73 m² were evaluated.
Canagliflozin was studied as monotherapy, dual therapy with metformin, dual therapy with a sulphonylurea, triple therapy with metformin and a sulphonylurea, triple therapy with metformin and pioglitazone, and as an add-on therapy with insulin (table 3). In general, canagliflozin produced clinically and statistically significant (p<0.001) results relative to placebo in glycaemic control, including HbA1c, the percentage of patients achieving HbA1c <7%, change from baseline fasting plasma glucose (FPG), and 2-hour postprandial glucose (PPG). In addition, reductions in body weight and systolic blood pressure relative to placebo were observed.
Furthermore, canagliflozin was studied as triple therapy with metformin and sitagliptin and dosed with a titration regimen, using a starting dose of 100 mg and titrated to 300 mg as early as week 6 in patients requiring additional glycaemic control who had appropriate eGFR and were tolerating canagliflozin 100 mg (table 3). Canagliflozin dosed with a titration regimen produced clinically and statistically significant (p<0.001) results relative to placebo in glycaemic control, including HbA1c and change from baseline fasting plasma glucose (FPG), and a statistically significant (p<0.01) improvement in the percentage of patients achieving HbA1c <7%. In addition, reductions in body weight and systolic blood pressure relative to placebo were observed.
Table 4. Efficacy results from placebo-controlled clinical studiesa:
| Monotherapy (26 weeks) | |||
| Canagliflozin | Placebo (N=192) | ||
| 100 mg (N=195) | 300 mg (N=197) | ||
| HbA1c (%) | |||
| Baseline (mean) | 8.06 | 8.01 | 7.97 |
| Change from baseline (adjusted mean) | -0.77 | -1.03 | 0.14 |
| Difference from placebo (adjusted mean) (95% CI) | -0.91b (-1.09; -0.73) | -1.16b (-1.34; -0.98) | N/Ac |
| Patients () achieving HbA1c <7 | 44.5b | 62.4b | 20.6 |
| Body weight | |||
| Baseline (mean) in kg | 85.9 | 86.9 | 87.5 |
| % change from baseline (adjusted mean) | -2.8 | -3.9 | -0.6 |
| Difference from placebo (adjusted mean) (95% CI) | -2.2b (-2.9; -1.6) | -3.3b (-4.0; -2.6) | N/Ac |
| Dual therapy with metformin (26 weeks) | |||
| Canagliflozin + metformin | Placebo + metformin (N=183) | ||
| 100 mg (N=368) | 300 mg (N=367) | ||
| HbA1c (%) | |||
| Baseline (mean) | 7.94 | 7.95 | 7.96 |
| Change from baseline (adjusted mean) | -0.79 | -0.94 | -0.17 |
| Difference from placebo (adjusted mean) (95% CI) | -0.62b (-0.76; -0.48) | -0.77b (-0.91; -0.64) | N/A |
| Patients () achieving HbA1c <7 | 45.5b | 57.8b | 29.8 |
| Body weight | |||
| Baseline (mean) in kg | 88.7 | 85.4 | 86.7 |
| % change from baseline (adjusted mean) | -3.7 | -4.2 | -1.2 |
| Difference from placebo (adjusted mean) (95% CI) | -2.5b (-3.1; -1.9) | -2.9b (-3.5; -2.3) | N/Ac |
| Triple therapy with metformin and sulphonylurea (26 weeks) | |||
| Canagliflozin + metformin and sulphonylurea | Placebo + metformin and sulphonylurea (N=156) | ||
| 100 mg (N=157) | 300 mg (N=156) | ||
| HbA1c (%) | |||
| Baseline (mean) | 8.13 | 8.13 | 8.12 |
| Change from baseline (adjusted mean) | -0.85 | -1.06 | -0.13 |
| Difference from placebo (adjusted mean) (95% CI) | -0.71b (-0.90; -0.52) | -0.92b (-1.11; -0.73) | N/Ac |
| Patients () achieving HbA1c <7 | 43.2b | 56.6b | 18.0 |
| Body weight | |||
| Baseline (mean) in kg | 93.5 | 93.5 | 90.8 |
| % change from baseline (adjusted mean) | -2.1 | -2.6 | -0.7 |
| Difference from placebo (adjusted mean) (95% CI) | -1.4b (-2.1; -0.7) | -2.0b (-2.7; -1.3) | N/Ac |
| Add-on therapy with insulind (18 weeks) | |||
| Canagliflozin + insulin | Placebo + insulin (N=565) | ||
| 100 mg (N=566) | 300 mg (N=587) | ||
| HbA1c (%) | |||
| Baseline (mean) | 8.33 | 8.27 | 8.20 |
| Change from baseline (adjusted mean) | -0.63 | -0.72 | 0.01 |
| Difference from placebo (adjusted mean) (95% CI) | -0.65b (-0.73; -0.56) | -0.73b (-0.82; -0.65) | N/Ac |
| Patients () achieving HbA1c <7 | 19.8b | 24.7b | 7.7 |
| Body weight | |||
| Baseline (mean) in kg | 96.9 | 96.7 | 97.7 |
| % change from baseline (adjusted mean) | -1.8 | -2.3 | 0.1 |
| Difference from placebo (adjusted mean) (97.5% CI) | -1.9b (-2.2; -1.5) | -2.4b (-2.8; -2.0) | N/Ac |
| Triple therapy with metformin and sitagliptine (26 weeks) | |||
| Canagliflozin + metformin and sitaglipting (N=107) | Placebo + metformin and sitagliptin (N=106) | ||
| HbA1c (%) | |||
| Baseline (mean) | 8.53 | 8.38 | |
| Change from baseline (adjusted mean) | -0.91 | -0.01 | |
| Difference from placebo (adjusted mean) (95% CI) | -0.89b (-1.19; -0.59) | ||
| Patients () achieving HbA1c <7 | 32f | 12 | |
| Fasting Plasma Glucose (mg/dL) | |||
| Baseline (mean) | 186 | 180 | |
| Change from baseline (adjusted mean) | -30 | -3 | |
| Difference from placebo (adjusted mean) (95% CI) | -27b (-40; -14) | ||
| Body Weight | |||
| Baseline (mean) in kg | 93.8 | 89.9 | |
| % change from baseline (adjusted mean) | -3.4 | -1.6 | |
| Difference from placebo (adjusted mean) (95% CI) | -1.8b (-2.7; -0.9) | ||
a Intent-to-treat population using last observation in study prior to glycaemic rescue therapy.
b p<0.001 compared to placebo.
c Not applicable.
d Canagliflozin as add-on therapy to insulin (with or without other glucose-lowering medicinal products).
e Canagliflozin 100 mg uptitrated to 300 mg
f p<0.01 compared to placebo
g 90.7% of subjects in the canagliflozin group uptitrated to 300 mg
In addition to the studies presented above, glycaemic efficacy results observed in an 18-week dual therapy sub-study with a sulphonylurea and a 26-week triple therapy study with metformin and pioglitazone were generally comparable with those observed in other studies.
Canagliflozin was compared to glimepiride as dual therapy with metformin and compared to sitagliptin as triple therapy with metformin and a sulphonylurea (table 5). Canagliflozin 100 mg as dual therapy with metformin produced similar reductions in HbA1c from baseline and 300 mg produced superior (p<0.05) reductions in HbA1c compared to glimepiride, thus demonstrating non-inferiority. A lower proportion of patients treated with canagliflozin 100 mg (5.6%) and canagliflozin 300 mg (4.9%) experienced at least one episode/event of hypoglycaemia over 52 weeks of treatment compared to the group treated with glimepiride (34.2%). In a study comparing canagliflozin 300 mg to sitagliptin 100 mg in triple therapy with metformin and a sulphonylurea, canagliflozin demonstrated non-inferior (p<0.05) and superior (p<0.05) reduction in HbA1c relative to sitagliptin. The incidence of hypoglycaemia episodes/events with canagliflozin 300 mg and sitagliptin 100 mg was 40.7% and 43.2%, respectively. Significant improvements in body weight and reductions in systolic blood pressure compared to both glimepiride and sitagliptin were also observed.
Table 4. Efficacy results from active-controlled clinical studiesa:
| Compared to glimepiride as dual therapy with metformin (52 weeks) | |||
| Canagliflozin + metformin | Glimepiride (titrated) + metformin (N=482) | ||
| 100 mg (N=483) | 300 mg (N=485) | ||
| HbA1c (%) | |||
| Baseline (mean) | 7.78 | 7.79 | 7.83 |
| Change from baseline (adjusted mean) | -0.82 | -0.93 | -0.81 |
| Difference from glimepiride (adjusted mean) (95% CI) | -0.01b (−0.11; 0.09) | -0.12b (−0.22; −0.02) | N/Ac |
| Patients () achieving HbA1c <7 | 3.6 | 60.1 | 55.8 |
| Body weight | |||
| Baseline (mean) in kg | 86.8 | 86.6 | 86.6 |
| % change from baseline (adjusted mean) | -4.2 | -4.7 | 1.0 |
| Difference from glimepiride (adjusted mean) (95% CI) | -5.2b (−5.7; −4.7) | -5.7b (−6.2; −5.1) | N/Ac |
| Compared to sitagliptin as triple therapy with metformin and sulphonylurea (52 weeks) | |||
| Canagliflozin 300 mg + metformin and sulphonylurea (N=377) | Sitagliptin 100 mg + metformin and sulphonylurea (N=378) | ||
| HbA1c (%) | |||
| Baseline (mean) | 8.12 | 8.13 | |
| Change from baseline (adjusted mean) | -1.03 | -0.66 | |
| Difference from sitagliptin (adjusted mean) (95% CI) | -0.37b (-0.50; -0.25) | N/Ac | |
| Patients () achieving HbA1c <7 | 47.6 | 35.3 | |
| Body weight | |||
| Baseline (mean) in kg | 87.6 | 89.6 | |
| % change from baseline (adjusted mean) | -2.5 | 0.3 | |
| Difference from sitagliptin (adjusted mean) (95% CI) | -2.8d (-3.3; -2.2) | N/Ac | |
a Intent-to-treat population using last observation in study prior to glycaemic rescue therapy.
b p<0.05.
c Not applicable.
d p<0.001.
Canagliflozin was evaluated in combination with metformin as initial combination therapy in patients with type 2 diabetes failing diet and exercise. Canagliflozin 100 mg and canagliflozin 300 mg in combination with metformin XR resulted in a statistically significant greater improvement in HbA1c compared to their respective canagliflozin doses (100 mg and 300 mg) alone or metformin XR alone (table 6).
Table 6. Results from 26-Week Active-Controlled Clinical Study of Canagliflozin as Initial Combination Therapy with Metformin*:
| Efficacy Parameter | Metformin XR (N=237) | Canagliflozin 100 mg (N=237) | Canagliflozin 300 mg (N=238) | Canagliflozin 100 mg + Metformin XR (N=237) | Canagliflozin 300 mg + Metformin XR (N=237) |
|---|---|---|---|---|---|
| HbA1c (%) | |||||
| Baseline (mean) | 8.81 | 8.78 | 8.77 | 8.83 | 8.90 |
| Change from baseline (adjusted mean) | -1.30 | -1.37 | -1.42 | -1.77 | -1.78 |
| Difference from canagliflozin 100 mg (adjusted mean) (95% CI)† | -0.40‡ (-0.59, -0.21) | ||||
| Difference from canagliflozin 300 mg (adjusted mean) (95% CI)† | -0.36‡ (-0.56, -0.17) | ||||
| Difference from metformin XR (adjusted mean) (95% CI)† | -0.06‡ (-0.26, 0.13) | -0.11‡ (-0.31, 0.08) | -0.46‡ (-0.66, -0.27) | -0.48‡ (-0.67, -0.28) | |
| Percent of patients achieving HbA1c <7% | 43 | 39 | 43 | 50§§ | 57§§ |
| Body Weight | |||||
| Baseline (mean) in kg | 92.1 | 90.3 | 93.0 | 88.3 | 91.5 |
| % change from baseline (adjusted mean) | -2.1 | -3.0 | -3.9 | -3.5 | -4.2 |
| Difference from metformin XR (adjusted mean) (95% CI)† | -0.9§§ (-1.6, -0.2) | -1.8§ (-2.6, -1.1) | -1.4‡ (-2.1, -0.6) | -2.1‡ (-2.9, -1.4) | |
* Intent-to-treat population
† Least squares mean adjusted for covariates including baseline value and stratification factor
‡ Adjusted p=0.001
§ Adjusted p<0.01
§§ Adjusted p<0.05
In three studies conducted in special populations (older patients, patients with an eGFR of 30 mL/min/1.73 m² to <50 mL/min/1.73 m² and patients with or at high risk for cardiovascular disease), canagliflozin was added to patients' current stable diabetes treatments (diet, monotherapy, or combination therapy).
A total of 714 patients ≥55 years of age to ≤80 years of age (227 patients 65 years of age to <75 years of age and 46 patients 75 years of age to ≤80 years of age) with inadequate glycaemic control on current diabetes treatment (glucose-lowering medicinal products and/or diet and exercise) participated in a double-blind, placebo-controlled study over 26 weeks. Statistically significant (p<0.001) changes from baseline HbA1c relative to placebo of -0.57% and -0.70% were observed for 100 mg and 300 mg, respectively (see sections 4.2 and 4.8).
In a pooled analysis of patients (N=721) with a baseline eGFR 45 mL/min/1.73 m² to <60 mL/min/1.73 m², canagliflozin provided clinically meaningful reduction in HbA1c compared to placebo, with -0.47% for canagliflozin 100 mg and -0.52% for canagliflozin 300 mg. Patients with a baseline eGFR 45 mL/min/1.73 m² to <60 mL/min/1.73 m² treated with canagliflozin 100 mg and 300 mg exhibited mean improvements in percent change in body weight relative to placebo of -1.8% and -2.0%, respectively.
In a pooled analysis of patients (N=348) with a baseline eGFR <45 mL/min/1.73 m², canagliflozin provided a modest reduction in HbA1c compared to placebo, with -0.23% for canagliflozin 100 mg and -0.39% for canagliflozin 300 mg.
The majority of patients with a baseline eGFR <60 mL/min/1.73 m² were on insulin and/or a sulphonylurea. Consistent with the expected increase of hypoglycaemia when a medicinal product not associated with hypoglycaemia is added to insulin and/or sulphonylurea, an increase in hypoglycaemia episodes/events was seen when canagliflozin was added to insulin and/or a sulphonylurea (see section 4.8).
In four placebo-controlled studies, treatment with canagliflozin as monotherapy or add-on therapy with one or two oral glucose-lowering medicinal products resulted in mean changes from baseline relative to placebo in FPG of -1.2 mmol/L to -1.9 mmol/L for canagliflozin 100 mg and -1.9 mmol/L to -2.4 mmol/L for canagliflozin 300 mg, respectively. These reductions were sustained over the treatment period and near maximal after the first day of treatment.
Using a mixed-meal challenge, canagliflozin as monotherapy or add-on therapy with one or two oral glucose-lowering medicinal products reduced postprandial glucose (PPG) from baseline relative to placebo by -1.5 mmol/L to -2.7 mmol/L for canagliflozin 100 mg and -2.1 mmol/L to -3.5 mmol/L for 300 mg, respectively, due to reductions in the pre-meal glucose concentration and reduced postprandial glucose excursions.
Canagliflozin 100 mg and 300 mg as monotherapy and as dual or triple add-on therapy resulted in statistically significant reductions in the percentage of body weight at 26 weeks relative to placebo. In two 52-week active-controlled studies comparing canagliflozin to glimepiride and sitagliptin, sustained and statistically significant mean reductions in the percentage of body weight for canagliflozin as add-on therapy to metformin were -4.2% and -4.7% for canagliflozin 100 mg and 300 mg, respectively, compared to the combination of glimepiride and metformin (1.0%) and -2.5% for canagliflozin 300 mg in combination with metformin and a sulphonylurea compared to sitagliptin in combination with metformin and a sulphonylurea (0.3%).
A subset of patients (N=208) from the active-controlled dual therapy study with metformin who underwent dual energy X-ray densitometry (DXA) and abdominal computed tomography (CT) scans for evaluation of body composition demonstrated that approximately two-thirds of the weight loss with canagliflozin was due to loss of fat mass with similar amounts of visceral and abdominal subcutaneous fat being lost. Two hundred eleven (211) patients from the clinical study in older patients participated in a body composition substudy using DXA body composition analysis. This demonstrated that approximately two-thirds of the weight loss associated with canagliflozin was due to loss of fat mass relative to placebo. There were no meaningful changes in bone density in trabecular and cortical regions.
In placebo-controlled studies, treatment with canagliflozin 100 mg and 300 mg resulted in mean reductions in systolic blood pressure of -3.9 mmHg and -5.3 mmHg, respectively, compared to placebo (-0.1 mmHg) and a smaller effect on diastolic blood pressure with mean changes for canagliflozin 100 mg and 300 mg of -2.1 mmHg and -2.5 mmHg, respectively, compared to placebo (-0.3 mmHg). There was no notable change in heart rate.
A substudy of patients with baseline HbA1c >10% to ≤12% with canagliflozin as monotherapy resulted in reductions from baseline in HbA1c (not placebo-adjusted) of -2.13% and -2.56% for canagliflozin 100 mg and 300 mg, respectively.
The effect of canagliflozin on cardiovascular events in adults with type 2 diabetes who had established cardiovascular (CV) disease or were at risk for CVD (two or more CV risk factors), was evaluated in the CANVAS Program (integrated analysis of the CANVAS and the CANVAS-R study). These studies were multicenter, multi-national, randomised, double-blind, parallel group, with similar inclusion and exclusion criteria and patient populations. The CANVAS Program compared the risk of experiencing a Major Adverse Cardiovascular Event (MACE) defined as the composite of cardiovascular death, nonfatal myocardial infarction and nonfatal stroke, between canagliflozin and placebo on a background of standard of care treatments for diabetes and atherosclerotic cardiovascular disease.
In CANVAS, subjects were randomly assigned 1:1:1 to canagliflozin 100 mg, canagliflozin 300 mg, or matching placebo. In CANVAS-R, subjects were randomly assigned 1:1 to canagliflozin 100 mg or matching placebo, and titration to 300 mg was permitted (based on tolerability and glycaemic needs) after Week 13. Concomitant antidiabetic and atherosclerotic therapies could be adjusted, according to the standard care for these diseases.
A total of 10,134 patients were treated (4,327 in CANVAS and 5,807 in CANVAS-R; total of 4,344 randomly assigned to placebo and 5,790 to canagliflozin) and exposed for a mean of 149 weeks (exposed for a mean of 223 weeks in CANVAS and 94 weeks in CANVAS-R). Vital status was obtained for 99.6% of subjects across the studies. The mean age was 63 years and 64% were male.
Sixty-six percent of subjects had a history of established cardiovascular disease, with 56% having a history of coronary disease, 19% with cerebrovascular disease, and 21% with peripheral vascular disease; 14% had a history of heart failure.
The mean HbA1c at baseline was 8.2% and mean duration of diabetes was 13.5 years.
Patients were required to have an eGFR >30 mL/min/1.73 m² at study entry.Baseline renal function was normal or mildly impaired in 80% of patients and moderately impaired in 20% of patients (mean eGFR 77 mL/min/1.73 m²). At baseline, patients were treated with one or more antidiabetic medicinal product including metformin (77%), insulin (50%), and sulfonylurea (43%).
The primary endpoint in the CANVAS Program was the time to first occurrence of a MACE. Secondary endpoints within a sequential conditional hypothesis testing were all-cause mortality and cardiovascular mortality.
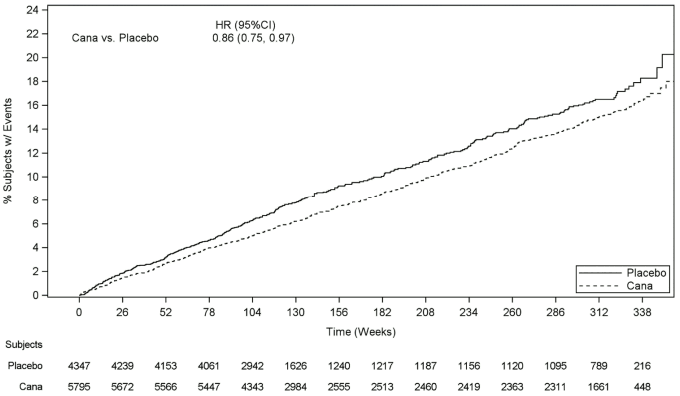
Patients in the pooled canagliflozin groups (pooled analysis of canagliflozin 100 mg, canagliflozin 300 mg, and canagliflozin up-titrated from 100 mg to 300 mg) had a lower rate of MACE as compared to placebo: 2.69 versus 3.15 patients per 100 patient-years (HR of the pooled analysis: 0.86; 95% CI (0.75, 0.97).
Based on the Kaplan-Meier plot for the first occurrence of MACE, shown below, the reduction in MACE in the canagliflozin group was observed as early as Week 26 and was maintained throughout the remainder of the study (see Figure 1).
Figure 1. Time to First Occurrence of MACE:
There were 2,011 patients with eGFR 30 to <60 mL/min/1.73 m². The MACE findings in this subgroup were consistent with the overall findings.
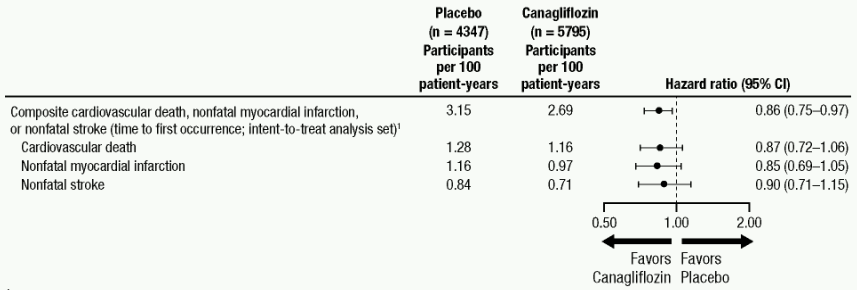
Each MACE component positively contributed to the overall composite, as shown in Figure 2. Results for the 100 mg and 300 mg canagliflozin doses were consistent with results for the combined dose groups.
Figure 2. Treatment Effect for the Primary Composite Endpoint and its Components:
1 P value for superiority (2-sided) = 0.0158.
In the combined canagliflozin group, the HR for all-cause mortality versus placebo was 0.87 (0.74, 1.01).
Canagliflozin reduced the risk for heart failure requiring hospitalization compared to placebo (HR: 0.67; 95% CI (0.52, 0.87)).
For time to first adjudicated nephropathy event (doubling of serum creatinine, need for renal-replacement therapy, and renal death), the HR was 0.53 (95% CI: 0.33, 0.84) for canagliflozin (0.15 events per 100 patient-years) versus placebo (0.28 events per 100 patient-years). In addition, canagliflozin reduced progression of albuminuria by 25.8% versus placebo 29.2% (HR: 0.73; 95% CI: 0.67, 0.79) in patients with baseline normo- or micro-albuminuria.
The effect of canagliflozin 100 mg on renal events in adults with type 2 diabetes and diabetic kidney disease (DKD) with estimated glomerular filtration rate (eGFR) 30 to <90 mL/min/1.73 m² and albuminuria (˃300 to 5000 mg/g of creatinine), was evaluated in the Canagliflozin and Renal Events in Diabetes with Established Nephropathy Clinical Evaluation Trial (CREDENCE). This was a multi-centre, multi-national, randomised, double-blind, event-driven, placebo-controlled, parallel-group study. The CREDENCE study compared the risk of experiencing DKD defined as the composite of end-stage kidney disease, doubling of serum creatinine, and renal or cardiovascular death, between canagliflozin 100 mg and placebo on a background of standard of care treatments for DKD, including angiotensin-converting enzyme inhibitor (ACEi) or angiotensin receptor blocker (ARB). Canagliflozin 300 mg was not investigated in this study.
In CREDENCE, subjects were randomly assigned 1:1 to canagliflozin 100 mg or placebo, stratified by screening eGFR 30 to <45, 45 to <60, 60 to <90 mL/min/1.73 m². Treatment with canagliflozin 100 mg was continued in patients until the initiation of dialysis or in the event of renal transplantation.
A total of 4,397 subjects were treated and exposed for a mean of 115 weeks. The mean age was 63 years and 66% were male.
The mean baseline HbA1c was 8.3% and baseline median urine albumin/creatinine was 927 mg/g. The most frequent antihyperglycaemic agents (AHA) used at baseline were insulin (65.5%), biguanides (57.8%), and sulfonylureas (28.8%). Nearly all subjects (99.9%) were on ACEi or ARB at randomisation. About 92% of the subjects were on cardiovascular therapies (not including ACEi/ARBs) at baseline, with approximately 60% taking an anti-thrombotic agent (including acetylsalicylic acid) and 69% on statins.
The mean baseline eGFR was 56.2 mL/min/1.73 m² and approximately 60% of the population had a baseline eGFR of <60 mL/min/1.73 m². The proportion of subjects with prior CV disease was 50.4%; 14.8% had a history of heart failure.
The primary composite endpoint in the CREDENCE study was the time to first occurrence of ESKD (defined as an eGFR <15 mL/min/1.73 m², initiation of chronic dialysis or renal transplant), doubling of serum creatinine, and renal or CV death.
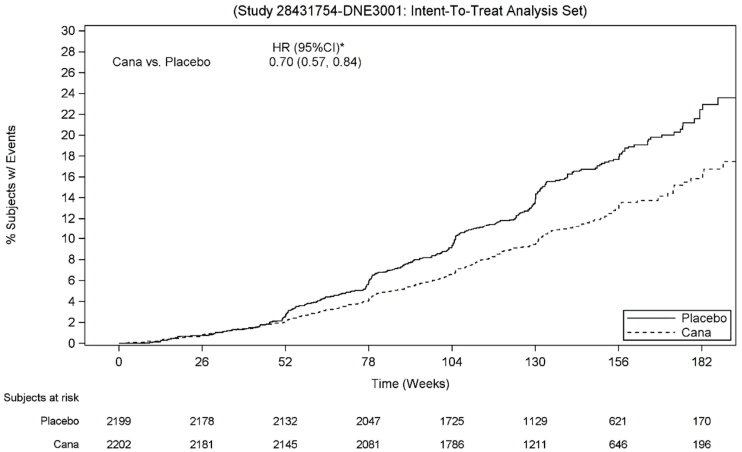
Canagliflozin 100 mg significantly reduced the risk of first occurrence of the primary composite endpoint of ESKD, doubling of serum creatinine, and renal or CV death [p<0.0001; HR: 0.70; 95% CI: 0.57, 0.84] (see Figure 4). Treatment effect was consistent across subgroups, including all three eGFR strata and subjects with or without a history of CV disease.
Based on the Kaplan-Meier plot for the time to first occurrence of the primary composite endpoint shown below, the treatment effect was evident beginning from Week 52 with canagliflozin 100 mg and was maintained through the end of study (see Figure 3).
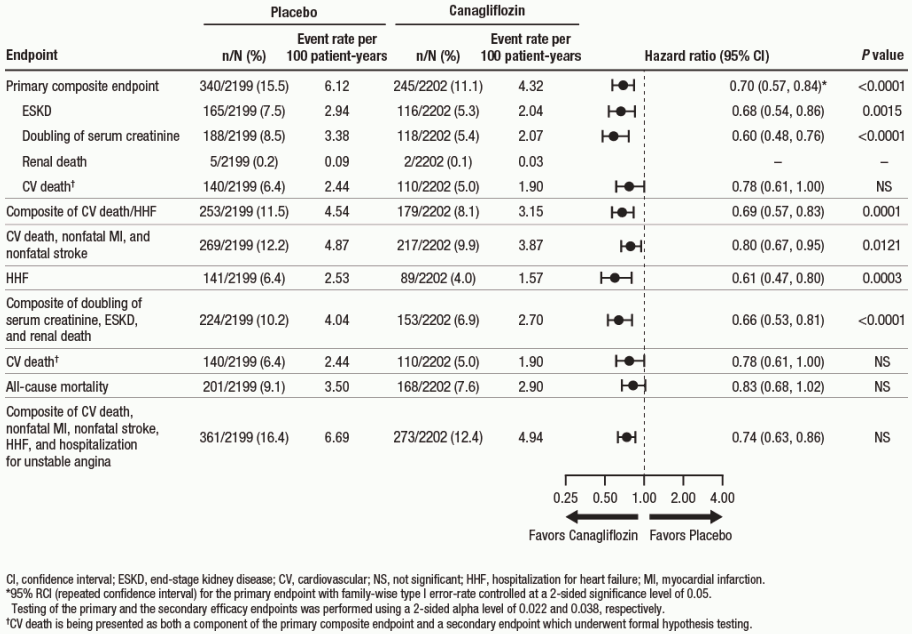
Canagliflozin 100 mg significantly reduced the risk of cardiovascular secondary endpoints, as shown in Figure 4.
Figure 3. CREDENCE: Time to first occurrence of the primary composite endpoint:
* 95% RCI (Repeated Confidence Interval) for the primary endpoint with family-wise type I error-rate controlled at a 2-sided significance level of 0.05.
Figure 4. Treatment effect for the primary composite endpoint and its components and secondary endpoints:
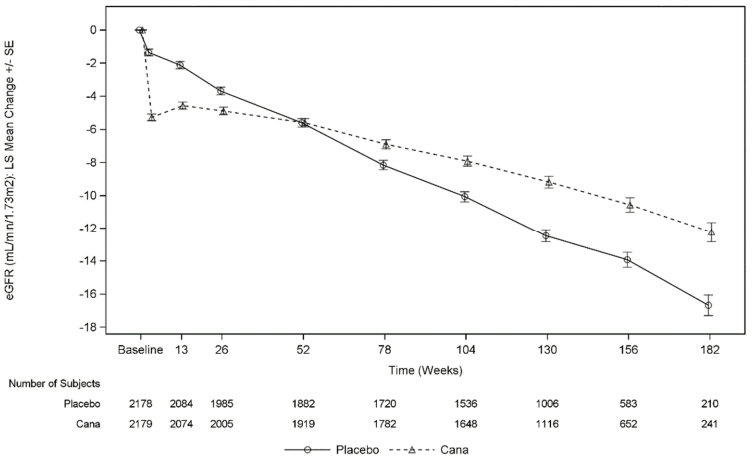
As shown in Figure 5, the eGFR in placebo-treated patients demonstrated a progressive linear decline over time; in contrast, the canagliflozin group showed an acute decrease at Week 3, followed by an attenuated decline over time; after Week 52, the LS mean decrease in eGFR was smaller in the canagliflozin group than in the placebo group, and the treatment effect was maintained through the end of treatment.
Figure 5. LS mean change from baseline in eGFR over time (on-treatment analysis set):
In CREDENCE, the incidence rate for renal-related adverse events was lower in the canagliflozin 100 mg group compared with the placebo group (5.71 and 7.91 per 100 patient-years in canagliflozin 100 mg and placebo, respectively).
The European Medicines Agency has deferred the obligation to submit the results of studies with canagliflozin in one or more subsets of the paediatric population in type 2 diabetes (see section 4.2 for information on paediatric use).
The pharmacokinetics of canagliflozin are essentially similar in healthy subjects and patients with type 2 diabetes. After single-dose oral administration of 100 mg and 300 mg in healthy subjects, canagliflozin was rapidly absorbed, with peak plasma concentrations (median Tmax) occurring 1 hour to 2 hours post-dose. Plasma Cmax and AUC of canagliflozin increased in a dose-proportional manner from 50 mg to 300 mg. The apparent terminal half-life (t½) (expressed as mean ± standard deviation) was 10.6 ± 2.13 hours and 13.1 ± 3.28 hours for the 100 mg and 300 mg doses, respectively. Steady-state was reached after 4 days to 5 days of once-daily dosing with canagliflozin 100 mg to 300 mg. Canagliflozin does not exhibit time-dependent pharmacokinetics, and accumulated in plasma up to 36% following multiple doses of 100 mg and 300 mg.
The mean absolute oral bioavailability of canagliflozin is approximately 65%. Co-administration of a high-fat meal with canagliflozin had no effect on the pharmacokinetics of canagliflozin; therefore, Invokana may be taken with or without food. However, based on the potential to reduce postprandial plasma glucose excursions due to delayed intestinal glucose absorption, it is recommended that Invokana be taken before the first meal of the day (see sections 4.2 and 5.1).
The mean steady-state volume of distribution of canagliflozin following a single intravenous infusion in healthy subjects was 83.5 litres, suggesting extensive tissue distribution. Canagliflozin is extensively bound to proteins in plasma (99%), mainly to albumin. Protein binding is independent of canagliflozin plasma concentrations. Plasma protein binding is not meaningfully altered in patients with renal or hepatic impairment.
O-glucuronidation is the major metabolic elimination pathway for canagliflozin, which is mainly glucuronidated by UGT1A9 and UGT2B4 to two inactive O-glucuronide metabolites. CYP3A4-mediated (oxidative) metabolism of canagliflozin is minimal (approximately 7%) in humans.
In in vitro studies, canagliflozin neither inhibited cytochrome P450 CYP1A2,CYP2A6, CYP2C19, CYP2D6, or CYP2E1, CYP2B6, CYP2C8, CYP2C9, nor induced CYP1A2, CYP2C19, CYP2B6, CYP3A4 at higher than therapeutic concentrations. No clinically relevant effect on CYP3A4 was observed in vivo (see section 4.5).
Following administration of a single oral [14C]canagliflozin dose to healthy subjects, 41.5%, 7.0%, and 3.2% of the administered radioactive dose was recovered in faeces as canagliflozin, a hydroxylated metabolite, and an O-glucuronide metabolite, respectively. Enterohepatic circulation of canagliflozin was negligible.
Approximately 33% of the administered radioactive dose was excreted in urine, mainly as O-glucuronide metabolites (30.5%). Less than 1% of the dose was excreted as unchanged canagliflozin in urine. Renal clearance of canagliflozin 100 mg and 300 mg doses ranged from 1.30 mL/min to 1.55 mL/min.
Canagliflozin is a low-clearance substance, with a mean systemic clearance of approximately 192 mL/min in healthy subjects following intravenous administration.
A single-dose, open-label study evaluated the pharmacokinetics of canagliflozin 200 mg in subjects with varying degrees of renal impairment (classified using CrCl based on the Cockroft-Gault equation) compared to healthy subjects. The study included 8 subjects with normal renal function (CrCl ≥80 mL/min), 8 subjects with mild renal impairment (CrCl 50 mL/min to <80 mL/min), 8 subjects with moderate renal impairment (CrCl 30 mL/min to <50 mL/min), and 8 subjects with severe renal impairment (CrCl <30 mL/min) as well as 8 subjects with ESRD on haemodialysis.
The Cmax of canagliflozin was moderately increased by 13%, 29%, and 29% in subjects with mild, moderate, and severe renal failure, respectively, but not in subjects on haemodialysis. Compared to healthy subjects, plasma AUC of canagliflozin was increased by approximately 17%, 63%, and 50% in subjects with mild, moderate, and severe renal impairment, respectively, but was similar for ESRD subjects and healthy subjects.
Canagliflozin was negligibly removed by haemodialysis.
Relative to subjects with normal hepatic function, the geometric mean ratios for Cmax and AUC∞ of canagliflozin were 107% and 110%, respectively, in subjects with Child-Pugh class A (mild hepatic impairment) and 96% and 111%, respectively, in subjects with Child-Pugh class B (moderate) hepatic impairment following administration of a single 300 mg dose of canagliflozin.
These differences are not considered to be clinically meaningful. There is no clinical experience in patients with Child-Pugh class C (severe) hepatic impairment.
Age had no clinically meaningful effect on the pharmacokinetics of canagliflozin based on a population pharmacokinetic analysis (see sections 4.2, 4.4, and 4.8).
A paediatric phase 1 study examined the pharmacokinetics and pharmacodynamics of canagliflozin in children and adolescents ≥10 to <18 years of age with type 2 diabetes mellitus. The observed pharmacokinetic and pharmacodynamic responses were consistent with those found in adult subjects.
Pharmacogenetics:
Both UGT1A9 and UGT2B4 are subject to genetic polymorphism. In a pooled analysis of clinical data, increases in canagliflozin AUC of 26% were observed in UGT1A9*1/*3 carriers and 18% in UGT2B4*2/*2 carriers. These increases in canagliflozin exposure are not expected to be clinically relevant. The effect of being homozygote (UGT1A9*3/*3, frequency <0.1%) is probably more marked, but has not been investigated.
Gender, race/ethnicity, or body mass index had no clinically meaningful effect on the pharmacokinetics of canagliflozin based on a population pharmacokinetic analysis.
Non-clinical data reveal no special hazard for humans based on conventional studies of safety pharmacology, repeated dose toxicity, and genotoxicity.
Canagliflozin showed no effects on fertility and early embryonic development in the rat at exposures up to 19 times the human exposure at the maximum recommended human dose (MRHD).
In an embryo-foetal development study in rats, ossification delays of metatarsal bones were observed at systemic exposures 73 times and 19 times higher than the clinical exposures at the 100 mg and 300 mg doses. It is unknown whether ossification delays can be attributed to effects of canagliflozin on calcium homeostasis observed in adult rats. Ossification delays were also observed for the combination of canagliflozin and metformin, which were more prominent than for metformin alone at canagliflozin exposures 43 times and 12 times higher than clinical exposures at 100 mg and 300 mg doses.
In a pre- and postnatal development study, canagliflozin administered to female rats from gestation day 6 to lactation day 20 resulted in decreased body weights in male and female offspring at maternally toxic doses >30 mg/kg/day (exposures ≥5.9 times the human exposure to canagliflozin at the MHRD). Maternal toxicity was limited to decreased body weight gain.
A study in juvenile rats administered canagliflozin from day 1 through day 90 postnatal did not show increased sensitivity compared to effects observed in adults rats. However, dilatation of the renal pelvis was noticed with a No Observed Effect Level (NOEL) at exposures 2.4 times and 0.6 times the clinical exposures at 100 mg and 300 mg doses, respectively, and did not fully reverse within the approximately 1-month recovery period. Persistent renal findings in juvenile rats can most likely be attributed to reduced ability of the developing rat kidney to handle canagliflozin-increased urine volumes, as functional maturation of the rat kidney continues through 6 weeks of age.
Canagliflozin did not increase the incidence of tumours in male and female mice in a 2-year study at doses of 10, 30, and 100 mg/kg. The highest dose of 100 mg/kg provided up to 14 times the clinical dose of 300 mg based on AUC exposure. Canagliflozin increased the incidence of testicular Leydig cell tumours in male rats at all doses tested (10, 30, and 100 mg/kg); the lowest dose of 10 mg/kg is approximately 1.5 times the clinical dose of 300 mg based on AUC exposure. The higher doses of canagliflozin (100 mg/kg) in male and female rats increased the incidence of pheochromocytomas and renal tubular tumours. Based on AUC exposure, the NOEL of 30 mg/kg/day for pheochromocytomas and renal tubular tumours is approximately 4.5 times the exposure at the daily clinical dose of 300 mg. Based on preclinical and clinical mechanistic studies, Leydig cell tumours, renal tubule tumours, and pheochromocytomas are considered to be rat-specific. Canagliflozin-induced renal tubule tumours and pheochromocytomas in rats appear to be caused by carbohydrate malabsorption as a consequence of intestinal SGLT1 inhibitory activity of canagliflozin in the gut of rats; mechanistic clinical studies have not demonstrated carbohydrate malabsorption in humans at canagliflozin doses of up to 2-times the maximum recommended clinical dose. The Leydig cell tumours are associated with an increase in luteinizing hormone (LH), which is a known mechanism of Leydig cell tumour formation in rats. In a 12-week clinical study, unstimulated LH did not increase in male patients treated with canagliflozin.
© All content on this website, including data entry, data processing, decision support tools, "RxReasoner" logo and graphics, is the intellectual property of RxReasoner and is protected by copyright laws. Unauthorized reproduction or distribution of any part of this content without explicit written permission from RxReasoner is strictly prohibited. Any third-party content used on this site is acknowledged and utilized under fair use principles.