INREBIC Capsule Ref.[10051] Active ingredients: Fedratinib
Source: FDA, National Drug Code (US) Revision Year: 2020
12.1. Mechanism of Action
Fedratinib is an oral kinase inhibitor with activity against wild type and mutationally activated Janus Associated Kinase 2 (JAK2) and FMS-like tyrosine kinase 3 (FLT3). Fedratinib is a JAK2-selective inhibitor with higher inhibitory activity for JAK2 over family members JAK1, JAK3 and TYK2. Abnormal activation of JAK2 is associated with myeloproliferative neoplasms (MPNs), including myelofibrosis and polycythemia vera. In cell models expressing mutationally active JAK2 V617F or FLT3 ITD, fedratinib reduced phosphorylation of signal transducer and activator of transcription (STAT3/5) proteins, inhibited cell proliferation, and induced apoptotic cell death. In mouse models of JAK2 V617F-driven myeloproliferative disease, fedratinib blocked phosphorylation of STAT3/5, and improved survival, white blood cell counts, hematocrit, splenomegaly, and fibrosis.
12.2. Pharmacodynamics
Fedratinib inhibited cytokine-induced STAT3 phosphorylation in whole blood from patients with myelofibrosis. The inhibition of STAT3 phosphorylation was maximal approximately 2 hours after the first dose, with values returning to near baseline at 24 hours. After daily administration of fedratinib, levels of inhibition at steady state PK were similar to the maximal inhibition reached after the first dose of 300 (0.75 times the recommended dose), 400 or 500 mg (1.25 times the recommended dose) of fedratinib.
Cardiac Electrophysiology
The potential for QTc prolongation with fedratinib was evaluated in 31 patients with solid tumors. No large mean increase in the QTc interval (>20 ms) was detected with daily dosing of fedratinib 500 mg (1.25 times the recommended dose) for 14 days.
12.3. Pharmacokinetics
INREBIC at 300 mg to 500 mg once daily (0.75 to 1.25 times the recommended dose) results in a dose proportional increase in geometric mean fedratinib peak concentrations (Cmax) and the area under the plasma concentration time curve over the dosing interval (AUCtau). The mean steady state levels are achieved within 15 days of daily dosing. The mean accumulation ratio ranged between 3- to 4-fold.
At the dose of 400 mg once daily, the geometric mean (coefficient of variation, %CV) fedratinib Cmax is 1804 ng/mL (49%) and AUCtau is 26870 ng.hr/mL (43%) in patients with myelofibrosis.
Absorption
Following 400 mg once daily, fedratinib median time to peak concentrations (Tmax) at steady-state is 3 hours (range: 2 to 4 hours).
Effect of Food
A low-fat, low-calorie (total 162 calories: 6% from fat, 78% from carbohydrate and 16% from protein) or a high-fat, high-calorie (total 815 calories: 52% from fat, 33% from carbohydrate and 15% from protein) meal increased area under the curve over time to infinity (AUCinf) up to 24% and Cmax up to 14% of a single 500 mg dose of fedratinib.
Distribution
The apparent volume of distribution of fedratinib at steady-state is 1770 L in patients with myelofibrosis at 400 mg once daily dose. Fedratinib is 92% or greater bound to human plasma proteins.
Elimination
Fedratinib pharmacokinetics is characterized by a biphasic disposition with an effective half-life of 41 hours, a terminal half-life of approximately 114 hours, and apparent clearance (CL/F) (%CV) of 13 L/hr (51%) in patients with myelofibrosis.
Metabolism
Fedratinib is metabolized by CYP3A4, CYP2C19, and flavin-containing monooxygenase 3 (FMO3). Fedratinib accounts for approximately 80% of total circulating drug in plasma after oral administration.
Excretion
Following a single oral dose of radiolabeled fedratinib, 77% (23% unchanged) of the administered dose was excreted in feces and 5% (3% unchanged) was eliminated in urine.
Specific Populations
Age (20 years to 95 years), race (White, Asians), sex, body weight (40 kg to 135 kg), mild [total bilirubin ≤upper limit of normal (ULN) and AST >ULN or total bilirubin 1 to 1.5 times ULN and any AST] or moderate (total bilirubin >1.5 to 3 times ULN and any AST) hepatic impairment, and mild (CLcr 60 mL/min to 89 mL/min by C-G) renal impairment did not have clinically meaningful effects on the pharmacokinetics of fedratinib.
The effect of severe (total bilirubin >3 times ULN and any AST) hepatic impairment on fedratinib pharmacokinetics is unknown.
Patients with Renal Impairment
Following a single 300 mg dose of INREBIC, the AUCinf of fedratinib increased by 1.5-fold in subjects with moderate (CLcr 30 mL/min to 59 mL/min by C-G) renal impairment and 1.9-fold in subjects with severe (CLcr 15 mL/min to 29 mL/min by C-G) renal impairment, compared to that in subjects with normal renal function (CLcr ≥90 mL/min by C-G) [see Dosage and Administration (2.4) and Renal Impairment (8.6)].
Drug Interaction Studies
Clinical Studies and Model-Informed Approaches
Effect of Strong and Moderate CYP3A4 Inhibitors:
Coadministration of ketoconazole (strong CYP3A4 inhibitor: 200 mg twice daily) with a single dose of INREBIC (300 mg) increased fedratinib AUCinf by 3-fold [see Dosage and Administration (2.3) and Drug Interactions (7.1)].
Based on modeling and simulation, coadministration of a strong CYP3A4 inhibitor such as ketoconazole (400 mg once daily) with INREBIC 400 mg once daily is predicted to increase fedratinib AUC at steady state by 2-fold [see Dosage and Administration (2.3) and Drug Interactions (7.1)].
Based on modeling and simulation, coadministration of moderate CYP3A4 inhibitors, erythromycin (500 mg three times daily) or diltiazem (120 mg twice daily), with INREBIC 400 mg once daily is predicted to increase fedratinib AUC at steady state by 1.2-, and 1.1-fold, respectively.
Effect of Dual CYP3A4 and CYP2C19 Inhibitor:
The effect of concomitant administration with a dual CYP3A4 and CYP2C19 inhibitor on fedratinib pharmacokinetics is not known [see Drug Interactions (7.1)].
Effect of Strong and Moderate CYP3A4 Inducers:
The effect of concomitant administration with a strong or moderate CYP3A4 inducer on fedratinib pharmacokinetics is not known [see Drug Interactions (7.1)].
Effect of Gastric Acid Reducing Agents:
Coadministration of pantoprazole (proton pump inhibitor: 40 mg once daily) with a single dose of INREBIC (500 mg) increased fedratinib AUCinf by 1.2-fold.
Effect of Fedratinib on Drugs that are CYP3A, CYP2C19, or CYP2D6 Substrates:
Coadministration of a single dose of midazolam (CYP3A substrate: 2 mg), omeprazole (CYP2C19 substrate: 20 mg), and metoprolol (CYP2D6 substrate: 100 mg) increased midazolam, omeprazole, or metoprolol AUCinf by 4-, 3-, and 2-fold, respectively [see Drug Interactions (7.2)].
In Vitro Studies
Fedratinib as a Substrate for Transporters:
Fedratinib is a substrate of P-glycoprotein (P-gp) but not breast cancer resistance protein (BCRP), BSEP, multidrug resistance protein (MRP), MRP2, and organic anion transporting polypeptide (OATP)1B1 and OATP1B3.
Effect of Fedratinib on Transporter Substrates:
Fedratinib inhibits P-gp, BCRP, OATP1B1, OATP1B3, organic cation transporter (OCT)2, multidrug and toxin extrusion (MATE) protein 1, and MATE-2K, but not BSEP, MRP2, and organic anion transporter (OAT)1 and OAT3 in vitro.
13.1. Carcinogenesis, Mutagenesis, Impairment of Fertility
Fedratinib was not carcinogenic in the 6-month Tg.rasH2 transgenic mouse model.
Fedratinib was not mutagenic in a bacterial mutagenicity assay (Ames test) or clastogenic in in vitro chromosomal aberration assay (Chinese hamster ovary cells) or in vivo in a micronucleus test in rats.
In a fertility study in rats, fedratinib was administered for at least 70 days (males) and 14 days (females) prior to cohabitation and up to the implantation day (gestation day 7). Fedratinib had no effect on the estrous cycle parameters, mating performance, fertility, pregnancy rate or reproductive parameters in male or female rats at doses up to 30 mg/kg. The exposure (AUC) at the dose of 30 mg/kg/day is approximately 0.10 to 0.13 times the clinical exposure at the recommended daily dose.
13.2. Animal Toxicology and/or Pharmacology
The JAK/STAT pathway has been implicated in bone formation and metabolism, and its inhibition may cause bone abnormalities, e.g. in developing bone. There is currently no evidence of bone abnormalities in patients who received INREBIC.
14. Clinical Studies
JAKARTA
JAKARTA (NCT01437787) was a double-blind, randomized, placebo-controlled trial in patients with intermediate-2 or high-risk myelofibrosis, post-polycythemia vera myelofibrosis or post-essential thrombocythemia myelofibrosis with splenomegaly. A total of 289 patients were randomized to receive either INREBIC 500 mg (N=97), 400 mg (n=96) or placebo (n=96) once daily for at least 6 cycles. The median age was 65 years (range 27 to 86 years), 47% of patients were older than 65 years and 59% were male. Sixty-four percent (64%) of patients had primary MF, 26% had post-polycythemia vera MF, and 10% had post-essential thrombocythemia MF. Fifty-two percent (52%) of patients had intermediate-2 risk, and 48% had high-risk disease. The median baseline hemoglobin level was 10.2 g/dL. The median baseline platelet count was 214 × 109/L; 16% of patients had a platelet count <100 × 109/L and 84% of patients had a platelet count ≥100 × 109/L. Patients had a baseline median palpable spleen length of 15 cm. Patients had a baseline median spleen volume as measured by magnetic resonance imaging (MRI) or computed tomography (CT) of 2568 mL (range of 316 to 8244 mL) (the upper limit of normal is approximately 300 mL). Patients underwent MRI or CT spleen volume assessment (after the third and sixth cycle) with a follow-up scan 4 weeks after Cycle 6.
The efficacy of INREBIC in the treatment of patients with primary or secondary myelofibrosis was established based upon the proportion of patients achieving greater than or equal to a 35% reduction from baseline in spleen volume at the End of Cycle 6 as measured by MRI or CT with a follow-up scan 4 weeks later.
Efficacy analyses are presented in Table 5.
Table 5. Percent of Patients Achieving 35% or Greater Reduction from Baseline in Spleen Volume at the End of Cycle 6 in the Phase 3 Study, JAKARTA (ITT Population):
| Spleen Response by MRI/CT at the End of Cycle 6 with a Follow-up Scan 4 Weeks Later | INREBIC 400 mg N=96 n (%) | Placebo N=96 n (%) |
|---|---|---|
| Number (%) of Patients with Spleen Volume Reduction by 35% or More | 35 (37) | 1 (1) |
| p-value | p<0.0001 | |
Figure 1 shows the percent change in spleen volume from baseline for patients who have an evaluable MRI/CT at the End of Cycle 6.
Figure 1. Percent Change in Spleen Volume from Baseline at the End of Cycle 6 for Each Patient in the Phase 3 Study, JAKARTA:
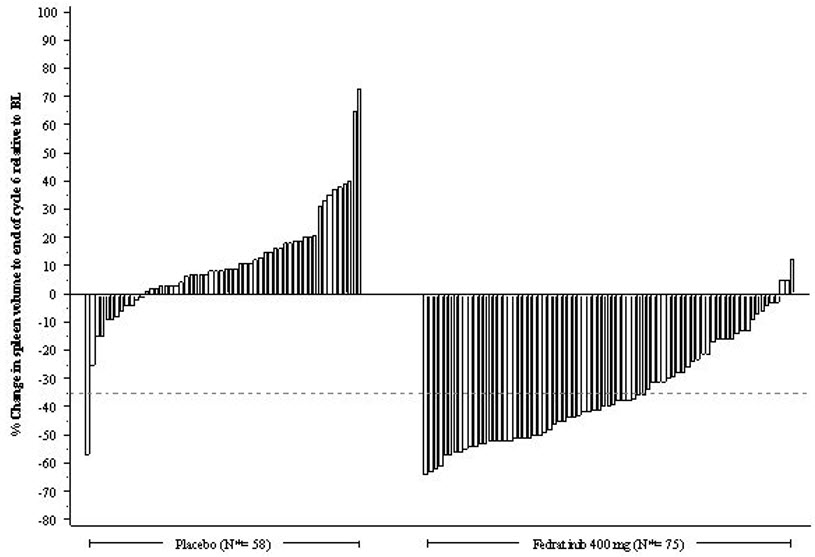
N*: Subjects with available percent change in spleen volume at EOC6.
Based on Kaplan-Meier estimates, the median duration of spleen response was 18.2 months for the INREBIC 400 mg group.
Additional outcomes included the proportion of patients with a 50% or greater reduction in Total Symptom Score from baseline to the End of Cycle 6 as measured by the modified Myelofibrosis Symptom Assessment Form (MFSAF) v2.0 diary.
The modified MFSAF v2.0 is a patient diary capturing the 6 core symptoms of MF: night sweats, itching, abdominal discomfort, early satiety, pain under ribs on left side, and bone or muscle pain. The modified MFSAF diary was completed daily during the week prior to Day 1 of each treatment cycle, and at the End of Cycle 6. Symptom scores ranged from 0 ("absent") to 10 ("worst imaginable"). These scores were added to create the Total Symptom Score, which has a maximum score of 60. At baseline, the mean Total Symptom Score was 17.95 in the 400 mg group and 15.45 in the placebo group.
The proportion of patients with a 50% or greater reduction in Total Symptom Score was 40% in the INREBIC 400 mg group and 9% in the placebo group (Table 6). Results are excluded for 22 patients: 6 patients with a baseline Total Symptom Score of zero (2 in the INREBIC 400 mg group and 4 in the placebo group) and 16 patients with missing baseline (5 in the INREBIC 400 mg group and 11 in the placebo group).
Table 6. Improvement in Total Symptom Score in Patients with Myelofibrosis in the Phase 3 Study, JAKARTA:
| INREBIC 400 mg (N=89) n (%) | Placebo (N=81) n (%) | |
|---|---|---|
| Number (%) of Patients with 50% or Greater Reduction in Total Symptom Score at the End of Cycle 6 | 36 (40) | 7 (9) |
| p-value | p<0.0001 | |
Figure 2 shows the percent change in Total Symptom Score from baseline at the End of Cycle 6 for each patient.
Figure 2. Percent Change from Baseline in Total Symptom Score at the End of Cycle 6 for Each Patient in the Phase 3 Study, JAKARTA:
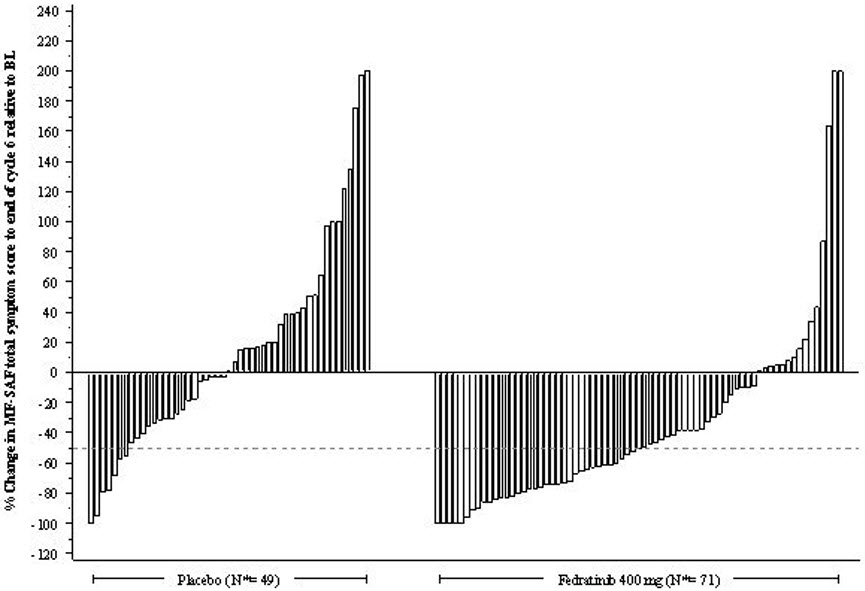
N*: Subjects with available percent change in Total Symptom Score at EOC6.
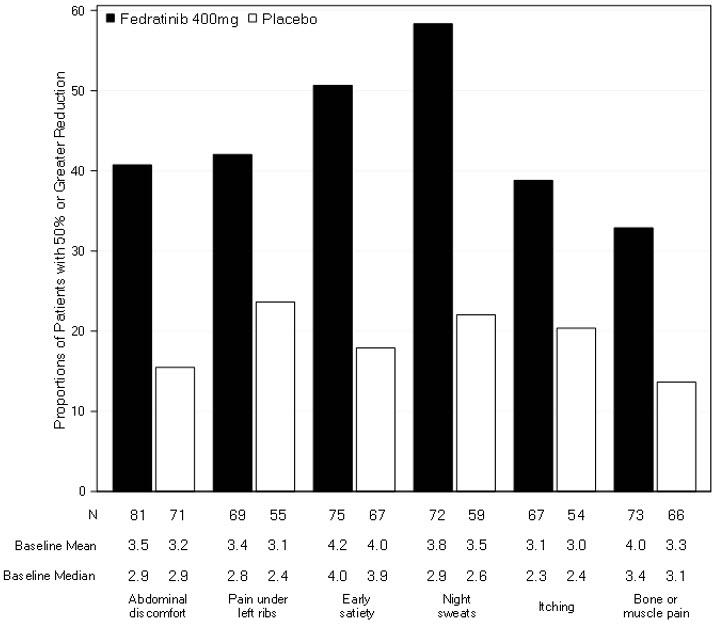
Figure 3 displays the proportion of patients with at least a 50% improvement in each of the individual symptoms that comprised the Total Symptom Score indicating that all 6 of the symptoms contributed to the higher Total Symptom Score response rate in the group treated with INREBIC.
Figure 3. Proportion of Patients Achieving 50% or Greater Reduction in Individual Symptom Scores at the End of Cycle 6 with Non-Zero Baseline Scores:
© All content on this website, including data entry, data processing, decision support tools, "RxReasoner" logo and graphics, is the intellectual property of RxReasoner and is protected by copyright laws. Unauthorized reproduction or distribution of any part of this content without explicit written permission from RxReasoner is strictly prohibited. Any third-party content used on this site is acknowledged and utilized under fair use principles.