ACTOS Tablet Ref.[10526] Active ingredients: Pioglitazone
Source: FDA, National Drug Code (US) Revision Year: 2019
12.1. Mechanism of Action
ACTOS is a thiazolidinedione that depends on the presence of insulin for its mechanism of action. ACTOS decreases insulin resistance in the periphery and in the liver resulting in increased insulin-dependent glucose disposal and decreased hepatic glucose output. Pioglitazone is not an insulin secretagogue. Pioglitazone is an agonist for peroxisome proliferator-activated receptor-gamma (PPARγ). PPAR receptors are found in tissues important for insulin action such as adipose tissue, skeletal muscle, and liver. Activation of PPARγ nuclear receptors modulates the transcription of a number of insulin responsive genes involved in the control of glucose and lipid metabolism.
In animal models of diabetes, pioglitazone reduces the hyperglycemia, hyperinsulinemia, and hypertriglyceridemia characteristic of insulin-resistant states such as type 2 diabetes. The metabolic changes produced by pioglitazone result in increased responsiveness of insulin-dependent tissues and are observed in numerous animal models of insulin resistance.
Because pioglitazone enhances the effects of circulating insulin (by decreasing insulin resistance), it does not lower blood glucose in animal models that lack endogenous insulin.
12.2. Pharmacodynamics
Clinical studies demonstrate that ACTOS improves insulin sensitivity in insulin-resistant patients. ACTOS enhances cellular responsiveness to insulin, increases insulin-dependent glucose disposal and improves hepatic sensitivity to insulin. In patients with type 2 diabetes, the decreased insulin resistance produced by ACTOS results in lower plasma glucose concentrations, lower plasma insulin concentrations, and lower HbA1c values. In controlled clinical trials, ACTOS had an additive effect on glycemic control when used in combination with a sulfonylurea, metformin, or insulin [see Clinical Studies (14.2)].
Patients with lipid abnormalities were included in clinical trials with ACTOS. Overall, patients treated with ACTOS had mean decreases in serum triglycerides, mean increases in HDL cholesterol, and no consistent mean changes in LDL and total cholesterol. There is no conclusive evidence of macrovascular benefit with ACTOS [see Warnings and Precautions (5.8) and Adverse Reactions (6.1)].
In a 26-week, placebo-controlled, dose-ranging monotherapy study, mean serum triglycerides decreased in the 15 mg, 30 mg, and 45 mg ACTOS dose groups compared to a mean increase in the placebo group. Mean HDL cholesterol increased to a greater extent in patients treated with ACTOS than in the placebo-treated patients. There were no consistent differences for LDL and total cholesterol in patients treated with ACTOS compared to placebo (see Table 14).
Table 14. Lipids in a 26-Week Placebo-Controlled Monotherapy Dose-Ranging Study:
| Placebo | ACTOS 15 mg Once Daily | ACTOS 30 mg Once Daily | ACTOS 45 mg Once Daily | |
|---|---|---|---|---|
| Triglycerides (mg/dL) | N=79 | N=79 | N=84 | N=77 |
| Baseline (mean) | 263 | 284 | 261 | 260 |
| Percent change from baseline (adjusted mean*) | 4.8% | -9.0%† | -9.6%† | -9.3%† |
| HDL Cholesterol (mg/dL) | N=79 | N=79 | N=83 | N=77 |
| Baseline (mean) | 42 | 40 | 41 | 41 |
| Percent change from baseline (adjusted mean*) | 8.1% | 14.1%† | 12.2% | 19.1%† |
| LDL Cholesterol (mg/dL) | N=65 | N=63 | N=74 | N=62 |
| Baseline (mean) | 139 | 132 | 136 | 127 |
| Percent change from baseline (adjusted mean*) | 4.8% | 7.2% | 5.2% | 6.0% |
| Total Cholesterol (mg/dL) | N=79 | N=79 | N=84 | N=77 |
| Baseline (mean) | 225 | 220 | 223 | 214 |
| Percent change from baseline (adjusted mean*) | 4.4% | 4.6% | 3.3% | 6.4% |
* Adjusted for baseline, pooled center, and pooled center by treatment interaction
† p<0.05 versus placebo
In the two other monotherapy studies (16 weeks and 24 weeks) and in combination therapy studies with sulfonylurea (16 weeks and 24 weeks), metformin (16 weeks and 24 weeks) or insulin (16 weeks and 24 weeks), the results were generally consistent with the data above.
12.3. Pharmacokinetics
Following once-daily administration of ACTOS, steady-state serum concentrations of both pioglitazone and its major active metabolites, M-III (keto derivative of pioglitazone) and M-IV (hydroxyl derivative of pioglitazone), are achieved within seven days. At steady-state, M-III and M-IV reach serum concentrations equal to or greater than that of pioglitazone. At steady-state, in both healthy volunteers and patients with type 2 diabetes, pioglitazone comprises approximately 30% to 50% of the peak total pioglitazone serum concentrations (pioglitazone plus active metabolites) and 20% to 25% of the total AUC.
Cmax, AUC, and trough serum concentrations (Cmin) for pioglitazone and M-III and M-IV, increased proportionally with administered doses of 15 mg and 30 mg per day.
Absorption
Following oral administration of pioglitazone, Tmax of pioglitazone was within two hours. Food delays the Tmax to three to four hours but does not alter the extent of absorption (AUC).
Distribution
The mean apparent volume of distribution (Vd/F) of pioglitazone following single-dose administration is 0.63 ± 0.41 (mean ± SD) L/kg of body weight. Pioglitazone is extensively protein bound (>99%) in human serum, principally to serum albumin. Pioglitazone also binds to other serum proteins, but with lower affinity. M-III and M-IV are also extensively bound (>98%) to serum albumin.
Metabolism
Pioglitazone is extensively metabolized by hydroxylation and oxidation; the metabolites also partly convert to glucuronide or sulfate conjugates. Metabolites M-III and M-IV are the major circulating active metabolites in humans.
In vitro data demonstrate that multiple CYP isoforms are involved in the metabolism of pioglitazone, which include CYP2C8 and, to a lesser degree, CYP3A4 with additional contributions from a variety of other isoforms including the mainly extrahepatic CYP1A1. In vivo study of pioglitazone in combination with gemfibrozil, a strong CYP2C8 inhibitor, showed that pioglitazone is a CYP2C8 substrate [see Dosage and Administration (2.3) and Drug Interactions (7)]. Urinary 6β-hydroxycortisol/cortisol ratios measured in patients treated with ACTOS showed that pioglitazone is not a strong CYP3A4 enzyme inducer.
Excretion and Elimination
Following oral administration, approximately 15% to 30% of the pioglitazone dose is recovered in the urine. Renal elimination of pioglitazone is negligible, and the drug is excreted primarily as metabolites and their conjugates. It is presumed that most of the oral dose is excreted into the bile either unchanged or as metabolites and eliminated in the feces.
The mean serum half-life (t1/2) of pioglitazone and its metabolites (M-III and M-IV) range from three to seven hours and 16 to 24 hours, respectively. Pioglitazone has an apparent clearance, CL/F, calculated to be five to seven L/hr.
Renal Impairment
The serum elimination half-life of pioglitazone, M-III, and M-IV remains unchanged in patients with moderate (creatinine clearance [CLcr] 30 to 50 mL/min) and severe (CLcr <30 mL/min) renal impairment when compared to subjects with normal renal function. Therefore, no dose adjustment in patients with renal impairment is required.
Hepatic Impairment
Compared with healthy controls, subjects with impaired hepatic function (Child-Turcotte-Pugh Grade B/C) have an approximate 45% reduction in pioglitazone and total pioglitazone (pioglitazone, M-III, and M-IV) mean Cmax but no change in the mean AUC values. Therefore, no dose adjustment in patients with hepatic impairment is required.
There are postmarketing reports of liver failure with ACTOS and clinical trials have generally excluded patients with serum ALT >2.5 times the upper limit of the reference range. Use caution in patients with liver disease [see Warnings and Precautions (5.3)].
Geriatric Patients
In healthy elderly subjects, Cmax of pioglitazone was not significantly different, but AUC values were approximately 21% higher than those achieved in younger subjects. The mean t1/2 of pioglitazone was also prolonged in elderly subjects (about ten hours) as compared to younger subjects (about seven hours). These changes were not of a magnitude that would be considered clinically relevant.
Pediatric Patients
Safety and efficacy of pioglitazone in pediatric patients have not been established. ACTOS is not recommended for use in pediatric patients [see Use in Specific Populations (8.4)].
Gender
The mean Cmax and AUC values of pioglitazone were increased 20% to 60% in women compared to men. In controlled clinical trials, HbA1c decreases from baseline were generally greater for females than for males (average mean difference in HbA1c 0.5%). Because therapy should be individualized for each patient to achieve glycemic control, no dose adjustment is recommended based on gender alone.
Ethnicity
Pharmacokinetic data among various ethnic groups are not available.
Drug-Drug Interactions
Table 15. Effect of Pioglitazone Coadministration on Systemic Exposure of Other Drugs:
| Coadministered Drug | |||||
|---|---|---|---|---|---|
| Pioglitazone Dosage Regimen (mg)* | Name and Dose Regimens | Change in AUC† | Change in Cmax† | ||
| 45 mg (N=12) | Warfarin‡ | ||||
| Daily loading then maintenance doses based PT and INR values Quick's Value = 35 ± 5% | R-Warfarin | ↓3% | R-Warfarin | ↓2% | |
| S-Warfarin | ↓1% | S-Warfarin | ↑1% | ||
| 45 mg (N=12) | Digoxin | ||||
| 0.200 mg twice daily (loading dose) then 0.250 mg daily (maintenance dose, 7 days) | ↑15% | ↑17% | |||
| 45 mg daily for 21 days (N=35) | Oral Contraceptive | ||||
| [Ethinyl Estradiol (EE) 0.035 mg plus Norethindrone (NE) 1 mg] for 21 days | EE | ↓11% | EE | ↓13% | |
| NE | ↑3% | NE | ↓7% | ||
| 45 mg (N=23) | Fexofenadine | ||||
| 60 mg twice daily for 7 days | ↑30% | ↑37% | |||
| 45 mg (N=14) | Glipizide | ||||
| 5 mg daily for 7 days | ↓3% | ↓8% | |||
| 45 mg daily for 8 days (N=16) | Metformin | ||||
| 1000 mg single dose on Day 8 | ↓3% | ↓5% | |||
| 45 mg (N=21) | Midazolam | ||||
| 7.5 mg single dose on Day 15 | ↓26% | ↓26% | |||
| 45 mg (N=24) | Ranitidine | ||||
| 150 mg twice daily for 7 days | ↑1% | ↓1% | |||
| 45 mg daily for 4 days (N=24) | Nifedipine ER | ||||
| 30 mg daily for 4 days | ↓13% | ↓17% | |||
| 45 mg (N=25) | Atorvastatin Ca | ||||
| 80 mg daily for 7 days | ↓14% | ↓23% | |||
| 45 mg (N=22) | Theophylline | ||||
| 400 mg twice daily for 7 days | ↑2% | ↑5% | |||
* Daily for 7 days unless otherwise noted
† % change (with/without coadministered drug and no change = 0% ); symbols of ↑ and ↓ indicate the exposure increase and decrease, respectively
‡ Pioglitazone had no clinically significant effect on prothrombin time
Table 16. Effect of Coadministered Drugs on Pioglitazone Systemic Exposure:
| Coadministered Drug and Dosage Regimen | Pioglitazone | ||
|---|---|---|---|
| Dose Regimen (mg)* | Change in AUC† | Change in Cmax† | |
| Gemfibrozil 600 mg twice daily for 2 days (N=12) | 15 mg single dose | ↑3.2-fold?footnote? | ↑6% |
| Ketoconazole 200 mg twice daily for 7 days (N=28) | 45 mg | ↑34% | ↑14% |
| Rifampin 600 mg daily for 5 days (N=10) | 30 mg single dose | ↓54% | ↓5% |
| Fexofenadine 60 mg twice daily for 7 days (N=23) | 45 mg | ↑1% | 0% |
| Ranitidine 150 mg twice daily for 4 days (N=23) | 45 mg | ↓13% | ↓16% |
| Nifedipine ER 30 mg daily for 7 days (N=23) | 45 mg | ↑5% | ↑4% |
| Atorvastatin Ca 80 mg daily for 7 days (N=24) | 45 mg | ↓24% | ↓31% |
| Theophylline 400 mg twice daily for 7 days (N=22) | 45 mg | ↓4% | ↓2% |
| Topiramate 96 mg twice daily for 7 days§ (N=26) | 30 mg§ | ↓15%¶ | 0% |
* Daily for 7 days unless otherwise noted
† Mean ratio (with/without coadministered drug and no change = 1-fold) % change (with/without coadministered drug and no change = 0% ); symbols of ↑ and ↓ indicate the exposure increase and decrease, respectively
‡ The half-life of pioglitazone increased from 8.3 hours to 22.7 hours in the presence of gemfibrozil [see Dosage and Administration (2.3) and Drug Interactions (7.1)]
§ Indicates duration of concomitant administration with highest twice-daily dose of topiramate from Day 14 onwards over the 22 days of study
¶ Additional decrease in active metabolites; 60% for M-III and 16% for M-IV
13.1. Carcinogenesis, Mutagenesis, Impairment of Fertility
A two-year carcinogenicity study was conducted in male and female rats at oral doses up to 63 mg/kg (approximately 14 times the maximum recommended human oral dose of 45 mg based on mg/m²). Drug-induced tumors were not observed in any organ except for the urinary bladder of male rats. Benign and/or malignant transitional cell neoplasms were observed in male rats at 4 mg/kg/day and above (approximately equal to the maximum recommended human oral dose based on mg/m²). Urinary calculi with subsequent irritation and hyperplasia were postulated as the mechanism for bladder tumors observed in male rats. A two-year mechanistic study in male rats utilizing dietary acidification to reduce calculi formation was completed in 2009. Dietary acidification decreased but did not abolish the hyperplastic changes in the bladder. The presence of calculi exacerbated the hyperplastic response to pioglitazone but was not considered the primary cause of the hyperplastic changes.
The relevance to humans of the bladder findings in the male rat cannot be excluded.
A two-year carcinogenicity study was also conducted in male and female mice at oral doses up to 100 mg/kg/day (approximately 11 times the maximum recommended human oral dose based on mg/m²). No drug-induced tumors were observed in any organ.
Pioglitazone hydrochloride was not mutagenic in a battery of genetic toxicology studies, including the Ames bacterial assay, a mammalian cell forward gene mutation assay (CHO/HPRT and AS52/XPRT), an in vitro cytogenetics assay using CHL cells, an unscheduled DNA synthesis assay, and an in vivo micronucleus assay.
No adverse effects upon fertility were observed in male and female rats at oral doses up to 40 mg/kg pioglitazone hydrochloride daily prior to and throughout mating and gestation (approximately nine times the maximum recommended human oral dose based on mg/m²).
13.2. Animal Toxicology and/or Pharmacology
Heart enlargement has been observed in mice (100 mg/kg), rats (4 mg/kg and above) and dogs (3 mg/kg) treated orally with pioglitazone hydrochloride (approximately 11, 1, and 2 times the maximum recommended human oral dose for mice, rats, and dogs, respectively, based on mg/m²). In a one-year rat study, drug-related early death due to apparent heart dysfunction occurred at an oral dose of 160 mg/kg/day (approximately 35 times the maximum recommended human oral dose based on mg/m²). Heart enlargement was seen in a 13-week study in monkeys at oral doses of 8.9 mg/kg and above (approximately four times the maximum recommended human oral dose based on mg/m²), but not in a 52-week study at oral doses up to 32 mg/kg (approximately 13 times the maximum recommended human oral dose based on mg/m²).
14. Clinical Studies
14.1 Monotherapy
Three randomized, double-blind, placebo-controlled trials with durations from 16 to 26 weeks were conducted to evaluate the use of ACTOS as monotherapy in patients with type 2 diabetes. These trials examined ACTOS at doses up to 45 mg or placebo once daily in a total of 865 patients.
In a 26-week dose-ranging monotherapy trial, 408 patients with type 2 diabetes were randomized to receive 7.5 mg, 15 mg, 30 mg, or 45 mg of ACTOS, or placebo once daily. Therapy with any previous antidiabetic agent was discontinued eight weeks prior to the double-blind period. Treatment with 15 mg, 30 mg, and 45 mg of ACTOS produced statistically significant improvements in HbA1c and fasting plasma glucose (FPG) at endpoint compared to placebo (see Figure 1, Table 17).
Figure 1 shows the time course for changes in HbA1c in this 26-week study.
Figure 1. Mean Change from Baseline for HbA1c in a 26-Week Placebo-Controlled Dose-Ranging Study (Observed Values):
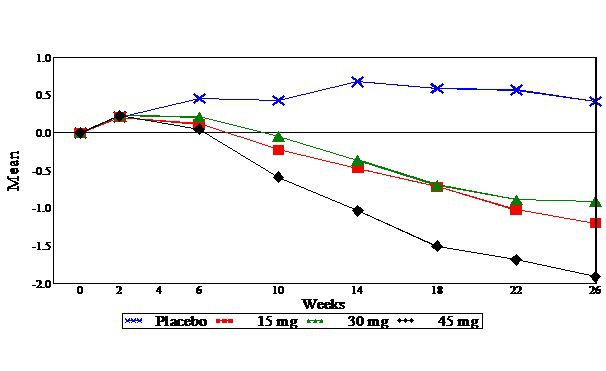
Table 17. Glycemic Parameters in a 26-Week Placebo-Controlled Dose-Ranging Monotherapy Trial:
| Placebo< | ACTOS 15 mg Once Daily | ACTOS 30 mg Once Daily | ACTOS 45 mg Once Daily | |
|---|---|---|---|---|
| Total Population | ||||
| HbA1c (%) | N=79 | N=79 | N=85 | N=76 |
| Baseline (mean) | 10.4 | 10.2 | 10.2 | 10.3 |
| Change from baseline (adjusted mean*) | 0.7 | -0.3 | -0.3 | -0.9 |
| Difference from placebo (adjusted mean*) 95% Confidence Interval | -1.0† (-1.6, -0.4) | -1.0† (-1.6, -0.4) | -1.6† (-2.2, -1.0) | |
| Fasting Plasma Glucose (mg/dL) | N=79 | N=79 | N=84 | N=77 |
| Baseline (mean) | 268 | 267 | 269 | 276 |
| Change from baseline (adjusted mean*) | 9 | -30 | -32 | -56 |
| Difference from placebo (adjusted mean*) 95% Confidence Interval | -39† (-63, -16) | -41† (-64, -18) | -65† (-89, -42) | |
* Adjusted for baseline, pooled center, and pooled center by treatment interaction
† p≤0.05 vs. placebo
In a 24-week placebo-controlled monotherapy trial, 260 patients with type 2 diabetes were randomized to one of two forced-titration ACTOS treatment groups or a mock-titration placebo group. Therapy with any previous antidiabetic agent was discontinued six weeks prior to the double-blind period. In one ACTOS treatment group, patients received an initial dose of 7.5 mg once daily. After four weeks, the dose was increased to 15 mg once daily and after another four weeks, the dose was increased to 30 mg once daily for the remainder of the trial (16 weeks). In the second ACTOS treatment group, patients received an initial dose of 15 mg once daily and were titrated to 30 mg once daily and 45 mg once daily in a similar manner. Treatment with ACTOS, as described, produced statistically significant improvements in HbA1c and FPG at endpoint compared to placebo (see Table 18).
Table 18. Glycemic Parameters in a 24-Week Placebo-Controlled Forced-Titration Monotherapy Trial:
| Placebo | ACTOS 30 mg* Once Daily | ACTOS 45 mg* Once Daily | |
|---|---|---|---|
| Total Population | |||
| HbA1c (%) | N=83 | N=85 | N=85 |
| Baseline (mean) | 10.8 | 10.3 | 10.8 |
| Change from baseline (adjusted mean†) | 0.9 | -0.6 | -0.6 |
| Difference from placebo (adjusted mean†) 95% Confidence Interval | -1.5‡ (-2.0, -1.0) | -1.5‡ (-2.0, -1.0) | |
| Fasting Plasma Glucose (mg/dL) | N=78 | N=82 | N=85 |
| Baseline (mean) | 279 | 268 | 281 |
| Change from baseline (adjusted mean†) | 18 | -44 | -50 |
| Difference from placebo (adjusted mean†) 95% Confidence Interval | -62‡ (-82, -0.41) | -68‡ (-88, -0.48) | |
* Final dose in forced titration
† Adjusted for baseline, pooled center, and pooled center by treatment interaction
‡ p≤0.05 vs. placebo
In a 16-week monotherapy trial, 197 patients with type 2 diabetes were randomized to treatment with 30 mg of ACTOS or placebo once daily. Therapy with any previous antidiabetic agent was discontinued six weeks prior to the double-blind period. Treatment with 30 mg of ACTOS produced statistically significant improvements in HbA1c and FPG at endpoint compared to placebo (see Table 19).
Table 19. Glycemic Parameters in a 16-Week Placebo-Controlled Monotherapy Trial:
| Placebo | ACTOS 30 mg Once Daily | |
|---|---|---|
| Total Population | ||
| HbA1c (%) | N=93 | N=100 |
| Baseline (mean) | 10.3 | 10.5 |
| Change from baseline (adjusted mean*) | 0.8 | -0.6 |
| Difference from placebo (adjusted mean*) 95% Confidence Interval | -1.4† (-1.8, -0.9) | |
| Fasting Plasma Glucose (mg/dL) | N=91 | N=99 |
| Baseline (mean) | 270 | 273 |
| Change from baseline (adjusted mean*) | 8 | -50 |
| Difference from placebo (adjusted mean*) 95% Confidence Interval | -58† (-77, -38) | |
* Adjusted for baseline, pooled center, and pooled center by treatment interaction
† p≤0.050 vs. placebo
14.2 Combination Therapy
Three 16-week, randomized, double-blind, placebo-controlled clinical trials were conducted to evaluate the effects of ACTOS (15 mg and/or 30 mg) on glycemic control in patients with type 2 diabetes who were inadequately controlled (HbA1c ≥8%) despite current therapy with a sulfonylurea, metformin, or insulin. In addition, three 24-week randomized, double-blind clinical trials were conducted to evaluate the effects of ACTOS 30 mg vs. ACTOS 45 mg on glycemic control in patients with type 2 diabetes who were inadequately controlled (HbA1c ≥8%) despite current therapy with a sulfonylurea, metformin, or insulin. Previous diabetes treatment may have been monotherapy or combination therapy.
Add-on to Sulfonylurea Trials
Two clinical trials were conducted with ACTOS in combination with a sulfonylurea. Both studies included patients with type 2 diabetes on any dose of a sulfonylurea, either alone or in combination with another antidiabetic agent. All other antidiabetic agents were withdrawn at least three weeks prior to starting study treatment.
In the first study, 560 patients were randomized to receive 15 mg or 30 mg of ACTOS or placebo once daily for 16 weeks in addition to their current sulfonylurea regimen. Treatment with ACTOS as add-on to sulfonylurea produced statistically significant improvements in HbA1c and FPG at endpoint compared to placebo add-on to sulfonylurea (see Table 20).
Table 20. Glycemic Parameters in a 16-Week Placebo-Controlled, Add-on to Sulfonylurea Trial:
| Placebo + Sulfonylurea | ACTOS 15 mg + Sulfonylurea | ACTOS 30 mg + Sulfonylurea | |
|---|---|---|---|
| Total Population | |||
| HbA1c (%) | N=181 | N=176 | N=182 |
| Baseline (mean) | 9.9 | 10.0 | 9.9 |
| Change from baseline (adjusted mean*) | 0.1 | -0.8 | -1.2 |
| Difference from placebo +sulfonylurea (adjusted mean*) 95% Confidence Interval | -0.9† (-1.2, -0.6) | -1.3† (-1.6, -1.0) | |
| Fasting Plasma Glucose (mg/dL) | N=182 | N=179 | N=186 |
| Baseline (mean) | 236 | 247 | 239 |
| Change from baseline (adjusted mean*) | 6 | -34 | -52 |
| Difference from placebo + sulfonylurea (adjusted mean*) 95% Confidence Interval | -39† (-52, -27) | -58† (-70, -46) | |
* Adjusted for baseline, pooled center, and pooled center by treatment interaction
† p≤0.05 vs. placebo + sulfonylurea
In the second trial, 702 patients were randomized to receive 30 mg or 45 mg of ACTOS once daily for 24 weeks in addition to their current sulfonylurea regimen. The mean reduction from baseline at Week 24 in HbA1c was 1.6% for the 30 mg dose and 1.7% for the 45 mg dose (see Table 21). The mean reduction from baseline at Week 24 in FPG was 52 mg/dL for the 30 mg dose and 56 mg/dL for the 45 mg dose.
The therapeutic effect of ACTOS in combination with sulfonylurea was observed in patients regardless of the sulfonylurea dose.
Table 21. Glycemic Parameters in a 24-Week Add-on to Sulfonylurea Trial:
| ACTOS 30 mg + Sulfonylurea | ACTOS 45 mg + Sulfonylurea | |
|---|---|---|
| Total Population | ||
| HbA1c (%) | N=340 | N=332 |
| Baseline (mean) | 9.8 | 9.9 |
| Change from baseline (adjusted mean*) | -1.6 | -1.7 |
| Difference from 30 mg daily ACTOS + sulfonylurea (adjusted mean*) (95% CI) | -0.1 (-0.4, 0.1) | |
| Fasting Plasma Glucose (mg/dL) | N=338 | N=329 |
| Baseline (mean) | 214 | 217 |
| Change from baseline (adjusted mean*) | -52 | -56 |
| Difference from 30 mg daily ACTOS + sulfonylurea (adjusted mean*) (95% CI) | -5 (-12, 3) | |
95% CI = 95% confidence interval
* Adjusted for baseline, pooled center, and pooled center by treatment interaction
Add-on to Metformin Trials
Two clinical trials were conducted with ACTOS in combination with metformin. Both trials included patients with type 2 diabetes on any dose of metformin, either alone or in combination with another antidiabetic agent. All other antidiabetic agents were withdrawn at least three weeks prior to starting study treatment.
In the first trial, 328 patients were randomized to receive either 30 mg of ACTOS or placebo once daily for 16 weeks in addition to their current metformin regimen. Treatment with ACTOS as add-on to metformin produced statistically significant improvements in HbA1c and FPG at endpoint compared to placebo add-on to metformin (see Table 22).
Table 22. Glycemic Parameters in a 16-Week Placebo-Controlled, Add-on to Metformin Trial:
| Placebo + Metformin | ACTOS 30 mg + Metformin | |
|---|---|---|
| Total Population | ||
| HbA1c (%) | N=153 | N=161 |
| Baseline (mean) | 9.8 | 9.9 |
| Change from baseline (adjusted mean*) | 0.2 | -0.6 |
| Difference from placebo + metformin (adjusted mean*) 95% Confidence Interval | -0.8† (-1.2, -0.5) | |
| Fasting Plasma Glucose (mg/dL) | N=157 | N=165 |
| Baseline (mean) | 260 | 254 |
| Change from baseline (adjusted mean*) | -5 | -43 |
| Difference from placebo + metformin (adjusted mean*) 95% Confidence Interval | -38† (-49, -26) | |
* Adjusted for baseline, pooled center, and pooled center by treatment interaction
† p≤0.05 vs. placebo + metformin
In the second trial, 827 patients were randomized to receive either 30 mg or 45 mg of ACTOS once daily for 24 weeks in addition to their current metformin regimen. The mean reduction from baseline at Week 24 in HbA1c was 0.8% for the 30 mg dose and 1.0% for the 45 mg dose (see Table 23). The mean reduction from baseline at Week 24 in FPG was 38 mg/dL for the 30 mg dose and 51 mg/dL for the 45 mg dose.
Table 23. Glycemic Parameters in a 24-Week Add-on to Metformin Study:
| ACTOS 30 mg + Metformin | ACTOS 45 mg + Metformin | |
|---|---|---|
| Total Population | ||
| HbA1c (%) | N=400 | N=398 |
| Baseline (mean) | 9.9 | 9.8 |
| Change from baseline (adjusted mean*) | -0.8 | -1.0 |
| Difference from 30 mg daily ACTOS + Metformin (adjusted mean*) (95% CI) | -0.2 (-0.5, 0.1) | |
| Fasting Plasma Glucose (mg/dL) | N=398 | N=399 |
| Baseline (mean) | 233 | 232 |
| Change from baseline (adjusted mean*) | -38 | -51 |
| Difference from 30 mg daily ACTOS + Metformin (adjusted mean*) (95% CI) | -12† (-21, -4) | |
95% CI = 95% confidence interval
* Adjusted for baseline, pooled center, and pooled center by treatment interaction
† p ≤0.05 vs. 30 mg daily ACTOS + metformin
The therapeutic effect of ACTOS in combination with metformin was observed in patients regardless of the metformin dose.
Add-on to Insulin Trials
Two clinical trials were conducted with ACTOS in combination with insulin. Both trials included patients with type 2 diabetes on insulin, either alone or in combination with another antidiabetic agent. All other antidiabetic agents were withdrawn prior to starting study treatment. In the first trial, 566 patients were randomized to receive either 15 mg or 30 mg of ACTOS or placebo once daily for 16 weeks in addition to their insulin regimen. Treatment with ACTOS as add-on to insulin produced statistically significant improvements in HbA1c and FPG at endpoint compared to placebo add-on to insulin (see Table 24). The mean daily insulin dose at baseline in each treatment group was approximately 70 units. The majority of patients (75% overall, 86% treated with placebo, 77% treated with ACTOS 15 mg, and 61% treated with ACTOS 30 mg) had no change in their daily insulin dose from baseline to the final study visit. The mean change from baseline in daily dose of insulin (including patients with no insulin dose modifications) was -3 units in the patients treated with ACTOS 15 mg, -8 units in the patients treated with ACTOS 30 mg, and -1 unit in patients treated with placebo.
Table 24. Glycemic Parameters in a 16-Week Placebo-Controlled, Add-on to Insulin Trial:
| Placebo + Insulin | ACTOS 15 mg + Insulin | ACTOS 30 mg + Insulin | |
|---|---|---|---|
| Total Population | |||
| HbA1c (%) | N=177 | N=177 | N=185 |
| Baseline (mean) | 9.8 | 9.8 | 9.8 |
| Change from baseline (adjusted mean*) | -0.3 | -1.0 | -1.3 |
| Difference from placebo + Insulin (adjusted mean*) 95% Confidence Interval | -0.7† (-1.0, -0.5) | -1.0† (-1.3, -0.7) | |
| Fasting Plasma Glucose (mg/dL) | N=179 | N=183 | N=184 |
| Baseline (mean) | 221 | 222 | 229 |
| Change from baseline (adjusted mean*) | 1 | -35 | -48 |
| Difference from placebo + Insulin (adjusted mean*) 95% Confidence Interval | -35† (-51, -19) | -49† (-65, -33) | |
* Adjusted for baseline, pooled center, and pooled center by treatment interaction
† p≤0.05 vs. placebo + insulin
In the second trial, 690 patients receiving a median of 60 units per day of insulin were randomized to receive either 30 mg or 45 mg of ACTOS once daily for 24 weeks in addition to their current insulin regimen. The mean reduction from baseline at Week 24 in HbA1c was 1.2% for the 30 mg dose and 1.5% for the 45 mg dose. The mean reduction from baseline at Week 24 in FPG was 32 mg/dL for the 30 mg dose and 46 mg/dL for the 45 mg dose (see Table 25). The mean daily insulin dose at baseline in both treatment groups was approximately 70 units. The majority of patients (55% overall, 58% treated with ACTOS 30 mg, and 52% treated with ACTOS 45 mg) had no change in their daily insulin dose from baseline to the final study visit. The mean change from baseline in daily dose of insulin (including patients with no insulin dose modifications) was -5 units in the patients treated with ACTOS 30 mg and -8 units in the patients treated with ACTOS 45 mg.
The therapeutic effect of ACTOS in combination with insulin was observed in patients regardless of the insulin dose.
Table 25. Glycemic Parameters in a 24-Week Add-on to Insulin Trial:
| ACTOS 30 mg + Insulin | ACTOS 45 mg + Insulin | |
|---|---|---|
| Total Population | ||
| HbA1c (%) | N=328 | N=328 |
| Baseline (mean) | 9.9 | 9.7 |
| Change from baseline (adjusted mean*) | -1.2 | -1.5 |
| Difference from 30 mg daily ACTOS + Insulin (adjusted mean*) (95% CI) | -0.3† (-0.5, -0.1) | |
| Fasting Plasma Glucose (mg/dL) | N=325 | N=327 |
| Baseline (mean) | 202 | 199 |
| Change from baseline (adjusted mean*) | -32 | -46 |
| Difference from 30 mg daily ACTOS + Insulin (adjusted mean*) (95% CI) | -14† (-25, -3) | |
95% CI = 95% confidence interval
* Adjusted for baseline, pooled center, and pooled center by treatment interaction
† p≤0.05 vs. 30 mg daily ACTOS + insulin
© All content on this website, including data entry, data processing, decision support tools, "RxReasoner" logo and graphics, is the intellectual property of RxReasoner and is protected by copyright laws. Unauthorized reproduction or distribution of any part of this content without explicit written permission from RxReasoner is strictly prohibited. Any third-party content used on this site is acknowledged and utilized under fair use principles.