BELVIQ / BELVIQ XR Film-coated tablet / Extended-release tablet Ref.[10124] Active ingredients: Lorcaserin
Source: FDA, National Drug Code (US) Revision Year: 2018
12.1. Mechanism of Action
Lorcaserin is believed to decrease food consumption and promote satiety by selectively activating 5-HT2C receptors on anorexigenic pro-opiomelanocortin neurons located in the hypothalamus. The exact mechanism of action is not known.
Lorcaserin at the recommended daily dose selectively interacts with 5-HT2C receptors as compared to 5-HT2A and 5-HT2B receptors (see Table 5), other 5-HT receptor subtypes, the 5-HT receptor transporter, and 5-HT reuptake sites.
Table 5. Lorcaserin Potency (EC50) and Binding Affinity (Ki) to Human 5-HT2A, 5-HT2B, and 5-HT2C Receptor Subtypes:
| Serotonin Receptor Subtype | E50, nM | Ki, nM |
|---|---|---|
| 5HT2C | 39 | 13 |
| 5HT2B | 2380 | 147 |
| 5HT2A | 553 | 92 |
12.2. Pharmacodynamics
Cardiac Electrophysiology
The effect of multiple oral doses of lorcaserin 15 mg and 40 mg once daily on QTc interval was evaluated in a randomized, placebo- and active- (moxifloxacin 400 mg) controlled four-treatment arm parallel thorough QT study in 244 healthy subjects. In a study with demonstrated ability to detect small effects, the upper bound of the one-sided 95% confidence interval for the largest placebo adjusted, baseline-corrected QTc based on individual correction method (QTcI) was below 10 ms, the threshold for regulatory concern.
12.3. Pharmacokinetics
Absorption
BELVIQ
Lorcaserin is absorbed from the gastrointestinal tract with peak plasma concentration occurring 1.5-2 hours after oral dosing. The absolute bioavailability of lorcaserin has not been determined. Steady state is reached within 3 days after twice daily dosing, and accumulation is estimated to be approximately 70%.
Effect of Food: Twelve adult volunteers (6 men and 6 women) were given a single 10 mg oral dose of BELVIQ in a fasted state and after administration of a high fat (approximately 50% of total caloric content of the meal) and high-calorie (approximately 800–1000 calories) meal. The Cmax increased approximately 9% and exposure (AUC) increased approximately 5% under fed conditions. Tmax was delayed approximately 1 hour in the fed state. BELVIQ can be administered with or without food.
BELVIQ XR
In an open label, randomized, crossover clinical trial, single dose and steady state pharmacokinetics of BELVIQ XR 20 mg administered once daily were compared with BELVIQ 10 mg tablet administered twice daily under fasted conditions in 34 healthy subjects. At steady state, the time to reach peak plasma concentrations of lorcaserin (tmax) following BELVIQ XR 20 mg once daily was approximately 10 hours compared with 1.5 hours for BELVIQ 10 mg tablet twice daily. A single dose administration of BELVIQ XR 20 mg resulted in comparable total plasma exposure (AUC0-∞), but approximately 25% lower peak exposures (Cmax) relative to two doses of BELVIQ tablets administered 12 hours apart. At steady state, however, both Cmax,ss and area under the plasma concentration versus time curve (AUC0-24,ss) of BELVIQ XR 20 mg administered once daily were bioequivalent to BELVIQ 10 mg tablets administered twice daily under fasted conditions.
Effect of Food: Intake of high fat, high calorie breakfast before a single 20 mg oral dose of BELVIQ XR resulted in approximately 46% increase in Cmax and 17% increase in AUC0-∞ but no change in tmax. At steady state, however, there was no significant food effect on the rate or extent of absorption of BELVIQ XR.
Distribution
Lorcaserin distributes to the cerebrospinal fluid and central nervous system in humans. Lorcaserin hydrochloride is moderately bound (~70%) to human plasma proteins.
Metabolism
Lorcaserin is extensively metabolized in the liver by multiple enzymatic pathways. After oral administration of lorcaserin the major circulating metabolite is lorcaserin sulfamate (M1), with a plasma Cmax that exceeds lorcaserin Cmax by 1- to 5-fold. N-carbamoyl glucuronide lorcaserin (M5) is the major metabolite in urine; M1 is a minor metabolite in urine, representing approximately 3% of dose. Other minor metabolites excreted in urine were identified as glucuronide or sulfate conjugates of oxidative metabolites. The principal metabolites exert no pharmacological activity at serotonin receptors.
Elimination
Lorcaserin is extensively metabolized by the liver and the metabolites are excreted in the urine. In a human mass balance study in which healthy subjects ingested radiolabeled lorcaserin, 94.5% of radiolabeled material was recovered, with 92.3% and 2.2% recovered from urine and feces, respectively. The terminal phase half-life for BELVIQ/BELVIQ XR is approximately 11 to 12 hours.
Specific Populations
Renal Impairment
The pharmacokinetics of lorcaserin was studied in patients with varying degrees of renal function. Creatinine clearance (CLcr) was calculated by Cockcroft-Gault equation based on ideal body weight (IBW). Impaired renal function decreased Cmax of lorcaserin, with no change in AUC.
Exposure of lorcaserin sulfamate metabolite (M1) was increased in patients with impaired renal function by approximately 1.7-fold in mild (CLcr = 50-80 mL/min), 2.3-fold in moderate (CLcr = 30-50 mL/min) and 10.5-fold in severe renal impairment (CLcr = <30 mL/min) compared to normal subjects (CLcr >80 mL/min).
Exposure of the N-carbamoyl-glucuronide metabolite (M5) was increased in patients with impaired renal function by approximately 1.5-fold in mild (CLcr = 50-80 mL/min), 2.5-fold in moderate (CLcr = 30-50 mL/min) and 5.1-fold in severe renal impairment (CLcr = <30 mL/min) compared to normal subjects (CLcr >80 mL/min).
The terminal half-life of M1 is prolonged by 26%, 96%, and 508% in mild, moderate, and severe renal impairment, respectively. The terminal half-life of M5 is prolonged by 0%, 26%, and 22% in mild, moderate, and severe renal impairment, respectively. The metabolites M1 and M5 accumulate in patients with severely impaired renal function.
Approximately 18% of metabolite M5 in the body was cleared from the body during a standard 4-hour hemodialysis procedure. Lorcaserin and M1 were not cleared by hemodialysis. Lorcaserin is not recommended for patients with severe renal impairment (CLcr <30 mL/min) or patients with end stage renal disease [see Use in Specific Populations (8.6)].
Estimate Ideal Body Weight (IBW) in (kg):
Males: IBW = 50 kg + 2.3 kg for each inch over 5 feet.
Females: IBW = 45.5 kg + 2.3 kg for each inch over 5 feet.
The Cockcroft-Gault calculation using the IBW:
female:
GFR (mL/min) = = 0.85 x (140-age) x ideal body weight (kg) / 72 x serum creatinine (mg/dL)
male:
GFR (mL/min) = (140-age) x ideal body weight (kg) / 72 x serum creatinine (mg/dL)
Hepatic Impairment
The pharmacokinetics of lorcaserin was evaluated in patients with hepatic impairment and subjects with normal hepatic function. Lorcaserin Cmax was 7.8% and 14.3% lower, in subjects with mild (Child-Pugh score 5-6) and moderate (Child-Pugh score 7-9) hepatic impairment, respectively, than that in subjects with normal hepatic function. The half-life of lorcaserin is prolonged by 59% to 19 hours in patients with moderate hepatic impairment. Lorcaserin exposure (AUC) is approximately 22% and 30% higher in patients with mild and moderate hepatic impairment, respectively. Dose adjustment is not required for patients with mild to moderate hepatic impairment. The effect of severe hepatic impairment on lorcaserin was not evaluated [see Use in Specific Populations (8.7)].
Gender
No dosage adjustment based on gender is necessary. Gender did not meaningfully affect the pharmacokinetics of lorcaserin.
Geriatric
No dosage adjustment is required based on age alone. In a clinical trial of 12 healthy elderly (age greater than 65 years) subjects and 12 matched adult patients, lorcaserin exposure (AUC and Cmax) was equivalent in the two groups. Cmax was approximately 18% lower in the elderly group, and Tmax was increased from 2 hours to 2.5 hours in the elderly group as compared to the non-elderly adult group.
Race
No dosage adjustment based on race is necessary. Race did not meaningfully affect the pharmacokinetics of lorcaserin.
Drug-Drug Interactions
Lorcaserin inhibits CYP 2D6-mediated metabolism. In a clinical trial in 21 CYP 2D6 extensive metabolizers, concomitant administration of lorcaserin (10 mg BID for 4 days) increased dextromethorphan peak concentrations (Cmax) by approximately 76% and exposure (AUC) by approximately 2-fold [see Drug Interactions (7.2)].
13.1. Carcinogensis, Mutagenesis, Impairment of Fertility
Mutagenesis
Lorcaserin was not mutagenic in an in vitro bacterial mutation assay (Ames test), was not clastogenic in an in vitro chromosome aberration assay in Chinese hamster ovary cells, and was not genotoxic in an in vivo micronucleus assay in rat bone marrow.
Carcinogenesis
The carcinogenic potential of lorcaserin was assessed in two-year carcinogenicity studies in mice and rats. CD-1 mice received doses of 5, 25 and 50 mg/kg. There were no treatment-related increases in the incidence of any tumor in mice at doses that produced plasma exposure in males and females of 8 and 4-times the daily human clinical dose, respectively.
In the rat carcinogenicity study, male and female Sprague-Dawley rats received 10, 30, and 100 mg/kg lorcaserin hydrochloride. In females, mammary adenocarcinoma increased at 100 mg/kg, which was associated with plasma exposures that were 87-times the daily human clinical dose. The incidence of mammary fibroadenoma was increased in female rats at all doses with no safety margin to the clinical dose. The increases in adenocarcinomas and fibroadenomas may be associated with lorcaserin-induced changes in prolactin homeostasis in rats. The relevance of the increased incidence of mammary adenocarcinomas and fibroadenomas in rats to humans is unknown.
In male rats, treatment-related neoplastic changes were observed in the subcutis (fibroma, Schwannoma), the skin (squamous cell carcinoma), mammary gland (adenocarcinoma and fibroadenoma), and the brain (astrocytoma) at greater than or equal to 30 mg/kg (plasma exposure 17-times human clinical dose). At higher exposure, liver adenoma and thyroid follicular cell adenoma were increased but were considered secondary to liver enzyme induction in rats and are not considered relevant to humans. Human brain exposure (AUC24h,ss) to lorcaserin at the clinical dose is estimated to be 70-fold lower than brain exposure in rats at the dose at which no increased incidence of astrocytoma was observed. Excluding the liver and thyroid tumors, these neoplastic findings in male rats are of unknown relevance to humans.
Impairment of Fertility
Potential effects on fertility were assessed in Sprague-Dawley rats in which males were dosed with lorcaserin hydrochloride for 4 weeks prior to and through the mating period, and females were dosed for 2 weeks prior to mating and through gestation day 7. Lorcaserin had no effects on fertility in rats at exposures up to 29 times the human clinical dose.
14. Clinical Studies
The safety and efficacy of BELVIQ for chronic weight management in conjunction with reduced caloric intake and increased physical activity were evaluated in 3 randomized, double-blind, placebo-controlled trials with durations ranging from 52 to 104 weeks. Two trials in adults without type 2 diabetes mellitus (Study 1 and Study 2) and one study in adults with type 2 diabetes mellitus (Study 3) evaluated the effect of BELVIQ. The primary efficacy parameter in these studies was weight loss at 1 year, which was assessed by percent of patients achieving greater than or equal to 5% weight loss, percent of patients achieving greater than or equal to 10% weight loss, and mean weight change. All patients received one-on-one instruction for a reduced-calorie diet and exercise counseling that began with the first dose of study medication and continued every four weeks throughout the trial.
Study 1 was a 2-year study that enrolled 3182 patients who were obese (BMI 30-45 kg/m²), or who were overweight (BMI 27-29.9 kg/m²) and had at least one weight-related comorbid condition such as hypertension or dyslipidemia. In Year 2, placebo patients were continued on placebo and BELVIQ, patients were re- randomized in a 2:1 ratio to continue BELVIQ or to switch to placebo. The mean age was 44 (range 18-65); 83.5% were women. Sixty-seven percent were Caucasian, 19% were African American and 12% were Hispanic. Mean baseline body weight was 100.0 kg and mean BMI was 36.2 kg/m².
Study 2 was a 1-year study that enrolled 4008 patients who were obese (BMI 30-45 kg/m²) or were overweight (BMI 27-29.9 kg/m²) with at least one comorbid condition such as hypertension or dyslipidemia. The mean age was 44 (range 18-65); 80% were women. Sixty-seven percent were Caucasian, 20% were African American and 11% were Hispanic. Mean baseline body weight was 100.2 kg and mean BMI was 35.9 kg/m².
Study 3 was a 1-year study that enrolled 604 adult patients with BMI greater than or equal to 27 kg/m² and inadequately controlled type 2 diabetes (HbA1c range 7-10%) being treated with metformin and/or a sulfonylurea. Mean age was 53 (range 21-65); 54% were women. Sixty-one percent were Caucasian, 21% African American and 14% were Hispanic. Mean BMI was 36 kg/m² and mean HbA1C was 8.1%.
A substantial percentage of randomized subjects withdrew from each study prior to week 52: 50% in Study 1, 45% in Study 2 and 36% in Study 3.
One-Year Weight Management in Patients without Diabetes Mellitus
Weight loss at 1 year in Studies 1 and 2 is presented in Table 6. The pooled data are reflective of the individual study results.
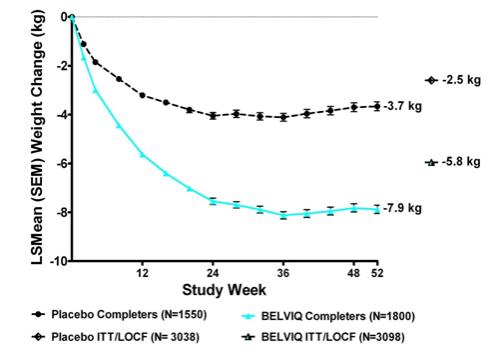
Statistically significantly greater weight loss was achieved with BELVIQ compared to placebo at week 52. The Year 1 placebo-adjusted weight loss achieved in patients treated with BELVIQ was 3.3 kg by ITT/LOCF analysis. The time course of weight loss with BELVIQ and placebo through week 52 is depicted in Figure 1.
Patients who did not lose at least 5% of baseline body weight by week 12 were unlikely to achieve at least 5% weight loss at week 52.
Table 6. Weight Loss at 1 Year in Studies 1 and 2 Combined:
| BELVIQ N=3098 | Placebo N=3038 | |
|---|---|---|
| Weight (kg) | ||
| Baseline mean (SD) | 100.4 (15.7) | 100.2 (15.9) |
| Change from baseline (adjusted mean1) (SE) | -5.8 (0.1) | -2.5 (0.1) |
| Difference from placebo (adjusted mean1) (95% CI) | -3.3** (-3.6, -2.9) | |
| Percent change from baseline (adjusted mean1) (SE) | -5.8 (0.1) | -2.5 (0.1) |
| Difference from placebo (adjusted mean1) (95% CI) | -3.3** (-3.6, -3.0) | |
| % of Patients losing greater than or equal to 5% body weight | 47.1 | 22.6 |
| Difference from placebo (95% CI) | 24.5** (22.2, 26.8) | |
| % of Patients losing greater than or equal to 10% body weigh | 22.4 | 8.7 |
| Difference from placebo (95% CI) | 13.8** (12.0, 15.5) |
SD = Standard Deviation; SE = Standard Error; CI = Confidence Interval
Intent to Treat Population using last observation carried forward method; All patients who received study medication and had a post-baseline body weight. Forty-four percent (44%) of patients in BELVIQ and 51% in placebo dropped out before the 52-week endpoint.
1Least squares means adjusted for baseline value, treatment, study and treatment by study interaction.
** p<0.001 compared to placebo. Type 1 error was controlled across the three endpoints.
Figure 1. Long itudinal Weight Change (kg) in Completer Population: Studies 1 and 2:
Two-Year Weight Management in Patients without Diabetes Mellitus
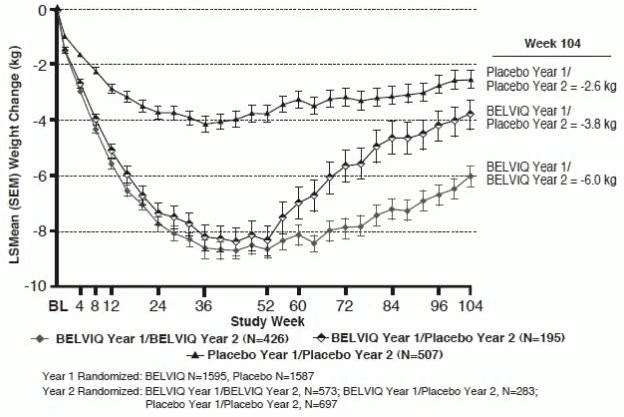
The safety and efficacy of BELVIQ for weight management during 2 years of treatment were evaluated in Study 1. Of the 3182 patients who were randomized in Year 1, 1553 (48.8%) were randomized in Year 2. Patients in all three Year 2 patient groups (BELVIQ Year 1/BELVIQ Year 2, BELVIQ Year 1/placebo Year 2, and placebo Year 1/placebo Year 2) regained weight in Year 2 but remained below their Year 1 mean baseline weight (Figure 2).
Figure 2. Body Weight Changes during Study 1 in the Completers Population:
Effect of BELVIQ on Cardiometabolic Parameters and Anthropometry
Changes in lipids, fasting glucose, fasting insulin, waist circumference, heart rate, and blood pressure with BELVIQ are shown in Table 7.
In a substudy of 154 patients conducted as part of Study 2, DEXA analysis showed a 9.9% reduction in fat mass from a baseline of 44.5 kg in patients treated with BELVIQ compared to a 4.6% reduction from a baseline of 45.0 kg in patients treated with placebo. The placebo-adjusted reduction in fat mass achieved on BELVIQ was 5.3%. Reductions in lean body mass were 1.9% and 0.3% from baseline values of 48.0 kg and 51.0 kg, respectively, for BELVIQ and placebo-treated patients.
Table 7. Mean Changes in Cardiometabolic Parameters and Waist Circumference in Year 1 of Studies 1 and 2:
| BELVIQ N=3096 | Placebo N=3039 | BELVIQ minus Placebo (LSMean) | |||
|---|---|---|---|---|---|
| Baseline mg/dL | % change from Baseline (LSMean1) | Baseline mg/dL | % change from Baseline (LSMean) | ||
| Total Cholesterol | 194.4 | -0.9 | 194.8 | 0.4 | -1.2* |
| LDL Cholesterol | 114.3 | 1.6 | 114.1 | 2.9 | -1.3* |
| HDL Cholesterol | 53.2 | 1.8 | 53.5 | 0.6 | 1.2* |
| Triglycerides | 135.4 | -5.3 | 137.0 | -0.5 | -4.8* |
| Baseline | change from Baseline (LSMean) | Baseline | change from Baseline (LSMean) | BELVIQ minus Placebo (LSMean) | |
| Systolic blood pressure (mmHg) | 121.4 | -1.8 | 121.5 | -1.0 | -0.7* |
| Diastolic blood pressure (mmHg) | 77.4 | -1.6 | 77.7 | -1.0 | -0.6* |
| Heart Rate (bpm) | 69.5 | -1.2 | 69.5 | -0.4 | -0.8 |
| Fasting glucose (mg/dL) | 92.1 | -0.2 | 92.4 | 0.6 | -0.8 |
| Fasting insulin2 (µIU/mL) | 15.9 | -3.3 | 15.8 | -1.3 | -2.1* |
| Waist Circumference (cm) | 109.3 | -6.5 | 109.6 | -4.0 | -2.5 |
1 Least squares means adjusted for baseline value, treatment, study and treatment by study interaction
2 Measured in Study 1 only (n=1538)
* Statistically significant versus placebo based on the pre-specified gatekeeping method for controlling Type I error in key secondary endpoints.
One-Year Weight Management in Patients with Type 2 Diabetes Mellitus
Weight loss among patients with type 2 diabetes mellitus who were treated with BELVIQ was statistically significantly greater than that among patients treated with placebo (Table 8).
Table 8. Weight Loss at 1 Year in Study 3 (Type 2 Diabetes Mellitus):
| BELVIQ N=251 | Placebo N=248 | |
|---|---|---|
| Weight loss (kg) Baseline mean (SD) Change from baseline (adjusted mean1) (SE) Difference from placebo (adjusted mean1) (95% CI) | 103.5 (17.2) -4.7 (0.4) -3.1** (-4.0, -2.2) | 102.3 (18.0) -1.6 (0.4) |
| Percent change from baseline (adjusted mean1) (SE) Difference from placebo (adjusted mean 1) (95% CI) | -4.5 (0.4) -3.1** (-3.9, -2.2) | -1.5 (0.4) |
| % of Patients losing greater than or equal to 5% body weight Difference from placebo (95% CI) | 37.5 21.3** (13.8, 28.9) | 16.1 |
| % of Patients losing greater than or equal to 10% body weight Difference from placebo (95% CI) | 16.3 11.9** (6.7, 17.1) | 4.4 |
SD = Standard Deviation; SE = Standard Error; CI = Confidence Interval
Intent to Treat Population using last observation carried forward method; All patients who received study medication and had a post-baseline body weight. Thirty-four percent (34%) of patients in Belviq and 38% in placebo dropped out before the 52-week endpoint.
1 Least squares means adjusted for baseline value, baseline HbA1c stratum and prior antihyperglycemic medication stratum.
** p<0.001 compared to placebo. Type 1 error was controlled across the three endpoints.
Effect of BELVIQ on Cardiometabolic Parameters and Anthropometry in Patients with Type 2
Diabetes Mellitus
Patients in Study 3 were taking either metformin and/or a sulfonylurea at study start, and had inadequate glycemic control (HbA1c range 7-10%). Changes in HbA1c and fasting glucose with BELVIQ use are shown in Table 9.
Table 9. Mean Changes in Cardiometabolic Parameters and Waist Circumference in Patients with Type 2 Diabetes Mellitus:
| BELVIQ N=256 | Placebo N=252 | BELVIQ minus Placeb (LSMean) | |||
|---|---|---|---|---|---|
| Baseline | Change from Baseline (LSMean1) | Baseline | Change from Baseline (LSMean) | ||
| HbA1C (%) | 8.1 | -0.9 | 8.0 | -0.4 | -0.5* |
| Fasting glucose (mg/dL) | 163.3 | -27.4 | 160.0 | -11.9 | -15.5* |
| Systolic blood pressure (mmHg) | 126.6 | -0.8 | 126.5 | -0.9 | 0.1 |
| Diastolic blood pressure (mmHg) | 77.9 | -1.1 | 78.7 | -0.7 | -0.4 |
| Heart Rate (bpm) | 72.3 | -2.0 | 72.7 | -0.4 | -1.6 |
| Waist Circumference (cm) | 115.8 | -5.5 | 113.5 | -3.3 | -2.2 |
| Baseline | % Change from Baseline (LSMean) | Baseline | Change from Baseline (LSMean) | BELVIQ minus Placebo (LSMean) | |
| Total Cholesterol (mg/dL) | 173.5 | -0.7 | 172.0 | -0.1 | -0.5 |
| LDL Cholesterol (mg/dL) | 95.0 | 4.2 | 94.6 | 5.0 | -0.8 |
| HDL Cholesterol (mg/dL) | 45.3 | 5.2 | 45.7 | 1.6 | 3.6 |
| Triglycerides (mg/dL) | 172.1 | -10.7 | 163.5 | -4.8 | -5.9 |
Intent to Treat Population using last observation carried forward method; All patients who received study medication and had a post-baseline measurement.
* Statistically significant versus placebo based on the pre-specified gatekeeping method for controlling Type I error in key secondary endpoints.
1 Least squares means adjusted for baseline value, baseline HbA1c stratum and prior antihyperglycemic medication stratum.
© All content on this website, including data entry, data processing, decision support tools, "RxReasoner" logo and graphics, is the intellectual property of RxReasoner and is protected by copyright laws. Unauthorized reproduction or distribution of any part of this content without explicit written permission from RxReasoner is strictly prohibited. Any third-party content used on this site is acknowledged and utilized under fair use principles.