CALQUENCE Hard capsule Ref.[51592] Active ingredients: Acalabrutinib
Source: European Medicines Agency (EU) Revision Year: 2025 Publisher: AstraZeneca AB, SE-151 85 Södertälje, Sweden
5.1. Pharmacodynamic properties
Pharmacotherapeutic group: Antineoplastic agents, protein kinase inhibitors
ATC code: L01EL02
Mechanism of action
Acalabrutinib is a selective inhibitor of Bruton tyrosine kinase (BTK). BTK is a signalling molecule of the B-cell antigen receptor (BCR) and cytokine receptor pathways. In B-cells, BTK signalling results in B-cell survival and proliferation, and is required for cellular adhesion, trafficking, and chemotaxis.
Acalabrutinib and its active metabolite, ACP-5862, form a covalent bond with a cysteine residue in the BTK active site, leading to irreversible inactivation of BTK with minimal off-target interactions.
Pharmacodynamic effects
In patients with B-cell malignancies dosed with acalabrutinib 100 mg twice daily, median steady-state BTK occupancy of ≥95% in peripheral blood was maintained over 12 hours, resulting in inactivation of BTK throughout the recommended dosing interval.
Cardiac electrophysiology
The effect of acalabrutinib on the QTc interval was evaluated in 46 healthy male and female subjects in a randomised, double-blind thorough QT study with placebo and positive controls. At a supratherapeutic dose, 4-times the maximum recommended dose, Calquence did not prolong the QT/QTc interval to any clinically relevant extent (e.g., not greater than or equal to 10 ms) (see sections 4.4, 4.8 and 5.3).
Clinical efficacy and safety
Patients with previously untreated CLL
Calquence monotherapy or in combination with obinutuzumab
The safety and efficacy of Calquence in previously untreated CLL were evaluated in a randomised, multi-centre, open-label Phase 3 study (ELEVATE-TN) of 535 patients. Patients received Calquence plus obinutuzumab, Calquence monotherapy, or obinutuzumab plus chlorambucil. Patients 65 years of age or older, or between 18 and 65 years of age with coexisting medical conditions, were included in ELEVATE-TN, 27.9% patients had a CrCl of <60 mL/min. Of the patients who were <65 years of age, 16.1% had a median CIRS-G score of 8. The study allowed patients to receive antithrombotic agents. Patients who required anticoagulation with warfarin or equivalent vitamin K antagonists were excluded.
Patients were randomised in a 1:1:1 ratio into 3 arms to receive:
- Calquence plus obinutuzumab (Calquence+G): Calquence 100 mg was administered twice daily starting on Cycle 1 Day 1 until disease progression or unacceptable toxicity. Obinutuzumab was administered starting on Cycle 2 Day 1 for a maximum of 6 treatment cycles. Obinutuzumab 1 000 mg was administered on Days 1 and 2 (100 mg on Day 1 and 900 mg on Day 2), 8 and 15 of Cycle 2 followed by 1,000 mg on Day 1 of Cycles 3 up to 7. Each cycle was 28 days.
- Calquence monotherapy: Calquence 100 mg was administered twice daily until disease progression or unacceptable toxicity.
- Obinutuzumab plus chlorambucil (GClb): Obinutuzumab and chlorambucil were administered for a maximum of 6 treatment cycles. Obinutuzumab 1,000 mg was administered on Days 1 and 2 (100 mg on Day 1 and 900 mg on Day 2), 8 and 15 of Cycle 1 followed by 1 000 mg on Day 1 of Cycles 2 up to 6. Chlorambucil 0.5 mg/kg was administered on Days 1 and 15 of Cycles 1 up to 6. Each cycle was 28 days.
Patients were stratified by 17p deletion mutation status (presence versus absence), ECOG performance status (0 or 1 versus 2) and geographic region (North America and Western Europe versus Other). After confirmed disease progression, 45 patients randomised on the GClb arm crossed over to Calquence monotherapy. Table 6 summarises the baseline demographics and disease characteristics of the study population.
Table 6. Baseline patient characteristics in (ELEVATE-TN) patients with previously untreated CLL:
| Characteristic | Calquence plus obinutuzumab N=179 | Calquence monotherapy N=179 | Obinutuzumab plus chlorambucil N=177 |
|---|---|---|---|
| Age, years; median (range) | 70 (41-88) | 70 (44-87) | 71 (46-91) |
| Male; % | 62 | 62 | 59.9 |
| Caucasian; % | 91.6 | 95 | 93.2 |
| ECOG performance status 0-1; % | 94.4 | 92.2 | 94.4 |
| Median time from diagnosis (months) | 30.5 | 24.4 | 30.7 |
| Bulky disease with nodes ≥5 cm; % | 25.7 | 38 | 31.1 |
| Cytogenetics/FISH Category; % | |||
| 17p deletion | 9.5 | 8.9 | 9 |
| 11q deletion | 17.3 | 17.3 | 18.6 |
| TP53 mutation | 11.7 | 10.6 | 11.9 |
| Unmutated IGHV | 57.5 | 66.5 | 65.5 |
| Complex karyotype (≥3 abnormalities) | 16.2 | 17.3 | 18.1 |
| Rai stage; % | |||
| 0 | 1.7 | 0 | 0.6 |
| I | 30.2 | 26.8 | 28.2 |
| II | 20.1 | 24.6 | 27.1 |
| III | 26.8 | 27.9 | 22.6 |
| IV | 21.2 | 20.7 | 21.5 |
The primary endpoint was progression-free survival (PFS) of Calquence+G arm versus GClb arm as assessed by an Independent Review Committee (IRC) per International Workshop on Chronic Lymphocytic Leukaemia (IWCLL) 2008 criteria with incorporation of the clarification for treatment-related lymphocytosis (Cheson 2012). With a median follow-up of 28.3 months, PFS by IRC indicated a 90% statistically significant reduction in the risk of disease progression or death for previously untreated CLL patients in the Calquence+G arm compared to the GClb arm. Efficacy results are presented in Table 7.
Table 7. Efficacy results per IRC Assessments in (ELEVATE-TN) patients with CLL:
| Calquence plus obinutuzumab N=179 | Calquence monotherapy N=179 | Obinutuzumab plus chlorambucil N=177 | |
|---|---|---|---|
| Progression-free survival* | |||
| Number of events (%) | 14 (7.8) | 26 (14.5) | 93 (52.5) |
| PD, n (%) | 9 (5) | 20 (11.2) | 82 (46.3) |
| Death events (%) | 5 (2.8) | 6 (3.4) | 11 (6.2) |
| Median (95% CI), months | NR | NR (34.2, NR) | 22.6 (20.2, 27.6) |
| HR† (95% CI) | 0.10 (0.06, 0.17) | 0.20 (0.13, 0.30) | - |
| P-value | <0.0001 | <0.0001 | - |
| 24 months estimate, % (95% CI) | 92.7 (87.4, 95.8) | 87.3 (80.9, 91.7) | 46.7 (38.5, 54.6) |
| Overall Survivala | |||
| Death events (%) | 9 (5) | 11 (6.1) | 17 (9.6) |
| Hazard Ratio (95% CI)† | 0.47 (0.21, 1.06) | 0.60 (0.28, 1.27) | - |
| Best overall response rate* (CR + CRi + nPR + PR) | |||
| ORR, n (%) (95% CI) | 168 (93.9) (89.3, 96.5) | 153 (85.5) (79.6, 89.9) | 139 (78.5) (71.9, 83.9) |
| P-value | <0.0001 | 0.0763 | - |
| CR, n (%) | 23 (12.8) | 1 (0.6) | 8 (4.5) |
| CRi, n (%) | 1 (0.6) | 0 | 0 |
| nPR, n (%) | 1 (0.6) | 2 (1.1) | 3 (1.7) |
| PR, n (%) | 143 (79.9) | 150 (83.8) | 128 (72.3) |
CI=confidence interval; HR=hazard ratio; NR=not reached; CR=complete response; CRi=complete response with incomplete blood count recovery; nPR=nodular partial response; PR=partial response.
* Per IRC assessment
† Based on stratified Cox-Proportional-Hazards model
a Median OS not reached for both arms.
PFS results for Calquence with or without obinutuzumab were consistent across subgroups, including high risk features. In the high risk CLL population (17p deletion, 11q deletion, TP53 mutation or unmutated IGHV), the PFS HRs of Calquence with or without obinutuzumab versus obinutuzumab plus chlorambucil was 0.08 [95% CI (0.04, 0.15)] and 0.13 [95% CI (0.08, 0.21)], respectively.
Table 8. Subgroup analysis of PFS (Study ELEVATE-TN):
| Calquence monotherapy | Calquence+G | |||||
|---|---|---|---|---|---|---|
| N | Hazard Ratio | 95% CI | N | Hazard Ratio | 95% CI | |
| All subjects | 179 | 0.20 | (0.13, 0.30) | 179 | 0.10 | (0.06, 0.17) |
| Del 17P | ||||||
| Yes No | 19 160 | 0.20 0.20 | 0.06, 0.64) (0.12, 0.31) | 21 158 | 0.13 0.09 | (0.04, 0.46) (0.05, 0.17) |
| TP53 mutation | ||||||
| Yes No | 19 160 | 0.15 0.20 | (0.05, 0.46) (0.12, 0.32) | 21 158 | 0.04 0.11 | (0.01, 0.22) (0.06, 0.20) |
| Del 17P or/and TP53 mutation | ||||||
| Yes No | 23 156 | 0.23 0.19 | (0.09, 0.61) (0.11, 0.31) | 25 154 | 0.10 0.10 | (0.03, 0.34) (0.05, 0.18) |
| IGHV mutation | ||||||
| Mutated Unmutated | 58 119 | 0.69 0.11 | (0.31, 1.56) (0.07, 0.19) | 74 103 | 0.15 0.08 | (0.04, 0.52) (0.04, 0.16) |
| Del 11q | ||||||
| Yes No | 31 148 | 0.07 0.26 | (0.02, 0.22) (0.16, 0.41) | 31 148 | 0.09 0.10 | (0.03, 0.26) (0.05, 0.20) |
| Complex Karyotype | ||||||
| Yes No | 31 117 | 0.10 0.27 | (0.03, 0.33) (0.16, 0.46) | 29 126 | 0.09 0.11 | (0.03, 0.29) (0.05, 0.21) |
With long term data, the median follow-up was 58.2 months for Calquence+G arm, 58.1 months for Calquence arm and 58.2 months for the GClb arm. The median investigator assessed PFS for Calquence+G and Calquence monotherapy was not reached; and was 27.8 months in GClb arm. At the time of most recent data cut off, a total of 72 patients (40.7%) originally randomised to the GClb arm crossed over to Calquence monotherapy. The median overall survival had not been reached in any arm with a total of 76 deaths: 18 (10.1%) in the Calquence+G arm, 30 (16.8%) in the Calquence monotherapy arm, and 28 (15.8%) in the GClb arm.
Table 9. Efficacy Results per INV assessment in (ELEVATE-TN) Patients with CLL:
| Calquence plus obinutuzumab N=179 | Calquence monotherapy N=179 | Obinutuzumab plus Chlorambucil N=177 | |
|---|---|---|---|
| Progression-free survival | |||
| Number of events (%) | 27 (15.1) | 50 (27.9) | 124 (70.1) |
| PD, n (%) | 14 (7.8) | 30 (16.8) | 112 (63.3) |
| Death events (%) | 13 (7.3) | 20 (11.2) | 12 (6.8) |
| Median (95% CI), months* | NR | NR (66.5, NR) | 27.8 (22.6, 33.2) |
| HR† (95% CI) | 0.11 (0.07, 0.16) | 0.21 (0.15, 0.30) | - |
| Overall survival | |||
| Death events (%) | 18 (10.1) | 30 (16.8) | 28 (15.8) |
| Hazard Ratio (95% CI)† | 0.55 (0.30, 0.99) | 0.98 (0.58, 1.64) | - |
CI=confidence interval; HR=hazard ratio; NR=not reached
* 95% confidence interval based on Kaplan-Meier estimation.
† Estimate based on stratified Cox-Proportional-Hazards model for Hazard Ratio (95% CI) stratified by 17p deletion status (yes vs no)
Figure 1. Kaplan-Meier Curve of INV-Assessed PFS in (ELEVATE-TN) Patients with CLL (ITT Population):
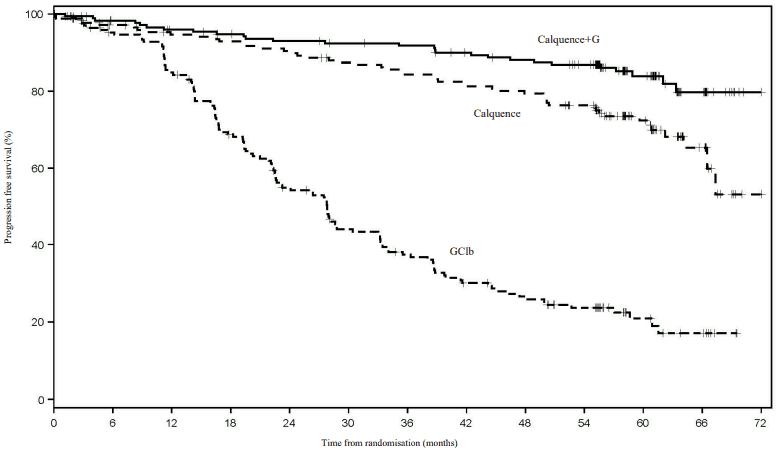
| Month | 0 | 3 | 6 | 9 | 12 | 15 | 18 | 21 | 24 | 27 | 30 | 33 | 36 | 39 | 42 | 45 | 48 | 51 | 54 | 57 | 60 | 63 | 66 | 69 | 70 |
| Calquence | 179 | 167 | 163 | 158 | 156 | 155 | 153 | 150 | 149 | 146 | 142 | 141 | 137 | 135 | 133 | 130 | 129 | 124 | 120 | 93 | 63 | 39 | 22 | 6 | 1 |
| Calquence+G | 179 | 175 | 170 | 168 | 164 | 163 | 160 | 157 | 156 | 156 | 153 | 152 | 151 | 146 | 144 | 141 | 140 | 138 | 133 | 99 | 65 | 39 | 27 | 7 | 1 |
| GClb | 177 | 163 | 156 | 153 | 139 | 125 | 110 | 100 | 86 | 82 | 67 | 66 | 56 | 49 | 44 | 40 | 38 | 31 | 30 | 20 | 13 | 8 | 7 | 2 | 0 |
Patients with previously untreated CLL – Fixed duration therapy
Calquence in combination with venetoclax with or without obinutuzumab
The safety and efficacy of Calquence in combination with venetoclax with or without obinutuzumab in previously untreated CLL was evaluated in a randomised, multi-centre, open-label Phase 3 study (AMPLIFY) of 867 patients. Patients received Calquence plus venetoclax, Calquence plus venetoclax and obinutuzumab, or Investigator's choice of chemoimmunotherapy, either FCR (fludarabine plus cyclophosphamide plus rituximab) or BR (bendamustine plus rituximab). AMPLIFY included patients previously untreated for CLL without del(17p) or TP53 mutation that were 18 years of age and older. The trial allowed patients to receive antithrombotic agents except warfarin and other vitamin K antagonists.
Patients were randomised in a 1:1:1 ratio into 3 arms to receive:
- Calquence plus venetoclax (AV): Calquence 100 mg was administered twice daily starting on Cycle 1 Day 1 for a total of 14 cycles or until disease progression or unacceptable toxicity. On Cycle 3 Day 1 patients started the venetoclax 5-week dose-titration schedule, starting at 20 mg and increasing weekly to 50 mg, 100 mg, 200 mg and finally 400 mg once daily. Venetoclax was administered for a total of 12 cycles. Each cycle was 28 days.
- Calquence plus venetoclax plus obinutuzumab (AVO): Calquence 100 mg was administered twice daily starting on Cycle 1 Day 1 for a total of 14 cycles or until disease progression or unacceptable toxicity. On Cycle 3 Day 1 patients started the venetoclax 5-week dose-titration schedule, starting at 20 mg and increasing weekly to 50 mg, 100 mg, 200 mg and finally 400 mg once daily. Venetoclax was administered for a total of 12 cycles. Obinutuzumab 1 000 mg was administered on Day 1 or Day 1 and 2 (100 mg on Day 1 and 900 mg on Day 1 or 2), 8 and 15 of Cycle 2 followed by 1 000 mg on Day 1 of Cycles 3-7. Each cycle was 28 days.
- Investigator's choice of chemoimmunotherapy (FCR/BR):
- Fludarabine plus cyclophosphamyde plus rituximab (FCR): Fludarabine (25 mg/m²) and cyclophosphamide (250 mg/m²) were administered on Days 1-3 up to a maximum of 6 cycles. Rituximab was administered at a dose of 375 mg/m² on Day 1 Cycle 1 and 500 mg/m² on Day 1 of Cycles 2 up to 6. Each cycle was 28 days.
- Bendamustine plus rituximab (BR): Bendamustine 90 mg/m² was administered on Days 1 and 2 up to maximum of 6 cycles. Rituximab was administered at a dose of 375 mg/m² on Day 1 Cycle 1 and 500 mg/m² on Day 1 of Cycles 2 up to 6. Each cycle was 28 days.
Patients were stratified by age (>65 years or ≤65 years), IGHV mutational status (mutated versus unmutated), Rai stage (high risk [≥3] versus non-high risk) and geographic region (North America and Western Europe versus other). Table 10 summarises the baseline demographics and disease characteristics of the study population.
Table 10. Baseline Patient Characteristics in (AMPLIFY) Patients with Previously Untreated CLL:
| Characteristic | AV N=291 | AVO N=286 | FCR/BR N=290 |
|---|---|---|---|
| Age, years; median (range) | 61 (31-84) | 61 (29-81) | 61 (26-86) |
| Male; % | 61.2 | 69.2 | 63.1 |
| Caucasian; % | 91.1 | 86.7 | 86.9 |
| ECOG performance status 0-1; % | 90.0 | 95.1 | 90.3 |
| Median time from diagnosis to randomization (months) | 28.5 | 26.1 | 29.6 |
| Bulky disease with nodes ≥5 cm; % | 38.8 | 35.0 | 42.8 |
| Cytogenetics/FISH Category; % | |||
| 11q deletion | 17.5 | 19.6 | 15.9 |
| Complex karyotype (≥3 abnormalities) | 15.5 | 16.1 | 14.5 |
| Unmutated IGHV; % | 57.4 | 59.1 | 59.3 |
| Rai stage; % | |||
| 0 | 1.0 | 0.3 | 1.4 |
| I | 16.2 | 21.3 | 21.4 |
| II | 35.7 | 37.8 | 33.4 |
| III | 23.7 | 17.8 | 20.3 |
| IV | 23.4 | 22.7 | 23.4 |
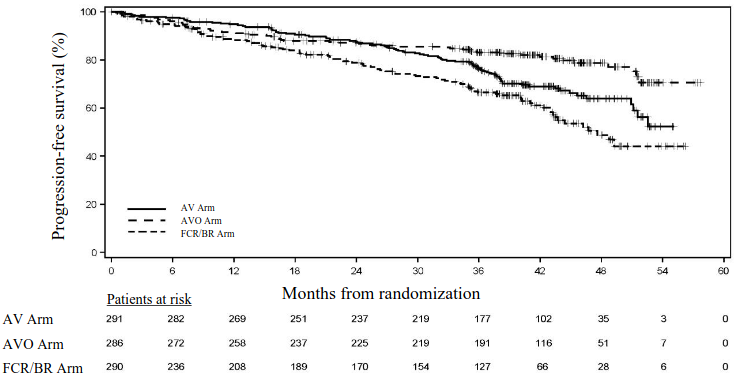
The primary endpoint was IRC-assessed PFS for AV versus Investigator's choice of chemoimmunotherapy (FCR/BR) arm as assessed by IWCLL 2018 criteria. Additional efficacy endpoints were IRC-assessed PFS of AVO versus Investigator's choice (FCR/BR) arm and OS in both AV arm vs. Investigator's choice (FCR/BR) arm and AVO vs. Investigator's choice (FCR/BR) arm.
Efficacy results are presented in Table 11. The Kaplan-Meier curve for IRC-PFS is shown in Figure 2.
Table 11. Efficacy results in (AMPLIFY) patients with previously untreated CLL:
| AV N=291 | AVO N=286 | FCR/BRa N=290 | |
|---|---|---|---|
| Progression-free survival* | |||
| Number of events (%) | 89 (30.6) | 56 (19.6) | 95 (32.8) |
| PD, n (%) | 77 (26.5) | 23 (8.0) | 66 (22.8) |
| Death events (%) | 12 (4.1) | 33 (11.5) | 29 (10.0) |
| Median (95% CI), months | NC (51.1, NC) | NC (NC, NC) | 47.6 (43.3, NC) |
| HR† (95% CI) | 0.65 (0.49, 0.87) | 0.42 (0.30, 0.59) | - |
| P-value | 0.0038 | ˂0.0001 | - |
| Overall Survivalb | |||
| Death events (%) | 23 (7.9) | 37 (12.9) | 44 (15.2) |
| HR† (95% CI) | 0.42 (0.25, 0.70)c | 0.75 (0.48, 1.16) | - |
NC = Not calculable.
* Per IRC assessment.
† Based on stratified Cox-Proportional-Hazards model.
a Per Investigator's choice 143 patients were planned to receive FCR and 147 patients were planned to receive BR.
b OS data at additional 6 months follow-up from PFS interim analysis.
c The p-value is not significant after adjusting for multiplicity.
Figure 2. Kaplan-Meier Curve of IRC-Assessed PFS in (AMPLIFY) patients with CLL (ITT Population):
Patients with CLL who received at least one prior therapy
The safety and efficacy of Calquence in relapsed or refractory CLL were evaluated in a randomised, multi-centre, open-label phase 3 study (ASCEND) of 310 patients who received at least one prior therapy not including BCL-2 inhibitors or B-cell receptor inhibitors. Patients received Calquence monotherapy or investigator's choice of either idelalisib plus rituximab or bendamustine plus rituximab. The study allowed patients to receive antithrombotic agents. Patients who required anticoagulation with warfarin or equivalent vitamin K antagonists were excluded.
Patients were randomised 1:1 to receive either:
- Calquence 100 mg twice daily until disease progression or unacceptable toxicity, or
- Investigator's choice:
- Idelalisib 150 mg twice daily in combination with rituximab 375 mg/m² IV on Day 1 of the first cycle, followed by 500 mg/m² IV every 2 weeks for 4 doses, then every 4 weeks for 3 doses for a total of 8 infusions
- Bendamustine 70 mg/m² (Day 1 and 2 of each 28-day cycle) in combination with rituximab (375 mg/m²/500 mg/m²) on Day 1 of each 28-day cycle for up to 6 cycles
Patients were stratified by 17p deletion mutation status (presence versus absence), ECOG performance status (0 or 1 versus 2) and number of prior therapies (1 to 3 versus ≥4). After confirmed disease progression, 35 patients randomised on investigator's choice of either idelalisib plus rituximab or bendamustine plus rituximab crossed over to Calquence. Table 12 summarizes the baseline demographics and disease characteristics of the study population.
Table 12. Baseline patient characteristics in (ASCEND) patients with CLL:
| Characteristic | Calquence monotherapy N=155 | Investigator's choice of idelalisib + rituximab or bendamustine + rituximab N=155 |
|---|---|---|
| Age, years; median (range) | 68 (32-89) | 67 (34-90) |
| Male; % | 69.7 | 64.5 |
| Caucasian; % | 93.5 | 91.0 |
| ECOG performance status; % | ||
| 0 | 37.4 | 35.5 |
| 1 | 50.3 | 51.0 |
| 2 | 12.3 | 13.5 |
| Median time from diagnosis (months) | 85.3 | 79.0 |
| Bulky disease with nodes ≥5 cm; % | 49.0 | 48.4 |
| Median number of prior CLL therapies (range) | 1 (1-8) | 2 (1-10) |
| Number of Prior CLL Therapies; % | ||
| 1 | 52.9 | 43.2 |
| 2 | 25.8 | 29.7 |
| 3 | 11.0 | 15.5 |
| ≥4 | 10.3 | 11.6 |
| Cytogenetics/FISH Category; % | ||
| 17p deletion | 18.1 | 13.5 |
| 11q deletion | 25.2 | 28.4 |
| TP53 mutation | 25.2 | 21.9 |
| Unmutated IGHV | 76.1 | 80.6 |
| Complex karyotype (≥3 abnormalities) | 32.3 | 29.7 |
| Rai Stage; % | ||
| 0 | 1.3 | 2.6 |
| I | 25.2 | 20.6 |
| II | 31.6 | 34.8 |
| III | 13.5 | 11.6 |
| IV | 28.4 | 29.7 |
The primary endpoint was PFS as assessed by IRC IWCLL 2008 criteria with incorporation of the clarification for treatment-related lymphocytosis (Cheson 2012). With a median follow-up of 16.1 months, PFS indicated a 69% statistically significant reduction in the risk of death or progression for patients in the Calquence arm. Efficacy results are presented in Table 13. The Kaplan-Meier curve for PFS is shown in Figure 3.
Table 13. Efficacy results per IRC Assessments in (ASCEND) patients with CLL:
| Calquence monotherapy N=155 | Investigator's choice of idelalisib + rituximab or bendamustine + rituximab N=155 | |
|---|---|---|
| Progression-free survival* | ||
| Number of events (%) | 27 (17.4) | 68 (43.9) |
| PD, n (%) | 19 (12.3) | 59 (38.1) |
| Death events (%) | 8 (5.2) | 9 (5.8) |
| Median (95% CI), months | NR | 16.5 (14.0, 17.1) |
| HR† (95% CI) | 0.31 (0.20, 0.49) | |
| P-value | <0.0001 | |
| 15 months estimate, % (95% CI) | 82.6 (75.0, 88.1) | 54.9 (45.4, 63.5) |
| Overall survivala | ||
| Death events (%) | 15 (9.7) | 18 (11.6) |
| Hazard Ratio (95% CI)† | 0.84 (0.42, 1.66) | - |
| Best overall response rate* (CR + CRi + nPR + PR)** | ||
| ORR, n (%) (95% CI) | 126 (81.3) (74.4, 86.6) | 117 (75.5) (68.1, 81.6) |
| P-value | 0.2248 | - |
| CR, n (%) | 0 | 2 (1.3) |
| PR, n (%) | 126 (81.3) | 115 (74.2) |
| Duration of Response (DoR) | ||
| Median (95% CI), months | NR | 13.6 (11.9, NR) |
CI=confidence interval; HR=hazard ratio; NR=not reached; CR=complete response; CRi=complete response with incomplete blood count recovery; nPR=nodular partial response; PR=partial response; PD=progressive disease
* Per IRC assessment
a Median OS not reached for both arms. P<0.6089 for OS.
** CRi and nPR have values of 0.
^† Based on stratified Cox-Proportional-Hazards model
Figure 3. Kaplan-Meier curve of IRC-assessed PFS in (ASCEND) patients with CLL (ITT Population):

| Number of patients at risk | ||||||||||||||||||||||||
| Month | 0 | 1 | 2 | 3 | 4 | 5 | 6 | 7 | 8 | 9 | 10 | 11 | 12 | 13 | 14 | 15 | 16 | 17 | 18 | 19 | 20 | 21 | 22 | 23 |
| Calquence | 155 | 153 | 153 | 149 | 147 | 146 | 145 | 143 | 143 | 139 | 139 | 137 | 118 | 116 | 73 | 61 | 60 | 25 | 21 | 21 | 1 | 1 | 1 | 0 |
| Investigator's Choice | 155 | 150 | 150 | 146 | 144 | 142 | 136 | 130 | 129 | 112 | 105 | 101 | 82 | 77 | 56 | 44 | 39 | 18 | 10 | 8 | 0 | |||
PFS results for Calquence were consistent across subgroups, including high risk features. In the high risk CLL population (17p deletion, 11q deletion, TP53 mutation and unmutated IGHV), the PFS HR was 0.27 [95% CI (0.17, 0.44)].
Table 14. Subgroup analysis of IRC-assessed PFS (Study ASCEND):
| Calquence monotherapy | |||
|---|---|---|---|
| N | Hazard Ratio | 95% CI | |
| All subjects | 155 | 0.30 | (0.19, 0.48) |
| Del 17P | |||
| Yes No | 28 127 | 0.21 0.33 | (0.07, 0.68) (0.21, 0.54) |
| TP53 mutation | |||
| Yes No | 39 113 | 0.24 0.33 | (0.11, 0.56) (0.20, 0.57) |
| Del 17P or TP53 mutation | |||
| Yes No | 45 108 | 0.21 0.36 | (0.09, 0.48) (0.21, 0.61) |
| IGHV mutation | |||
| Mutated Unmutated | 33 118 | 0.32 0.32 | (0.11, 0.94) (0.19, 0.52) |
| Del 11q | |||
| Yes No | 39 116 | 0.28 0.31 | (0.11, 0.70) (0.19, 0.53) |
| Complex Karyotype | |||
| Yes No | 50 97 | 0.32 0.23 | (0.16, 0.63) (0.12, 0.44) |
At final analysis, with a median follow-up of 46.5 months for Calquence and 45.3 months for the IR/BR, a 72% reduction in risk of investigator-assessed disease progression or death was observed for patients in the Calquence arm. The median investigator assessed PFS was not reached in Calquence and was 16.8 months in IR/BR. Efficacy results per Investigator Assessments (INV) are presented in Table 15. The Kaplan-Meier curve for INV assessed PFS is shown in Figure 4.
Table 15. Efficacy results at final analysis per INV assessments in (ASCEND) patients with CLL:
| Calquence monotherapy N=155 | Investigator's choice of idelalisib + rituximab or bendamustine + rituximab N=155 | |
|---|---|---|
| Progression-free survival* | ||
| Number of events (%) | 62 (40.0) | 119 (76.8) |
| PD, n (%) | 43 (27.7) | 102 (65.8) |
| Death events (%) | 19 (12.3) | 17 (11.0) |
| Median (95% CI), months | NR | 16.8 (14.1, 22.5) |
| HR† (95% CI) | 0.28 (0.20, 0.38) | |
| Overall survivala | ||
| Death events (%) | 41 (26.5) | 54 (34.8) |
| Hazard Ratio (95% CI)† | 0.69 (0.46, 1.04) | - |
CI=confidence interval; HR=hazard ratio; NR=not reached; PD=progressive disease
* Per INV assessment
a Median OS not reached for both arms P=0.0783 for OS.
† Based on stratified Cox-Proportional-Hazards model
Figure 4. Kaplan-Meier curve of INV-assessed PFS at final analysis in (ASCEND) patients with CLL:

| Month | 0 | 3 | 6 | 9 | 12 | 15 | 18 | 21 | 24 | 27 | 30 | 33 | 36 | 39 | 42 | 45 | 48 | 51 | 54 |
| Calquence | 155 | 151 | 143 | 139 | 133 | 128 | 121 | 117 | 111 | 110 | 100 | 94 | 85 | 80 | 79 | 52 | 21 | 4 | 0 |
| Investigator's Choice | 155 | 147 | 138 | 118 | 95 | 76 | 66 | 62 | 52 | 42 | 35 | 32 | 28 | 26 | 23 | 12 | 5 | 0 |
Investigator assessed PFS results at final analysis for Calquence were consistent across subgroups, including high risk features and were consistent with the primary analysis.
Patients with previously untreated MCL
The safety and efficacy of Calquence in patients with previously untreated MCL was evaluated in ECHO, a randomised, double-blind, placebo-controlled, multi-centre, phase 3 study. ECHO included 598 patients 65 years of age and older with confirmed MCL that was previously untreated. Patients were randomised in 1:1 ratio in 2 arms to receive:
- Calquence plus bendamustine and rituximab (Calquence + BR) arm - Calquence 100 mg was administered twice daily from Day 1 of Cycle 1, continuously. Bendamustine, 90 mg/m², was intravenously administered over 30 minutes on Days 1 and 2 of each of six 28-day cycles; and rituximab, 375 mg/m², was intravenously administered on Day 1 of each cycle of six 28-day cycles. Calquence + BR was administered for a maximum of 6 treatment cycles (induction treatment).
- Placebo plus bendamustine and rituximab (Placebo + BR) arm – Placebo was administered twice daily from Day 1 of Cycle 1, continuously. Bendamustine, 90 mg/m², was intravenously administered over 30 minutes on Days 1 and 2 of each of six 28-day cycles; and rituximab, 375 mg/m², was intravenously administered on Day 1 of each cycle of six 28-day cycles. Placebo + BR was administered for a maximum of 6 treatment cycles (induction treatment).
Calquence or placebo was administered continuously until disease progression or unacceptable toxicity. After the induction treatment, patients who were achieving a response (PR or CR) received rituximab maintenance at 375 mg/m² on Day 1 of every other cycle for maximum of 12 additional doses up to Cycle 30. Patients randomised to placebo + BR arm who had confirmed PD were eligible to cross over to Calquence monotherapy at 100 mg twice daily dose until their second disease progression or unacceptable toxicity.
Patient randomisation was stratified by geographic region (North America versus Western Europe versus Other) and simplified MIPI (Mantle Cell Lymphoma International Prognostic Index) score (0-3 versus 4-5 versus 6-11).
The median age was 71 years (65-86), 70.7% were males, 78.3% were Caucasians, 93.1% had an ECOG performance status of 0-1. The simplified MIPI score was low (0-3) in 33.1%, intermediate (4-5) in 42.8% and high (6-11) in 24.1% of patients. A total of 37.7% of patients had tumour bulk ≥5 cm and 86% had Ann Arbor stage IV disease. Aggressive variants of MCL such as blastoid and pleomorphic forms were seen in 7.7% and 5.5% of patients respectively. A total of 47.8% patients had Ki-67 score of ≥30%. The baseline characteristics were similar for both arms.
The primary endpoint was progression-free survival (PFS) as assessed by an Independent Review Committee (IRC) per 2014 Lugano Classification for non-Hodgkin's lymphoma (NHL) in subjects with previously untreated MCL. Additionally, overall response rate (ORR) was also assessed by an IRC.
IRC-assessed PFS was assessed at a median follow-up of 49.8 months.
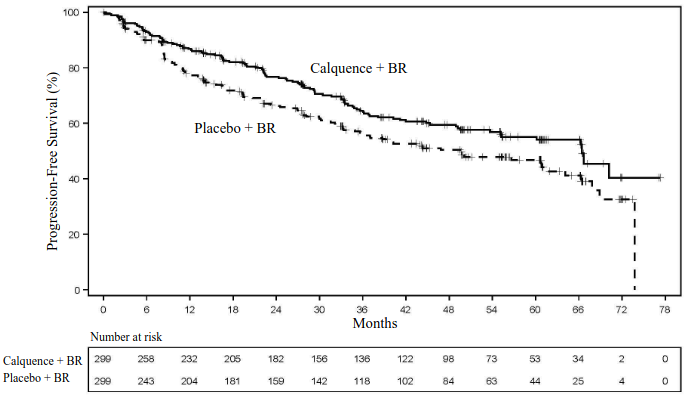
With an additional 6 months of follow-up from the primary PFS analysis, and a median follow-up of 63.0 months, the median overall survival had not been reached in either arm. There were a total of 218 deaths: 105 (35.1%) in the Calquence + BR arm and 113 (37.8%) in the placebo + BR arm. Efficacy results are presented in Table 16. The Kaplan-Meier curves for PFS are shown in Figure 5.
Table 16. Efficacy Results in Patients with previously untreated MCL in ECHO:
| Calquence + BR N=299 | Placebo + BR N=299 | |
|---|---|---|
| IRC-assessed PFS | ||
| Median (95% CI) | 66.4 (55.1, NE) | 49.6 (36.0, 64.1) |
| HR (95% CI) (stratified)* | 0.73 (0.57, 0.94) | |
| p-value‡ | 0.0160 | |
| IRC-assessed ORR | ||
| CR + PR n (%) | 272 (91.0) | 263 (88.0) |
| 95% CI | 87.3,93.8 | 83.9, 91.3 |
| CR n (%) | 199 (66.6) | 160 (53.5) |
| PR n (%) | 73 (24.4) | 103 (34.4) |
| p-value | 0.2196 | - |
HR = hazard ratio, CR = complete response, PR = partial response, NE = not evaluable
* Stratified by randomisation stratification factors: Geographic Regions (North American, Western Europe, Other) and simplified MIPI Score (Low risk [0 to 3], Intermediate risk [4 to 5], High Risk [6 to 11]) as collected via IXRS. Estimated based on stratified Cox Proportional Hazards model for hazard ratio (95% CI).
‡ Estimated based on stratified log-rank test for p-value.
Figure 5. Kaplan-Meier Curve of IRC-Assessed PFS in patients with previously untreated MCL (ECHO):
Patients with MCL who received at least one prior therapy
The safety and efficacy of CALQUENCE in MCL were evaluated in an open-label, multi-centre, single-arm Phase 2 study (ACE-LY-004) of 124 previously treated patients. All patients received CALQUENCE 100 mg orally twice daily until disease progression or unacceptable toxicity. The trial did not include patients who received prior treatment with either BTK or BCL-2 inhibitors. The primary endpoint was investigator-assessed overall response rate (ORR) per the Lugano classification for non-Hodgkin's lymphoma (NHL). Duration of Response (DoR) was an additional outcome measure. Efficacy results at final (54 months) analysis are presented in Table 17.
At final analysis, the median age was 68 (range 42 to 90) years, 79.8% were male and 74.2% were Caucasian. At baseline, 92.8% of patients had an ECOG performance status of 0 or 1. The median time since diagnosis was 46.3 months and the median number of prior treatments was 2 (range 1 to 5), including 17.7% with prior stem cell transplant. The most common prior regimens were CHOP-based (51.6%) and ARA-C (33.9%). At baseline, 37.1% of patients had at least one tumour with a longest diameter ≥5 cm, 72.6% had extra nodal involvement including 50.8% with bone marrow involvement. The simplified MIPI score (which includes age, ECOG score, and baseline lactate dehydrogenase and white cell count) was intermediate in 43.5% and high in 16.9% of patients.
Table 17. ORR and DOR in (ACE-LY-004) Patients with MCL at 54 months final analysis:
| Investigator Assessment at 54 months N=124 n (%) (95% CI*) | |
|---|---|
| Overall Response Rate (ORR) | |
| Overall Response Rate | 101 (81.5%) (73.5, 87.9) |
| Complete Response | 59 (47.6%) (38.5, 56.7) |
| Partial Response | 42 (33.9%) (25.6, 42.9) |
| Non-Evaluable† | 3 (2.4%) (0.5, 6.9) |
| Duration of Response (DoR) | |
| Median (months) | 28.6 (17.5, 39.1) |
CI=Confidence Interval
* 95% exact binomial confidence interval.
† Includes subjects without any adequate post-baseline disease assessment.
Paediatric population
The European Medicines Agency has waived the obligation to submit the results of studies with Calquence in all subsets of the paediatric population for the treatment of mature B-cell neoplasms (for information on paediatric use, see section 4.2).
5.2. Pharmacokinetic properties
The pharmacokinetics (PK) of acalabrutinib and its active metabolite, ACP-5862, were studied in healthy subjects and in patients with B-cell malignancies. Acalabrutinib exhibits dose-proportionality, and both acalabrutinib and ACP-5862 exhibit almost linear PK across a dose range of 75 to 250 mg. Population PK modelling suggests that the PK of acalabrutinib and ACP-5862 is similar across patients with different B-cell malignancies. At the recommended dose of 100 mg twice daily in patients with B-cell malignancies (including, CLL), the geometric mean steady state daily area under the plasma concentration over time curve (AUC24h) and maximum plasma concentration (Cmax) for acalabrutinib were 1679 ng•h/mL and 438 ng/mL, respectively, and for ACP-5862 were 4166 ng•h/mL and 446 ng/mL, respectively.
Absorption
The time to peak plasma concentrations (Tmax) was 0.5-1.5 hours for acalabrutinib, and 1.0 hour for ACP-5862. The absolute bioavailability of Calquence was 25%.
Effect of food on acalabrutinib
In healthy subjects, administration of a single 75 mg dose of acalabrutinib with a high fat, high calorie meal (approximately 918 calories, 59 grams carbohydrate, 59 grams fat and 39 grams protein) did not affect the mean AUC as compared to dosing under fasted conditions. Resulting Cmax decreased by 69% and Tmax was delayed 1-2 hours.
Distribution
Reversible binding to human plasma protein was 99.4% for acalabrutinib and 98.8% for ACP-5862. The in vitro mean blood-to-plasma ratio was 0.8 for acalabrutinib and 0.7 for ACP-5862. The mean steady state volume of distribution (Vss) was approximately 34 L for acalabrutinib.
Biotransformation/Metabolism
In vitro, acalabrutinib is predominantly metabolised by CYP3A enzymes, and to a minor extent by glutathione conjugation and amide hydrolysis. ACP-5862 was identified as the major metabolite in plasma, that was further metabolized primarily by CYP3A-mediated oxidation, with a geometric mean exposure (AUC) that was approximately 2- to 3-fold higher than the exposure of acalabrutinib. ACP-5862 is approximately 50% less potent than acalabrutinib with regard to BTK inhibition.
In vitro studies indicate that acalabrutinib does not inhibit CYP1A2, CYP2B6, CYP2C8, CYP2C9, CYP2C19, CYP2D6, UGT1A1 or UGT2B7 at clinically relevant concentrations and is unlikely to affect clearance of substrates of these CYPs.
In vitro studies indicate that ACP-5862 does not inhibit CYP1A2, CYP2B6, CYP2C8, CYP2C9, CYP2C19, CYP2D6, CYP3A4/5, UGT1A1 or UGT2B7 at clinically relevant concentrations and is unlikely to affect clearance of substrates of these CYPs.
Interactions with transport proteins
In vitro studies indicate that acalabrutinib and ACP-5862 are P-gp and BCRP substrates. Co-administration with BCRP inhibitors is however unlikely to result in clinically relevant drug interactions. Co-administration with an OATP1B1/1B3 inhibitor (600 mg rifampin, single dose) resulted in an increase in acalabrutinib Cmax and AUC by 1.2-fold and 1.4-fold (N=24, healthy subjects), respectively, which is not clinically relevant.
Acalabrutinib and ACP-5862 do not inhibit P-gp, OAT1, OAT3, OCT2, OATP1B1, OATP1B3 and MATE2-K at clinically relevant concentrations. Acalabrutinib may inhibit intestinal BCRP, while ACP-5862 may inhibit MATE1 at clinically relevant concentrations (see section 4.5). Acalabrutinib does not inhibit MATE1, while ACP-5862 does not inhibit BCRP at clinically relevant concentrations.
Elimination
Following a single oral dose of 100 mg acalabrutinib, the terminal elimination half-life (t1/2) of acalabrutinib was 1 to 2 hours. The t1/2 of the active metabolite, ACP-5862, was approximately 7 hours.
The mean apparent oral clearance (CL/F) was 134 L/hr for acalabrutinib and 22 L/hr for ACP-5862 in patients with B-cell malignancies.
Following administration of a single 100 mg radiolabelled [14C]-acalabrutinib dose in healthy subjects, 84% of the dose was recovered in the faeces and 12% of the dose was recovered in the urine, with less than 2% of the dose excreted as unchanged acalabrutinib.
Special populations
Based on population PK analysis, age (>18 years of age), sex, race (Caucasian, African American) and body weight did not have clinically meaningful effects on the PK of acalabrutinib and its active metabolite, ACP-5862.
Paediatric population
No pharmacokinetic studies were performed with Calquence in patients under 18 years of age.
Renal Impairment
Acalabrutinib undergoes minimal renal elimination. A pharmacokinetic study in patients with renal impairment has not been conducted.
Based on population PK analysis, no clinically relevant PK difference was observed in 408 subjects with mild renal impairment (eGFR between 60 and 89 mL/min/1.73m² as estimated by MDRD), 109 subjects with moderate renal impairment (eGFR between 30 and 59 mL/min/1.73m²) relative to 192 subjects with normal renal function (eGFR greater than or equal to 90 mL/min/1.73m²). The pharmacokinetics of acalabrutinib has not been characterised in patients with severe renal impairment (eGFR less than 29 mL/min/1.73m²) or renal impairment requiring dialysis. Patients with creatinine levels greater than 2.5 times the institutional ULN were not included in the clinical studies (see section 4.2).
Hepatic impairment
Acalabrutinib is metabolised in the liver. In dedicated hepatic impairment (HI) studies, compared to subjects with normal liver function (n=6), acalabrutinib exposure (AUC) was increased by 1.9-fold, 1.5-fold and 5.3-fold in subjects with mild (n=6) (Child-Pugh A), moderate (n=6) (Child-Pugh B) and severe (n=8) (Child-Pugh C) hepatic impairment, respectively. Subjects in the moderate HI group were however not significantly affected in markers relevant for the elimination capacity of drugs, so the effect of moderate hepatic impairment was likely underestimated in this study. Based on a population PK analysis, no clinically relevant difference was observed between subjects with mild (n=79) or moderate (n=6) hepatic impairment (total bilirubin between 1.5- to 3-times ULN and any AST) relative to subjects with normal (n=613) hepatic function (total bilirubin and AST within ULN) (see section 4.2).
5.3. Preclinical safety data
Carcinogenicity
Carcinogenicity studies have not been conducted with acalabrutinib.
Genotoxicity/Mutagenicity/Phototoxicity
Acalabrutinib was not mutagenic in a bacterial reverse mutation assay, in an in vitro chromosome aberration assay or in an in vivo mouse bone marrow micronucleus assay.
Based on phototoxicity assays using 3T3 cell line in vitro, acalabrutinib is considered to have a low risk for phototoxicity in humans.
Repeat-dose toxicity
In rats, microscopic findings of minimal to mild severity were observed in the pancreas (haemorrhage/pigment/inflammation/fibrosis in islets) at all dose levels. Non-adverse findings of minimal to mild severity in the kidneys (tubular basophilia, tubular regeneration, and inflammation) were observed in studies of up to 6-month duration with a No Observed Adverse Effect level (NOAEL) of 30 mg/kg/day in rats. The mean exposures (AUC) at the NOAEL in male and female rats correspond to 0.6x and 1x, respectively, the clinical exposure at the recommended dose of 100 mg twice daily, respectively. The Lowest Adverse Observed Effect Level (LOAEL) at which reversible renal (moderate tubular degeneration) and liver (individual hepatocyte necrosis) findings were observed in the chronic rat study was 100 mg/kg/day and provided an exposure margin 4.2-times greater than the clinical exposure at the recommended dose of 100 mg twice daily. In studies of 9 months duration in dogs, the NOAEL was 10 mg/kg/day corresponding to an exposure 3-times the clinical AUC at the recommended clinical dose. Minimal tubular degeneration in kidney, slight decreases in spleen weights and transient minimal to mild decreases in red cell mass and increases in ALT and ALP were observed at 30 mg/kg/day (9-times the clinical AUC) in dogs. Cardiac toxicities in rats (myocardial haemorrhage, inflammation, necrosis) and dogs (perivascular/vascular inflammation) were observed only in animals that died during studies at doses above the maximum tolerated dose (MTD). The exposures in rats and dogs with cardiac findings was at least 6.8-times and 25-times the clinical AUC, respectively. Reversibility for the heart findings could not be assessed as these findings were only observed at doses above the MTD.
Reproductive toxicology
No effects on fertility were observed in male or female rats at exposures 10- or 9-times the clinical AUC at the recommended dose, respectively.
No effects on embryofoetal development and survival were observed in pregnant rats, at exposures approximately 9-times the AUC in patients at the recommended dose of 100 mg twice daily. In two rat reproductive studies, dystocia (prolonged/difficult labour) was observed at exposures >2.3-times the clinical exposure at 100 mg twice daily. The presence of acalabrutinib and its active metabolite were confirmed in foetal rat plasma. Acalabrutinib and its active metabolite were present in the milk of lactating rats.
In an embryofoetal study in pregnant rabbits, decreased foetal body weight and delayed ossification were observed at exposure levels that produced maternal toxicity which were 2.4-times greater than the human AUC at the recommended dose.
© All content on this website, including data entry, data processing, decision support tools, "RxReasoner" logo and graphics, is the intellectual property of RxReasoner and is protected by copyright laws. Unauthorized reproduction or distribution of any part of this content without explicit written permission from RxReasoner is strictly prohibited. Any third-party content used on this site is acknowledged and utilized under fair use principles.