CALQUENCE Capsule Ref.[10764] Active ingredients: Acalabrutinib
Source: FDA, National Drug Code (US) Revision Year: 2019
12.1. Mechanism of Action
Acalabrutinib is a small-molecule inhibitor of BTK. Acalabrutinib and its active metabolite, ACP-5862, form a covalent bond with a cysteine residue in the BTK active site, leading to inhibition of BTK enzymatic activity. BTK is a signaling molecule of the B cell antigen receptor (BCR) and cytokine receptor pathways. In B cells, BTK signaling results in activation of pathways necessary for B-cell proliferation, trafficking, chemotaxis, and adhesion. In nonclinical studies, acalabrutinib inhibited BTK-mediated activation of downstream signaling proteins CD86 and CD69 and inhibited malignant B-cell proliferation and tumor growth in mouse xenograft models.
12.2. Pharmacodynamics
In patients with B-cell malignancies dosed with 100 mg approximately every 12 hours, median steady state BTK occupancy of ≥95% in peripheral blood was maintained over 12 hours, resulting in inactivation of BTK throughout the recommended dosing interval.
Cardiac Electrophysiology
The effect of acalabrutinib on the QTc interval was evaluated in a randomized, double-blind, double-dummy, placebo‑ and positive-controlled, 4-way crossover thorough QTc study in 48 healthy adult subjects. Administration of a single dose of acalabrutinib that is the 4-fold maximum recommended single dose did not prolong the QTc interval to any clinically relevant extent (i.e., ≥10 ms).
12.3. Pharmacokinetics
Acalabrutinib exhibits dose-proportionality, and both acalabrutinib and its active metabolite, ACP-5862, exposures increase with dose across a dose range of 75 to 250 mg (0.75 to 2.5 times the approved recommended single dose) in patients with B-cell malignancies. At the recommended dose of 100 mg twice daily, the geometric mean (% coefficient of variation [CV]) daily area under the plasma drug concentration over time curve (AUC24h) and maximum plasma concentration (Cmax) for acalabrutinib were 1843 (38%) ng•h/mL and 563 (29%) ng/mL, respectively, and for ACP-5862 were 3947 (43%) ng•h/mL and 451 (52%) ng/mL, respectively.
Absorption
The geometric mean absolute bioavailability of acalabrutinib was 25%. Median [min, max] time to peak acalabrutinib plasma concentrations (Tmax) was 0.9 [0.5, 1.9] hours, and 1.6 [0.9, 2.7] hour for ACP-5862.
Effect of Food
In healthy subjects, administration of a single 75 mg dose of acalabrutinib (0.75 times the approved recommended single dose) with a high-fat, high-calorie meal (approximately 918 calories, 59 grams carbohydrate, 59 grams fat, and 39 grams protein) did not affect the mean AUC as compared to dosing under fasted conditions. Resulting Cmax decreased by 73% and Tmax was delayed 1-2 hours.
Distribution
Reversible binding to human plasma protein was 97.5% for acalabrutinib and 98.6% for ACP-5862. The in vitro mean blood-to-plasma ratio was 0.8 for acalabrutinib and 0.7 for ACP-5862. The geometric mean (% CV) steady-state volume of distribution (Vss) was approximately 101 (52%) L for acalabrutinib and 67 (32%) L for ACP-5862.
Elimination
The geometric mean (% CV) terminal elimination half-life (t½) was 1 (59%) hour for acalabrutinib and 3.5 (24%) hours for ACP-5862. The geometric mean (%CV) apparent oral clearance (CL/F) was 71 (35%) L/hr for acalabrutinib and 13 (42%) L/hr for ACP-5862.
Metabolism
Acalabrutinib is predominantly metabolized by CYP3A enzymes, and to a minor extent, by glutathione conjugation and amide hydrolysis, based on in vitro studies. ACP-5862 was identified as the major active metabolite in plasma with a geometric mean exposure (AUC) that was approximately 2- to 3-fold higher than the exposure of acalabrutinib. ACP-5862 is approximately 50% less potent than acalabrutinib with regard to BTK inhibition.
Excretion
Following administration of a single 100 mg radiolabeled acalabrutinib dose in healthy subjects, 84% of the dose was recovered in the feces and 12% of the dose was recovered in the urine, with less than 2% of the dose excreted as unchanged acalabrutinib in urine and feces.
Specific Populations
Age, Race, and Body Weight
Age (32 to 90 years), sex, race (Caucasian, African American), and body weight (40 to 149 kg) did not have clinically meaningful effects on the PK of acalabrutinib and its active metabolite, ACP-5862.
Renal Impairment
No clinically relevant PK difference was observed in patients with mild or moderate renal impairment (eGFR ≥30 mL/min/1.73m², as estimated by MDRD (modification of diet in renal disease equation)). Acalabrutinib PK has not been evaluated in patients with severe renal impairment (eGFR <29 mL/min/1.73m², MDRD) or renal impairment requiring dialysis.
Hepatic Impairment
The AUC of acalabrutinib increased 1.9-fold in subjects with mild hepatic impairment (Child-Pugh class A), 1.5-fold in subjects with moderate hepatic impairment (Child-Pugh class B) and 5.3-fold in subjects with severe hepatic impairment (Child-Pugh class C) compared to subjects with normal liver function. No clinically relevant PK difference in ACP-5862 was observed in subjects with severe hepatic impairment (Child-Pugh Class C) compared to subjects with normal liver function. No clinically relevant PK differences in acalabrutinib and ACP-5862 were observed in patients with mild or moderate hepatic impairment (total bilirubin less and equal to upper limit of normal [ULN] and AST greater than ULN, or total bilirubin greater than ULN and any AST) relative to patients with normal hepatic function (total bilirubin and AST within ULN).
Drug Interaction Studies
Effect of CYP3A Inhibitors on Acalabrutinib
Co-administration with a strong CYP3A inhibitor (200 mg itraconazole once daily for 5 days) increased the acalabrutinib Cmax by 3.9-fold and AUC by 5.1-fold in healthy subjects.
Physiologically based pharmacokinetic (PBPK) simulations with acalabrutinib and moderate CYP3A inhibitors (erythromycin, fluconazole, diltiazem) showed that co-administration increased acalabrutinib Cmax and AUC approximately 2- to 3-fold.
Effect of CYP3A Inducers on Acalabrutinib
Co-administration with a strong CYP3A inducer (600 mg rifampin once daily for 9 days) decreased acalabrutinib Cmax by 68% and AUC by 77% in healthy subjects.
Gastric Acid Reducing Agents
Acalabrutinib solubility decreases with increasing pH. Co-administration with an antacid (1 g calcium carbonate) decreased acalabrutinib AUC by 53% in healthy subjects. Co-administration with a proton pump inhibitor (40 mg omeprazole for 5 days) decreased acalabrutinib AUC by 43%.
In Vitro Studies
Metabolic Pathways
Acalabrutinib is a weak inhibitor of CYP3A4/5, CYP2C8 and CYP2C9, but does not inhibit CYP1A2, CYP2B6, CYP2C19, CYP2D6, UGT1A1, and UGT2B7. ACP-5862 is a weak inhibitor of CYP2C8, CYP2C9 and CYP2C19, but does not inhibit CYP1A2, CYP2B6, CYP2D6, CYP3A4/5, UGT1A1, and UGT2B7.
Acalabrutinib is a weak inducer of CYP1A2, CYP2B6 and CYP3A4; ACP-5862 weakly induces CYP3A4.
Based on in vitro data and PBPK modeling, no interaction with CYP substrates is expected at clinically relevant concentrations.
Drug Transporter Systems
Acalabrutinib and its active metabolite, ACP-5862, are substrates of P-glycoprotein (P-gp) and breast cancer resistance protein (BCRP). Acalabrutinib is not a substrate of renal uptake transporters OAT1, OAT3, and OCT2, or hepatic transporters OATP1B1, and OATP1B3. ACP-5862 is not a substrate of OATP1B1 or OATP1B3.
Acalabrutinib and ACP-5862 do not inhibit P-gp, OAT1, OAT3, OCT2, OATP1B1, OATP1B3, and MATE2-K at clinically relevant concentrations.
Acalabrutinib may increase exposure to co-administered BCRP substrates (e.g., methotrexate) by inhibition of intestinal BCRP. ACP-5862 does not inhibit BCRP at clinically relevant concentrations. Acalabrutinib does not inhibit MATE1, while ACP-5862 may increase exposure to co-administered MATE1 substrates (e.g., metformin) by inhibition of MATE1.
13.1. Carcinogenesis, Mutagenesis, Impairment of Fertility
Carcinogenicity studies have not been conducted with acalabrutinib.
Acalabrutinib was not mutagenic in an in vitro bacterial reverse mutation (AMES) assay or clastogenic in an in vitro human lymphocyte chromosomal aberration assay or in an in vivo rat bone marrow micronucleus assay.
In a fertility study in rats, there were no effects of acalabrutinib on fertility in male rats at exposures 11‑times, or in female rats at exposures 9‑times the AUC observed in patients at the recommended dose of 100 mg twice daily.
14. Clinical Studies
14.1 Mantle Cell Lymphoma
The efficacy of CALQUENCE was based upon Trial LY-004 titled "An Open-label, Phase 2 Study of ACP-196 in Subjects with Mantle Cell Lymphoma" (NCT02213926). Trial LY-004 enrolled a total of 124 patients with MCL who had received at least one prior therapy.
The median age was 68 (range 42 to 90) years, 80% were male, and 74% were Caucasian. At baseline, 93% of patients had an ECOG performance status of 0 or 1. The median time since diagnosis was 46.3 months and the median number of prior treatments was 2 (range 1 to 5), including 18% with prior stem cell transplant. Patients who received prior treatment with BTK inhibitors were excluded. The most common prior regimens were CHOP-based (52%) and ARA-C (34%). At baseline, 37% of patients had at least one tumor with a longest diameter ≥5 cm, 73% had extra nodal involvement including 51% with bone marrow involvement. The simplified MIPI score (which includes age, ECOG score, and baseline lactate dehydrogenase and white cell count) was intermediate in 44% and high in 17% of patients.
CALQUENCE was administered orally at 100 mg approximately every 12 hours until disease progression or unacceptable toxicity. The median dose intensity was 98.5%. The major efficacy outcome of Trial LY-004 was overall response rate and the median follow-up was 15.2 months.
Table 9. Efficacy Results in Patients with MCL in Trial LY-004:
| Investigator Assessed N=124 | Independent Review Committee (IRC) Assessed N=124 | |
|---|---|---|
| Overall Response Rate (ORR)* | ||
| ORR (%) [95% CI] | 81 [73, 87] | 80 [72, 87] |
| Complete Response (%) [95% CI] | 40 [31, 49] | 40 [31, 49] |
| Partial Response (%) [95% CI] | 41 [32, 50] | 40 [32, 50] |
| Duration of Response (DoR) | ||
| Median DoR in months [range] | NE [1+ to 20+] | NE [0+ to 20+] |
CI= Confidence Interval; NE=Not Estimable; + indicates censored observations
* Per 2014 Lugano Classification.
The median time to best response was 1.9 months.
Lymphocytosis
Upon initiation of CALQUENCE, a temporary increase in lymphocyte counts (defined as absolute lymphocyte count (ALC) increased ≥ 50% from baseline and a post baseline assessment ≥5 x 10⁹) in 31.5% of patients in Trial LY-004. The median time to onset of lymphocytosis was 1.1 weeks and the median duration of lymphocytosis was 6.7 weeks.
14.2 Chronic Lymphocytic Leukemia
The efficacy of CALQUENCE in patients with CLL was demonstrated in two randomized, controlled trials. The indication for CALQUENCE includes patients with SLL because it is the same disease.
ELEVATE-TN
The efficacy of CALQUENCE was evaluated in the ELEVATE-TN trial, a randomized, multicenter, open-label, actively controlled, 3 arm trial of CALQUENCE in combination with obinutuzumab, CALQUENCE monotherapy, and obinutuzumab in combination with chlorambucil in 535 patients with previously untreated chronic lymphocytic leukemia (NCT02475681). Patients 65 years of age or older or between 18 and 65 years of age with a total Cumulative Illness Rating Scale (CIRS) >6 or creatinine clearance of 30 to 69 mL/min were enrolled. The trial also required hepatic transaminases ≤3 times upper limit of normal (ULN) and total bilirubin ≤1.5 times ULN, and excluded patients with Richter's transformation.
Patients were randomized in a 1:1:1 ratio into 3 arms to receive:
- CALQUENCE plus obinutuzumab (CALQUENCE+G): CALQUENCE 100 mg was administered approximately every 12 hours starting on Cycle 1 Day 1 until disease progression or unacceptable toxicity. Obinutuzumab was administered starting on Cycle 2 Day 1 for a maximum of 6 treatment cycles. Obinutuzumab 1000 mg was administered on Days 1 and 2 (100 mg on Day 1 and 900 mg on Day 2), 8 and 15 of Cycle 2 followed by 1000 mg on Day 1 of Cycles 3 up to 7. Each cycle was 28 days.
- CALQUENCE monotherapy: CALQUENCE 100 mg was administered approximately every 12 hours until disease progression or unacceptable toxicity.
- Obinutuzumab plus chlorambucil (GClb): Obinutuzumab and chlorambucil were administered for a maximum of 6 treatment cycles. Obinutuzumab 1000 mg was administered intravenously on Days 1 and 2 (100 mg on Day 1 and 900 mg on Day 2), 8 and 15 of Cycle 1 followed by 1000 mg on Day 1 of Cycles 2 to 6. Chlorambucil 0.5 mg/kg was administered orally on Days 1 and 15 of Cycles 1 to 6. Each cycle was 28 days.
Randomization was stratified by 17p deletion mutation status, ECOG performance status (0 or 1 versus 2), and geographic region. A total of 535 patients were randomized, 179 to CALQUENCE+G, 179 to CALQUENCE monotherapy, and 177 to GClb. The overall median age was 70 years (range: 41 to 91 years), 47% had Rai stage III or IV disease, 14% had 17p deletion or TP53 mutation, 63% of patients had an unmutated IGVH, and 18% had 11q deletion. Baseline demographic and disease characteristics were similar between treatment arms.
Efficacy was based on progression-free survival (PFS) as assessed by an Independent Review Committee (IRC). The median duration of follow-up was 28.3 months (range: 0.0 to 40.8 months). Efficacy results are presented in Table 10. The Kaplan-Meier curves for PFS are shown in Figure 1.
Table 10. Efficacy Results per IRC in Patients with CLL - ITT population (ELEVATE-TN):
| CALQUENCE plus Obinutuzumab N=179 | CALQUENCE Monotherapy N=179 | Obinutuzumab plus Chlorambucil N=177 | |
|---|---|---|---|
| Progression-Free Survival* | |||
| Number of events (%) | 14 (8) | 26 (15) | 93 (53) |
| PD, n (%) | 9 (5) | 20 (11) | 82 (46) |
| Death events, n (%) | 5 (3) | 6 (3) | 11 (6) |
| Median (95% CI), months† | NE | NE (34, NE) | 22.6 (20, 28) |
| HR‡ (95% CI) | 0.10 (0.06, 0.17) | 0.20 (0.13, 0.30) | - |
| p-value§ | < 0.0001 | < 0.0001 | - |
| Overall Response Rate* (CR + CRi + nPR + PR) | |||
| ORR, n (%) | 168 (94) | 153 (86) | 139 (79) |
| (95% CI) | (89, 97) | (80, 90) | (72, 84) |
| p-value¶ | < 0.0001 | 0.0763 | - |
| CR, n (%) | 23 (13) | 1 (1) | 8 (5) |
| CRi, n (%) | 1 (1) | 0 | 0 |
| nPR, n (%) | 1 (1) | 2 (1) | 3 (2) |
| PR, n (%) | 143 (80) | 150 (84) | 128 (72) |
ITT=intent-to-treat; CI=confidence interval; HR=hazard ratio; NE=not estimable; CR=complete response; CRi=complete response with incomplete blood count recovery; nPR=nodular partial response; PR=partial response.
* Per 2008 International Workshop on CLL (IWCLL) criteria.
† Kaplan-Meier estimate.
‡ Based on a stratified Cox-Proportional-Hazards model. Both hazard ratios are compared with the obinutuzumab and chlorambucil arm.
§ Based on a stratified log-rank test, with an alpha level of 0.012 derived from alpha spending function by the O'Brien-Fleming method.
¶ Based on a stratified Cochran–Mantel–Haenszel test, for the comparison with the obinutuzumab and chlorambucil arm.
Figure 1. Kaplan-Meier Curve of IRC-Assessed PFS in Patients with CLL in ELEVATE-TN:
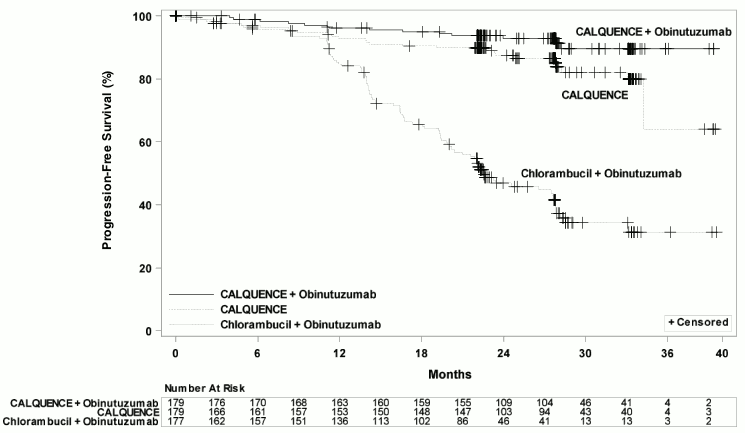
With a median follow-up of 28.3 months, median overall survival was not reached in any arm, with fewer than 10% of patients experiencing an event.
ASCEND
The efficacy of CALQUENCE in patients with relapsed or refractory CLL was based upon a multicenter, randomized, open-label trial (ASCEND; NCT02970318). The trial enrolled 310 patients with relapsed or refractory CLL after at least 1 prior systemic therapy. The trial excluded patients with transformed disease, prolymphocytic leukemia, or previous treatment with venetoclax, a Bruton tyrosine kinase inhibitor, or a phosphoinositide-3 kinase inhibitor.
Patients were randomized in a 1:1 ratio to receive either:
- CALQUENCE 100 mg approximately every 12 hours until disease progression or unacceptable toxicity, or
- Investigator's choice:
- Idelalisib plus a rituximab product (IR): Idelalisib 150 mg orally approximately every 12 hours until disease progression or unacceptable toxicity, in combination with 8 infusions of a rituximab product (375 mg/m² intravenously on Day 1 of Cycle 1, followed by 500 mg/m² every 2 weeks for 4 doses and then every 4 weeks for 3 doses), with a 28-day cycle length.
- Bendamustine plus a rituximab product (BR): Bendamustine 70 mg/m² intravenously (Day 1 and 2 of each 28-day cycle), in combination with a rituximab product (375 mg/m² intravenously on Day 1 of Cycle 1, then 500 mg/m² on Day 1 of subsequent cycles), for up to 6 cycles.
Randomization was stratified by 17p deletion mutation status, ECOG performance status (0 or 1 versus 2), and number of prior therapies (1 to 3 versus ≥4). Of 310 patients total, 155 were assigned to CALQUENCE monotherapy, 119 to IR, and 36 to BR. The median age overall was 67 years (range: 32 to 90 years), 42% had Rai stage III or IV disease, 28% had 17p deletion or TP53 mutation, 78% of patients had an unmutated IGVH, and 27% had a 11q deletion. The CALQUENCE arm had a median of 1 prior therapy (range 1-8), with 47% having at least 2 prior therapies. The investigator's choice arm had a median of 2 prior therapies (range 1-10), with 57% having at least 2 prior therapies.
In the CALQUENCE arm, the median treatment duration was 15.7 months, with 94% of patients treated for at least 6 months and 86% of patients treated for at least 1 year. In the investigator's choice arm, the median treatment duration was 8.4 months, with 59% of patients treated for at least 6 months and 37% treated for at least 1 year.
Efficacy was based on PFS as assessed by an IRC, with a median follow-up of 16.1 months (range 0.03 to 22.4 months). Efficacy results are presented in Table 11. The Kaplan-Meier curve for PFS is shown in Figure 2. There was no statistically significant difference in overall response rates between the two treatment arms.
Table 11. Efficacy Results per IRC in Patients with Relapsed or Refractory CLL – ITT Population (ASCEND):
| CALQUENCE Monotherapy N=155 | Investigator's Choice of Idelalisib + Rituximab Product or Bendamustine + Rituximab Product N=155 | |
|---|---|---|
| Progression-Free Survival* | ||
| Number of events, n (%) | 27 (17) | 68 (44) |
| Disease progression, n | 19 | 59 |
| Death, n | 8 | 9 |
| Median (95% CI), months† | NE (NE, NE) | 16.5 (14.0, 17.1) |
| HR (95% CI)‡ | 0.31 (0.20, 0.49) | |
| P-value§ | <0.0001 | |
| Overall Response Rate (CR + CRi + nPR + PR)*¶ | ||
| ORR, n (%)¶ | 126 (81) | 117 (75) |
| (95% CI) | (74, 87) | (68, 82) |
| CR, n (%) | 0 | 2 (1) |
| CRi, n (%) | 0 | 0 |
| nPR, n (%) | 0 | 0 |
| PR, n (%) | 126 (81) | 115 (74) |
ITT=intent-to-treat; CI=confidence interval; HR=hazard ratio; NE=not estimable; CR=complete response; CRi=complete response with incomplete blood count recovery; nPR=nodular partial response; PR=partial response
* Per 2008 IWCLL criteria.
† Kaplan-Meier estimate
‡ Based on a stratified Cox-Proportional-Hazards model
§ Based on a stratified Log-rank test. The pre-specified type I error rate (α) for this interim analysis is 0.012 derived from a Lan-DeMets alpha spending function with O'Brien-Fleming boundary
¶ Through a hierarchical testing procedure, the difference in ORR was not statistically significant, based on a Cochran-Mantel Haenzel test with adjustment for randomization stratification factors.
Figure 2. Kaplan-Meier Curve of IRC-Assessed PFS in Patients with CLL in ASCEND:
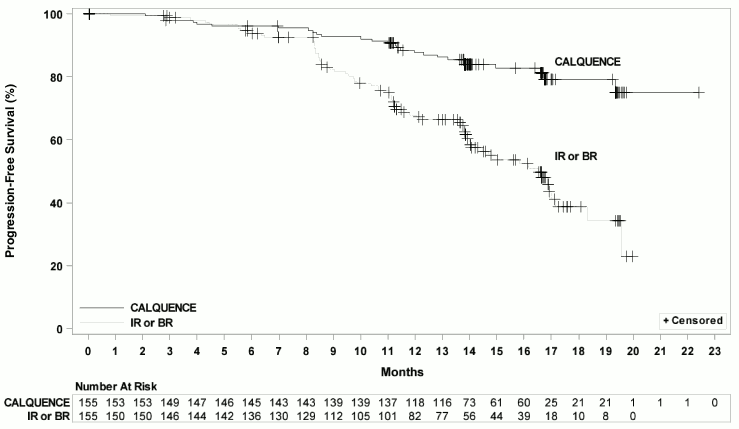
With a median follow up of 16.1 months, median overall survival was not reached in either arm, with fewer than 11% of patients experiencing an event.
© All content on this website, including data entry, data processing, decision support tools, "RxReasoner" logo and graphics, is the intellectual property of RxReasoner and is protected by copyright laws. Unauthorized reproduction or distribution of any part of this content without explicit written permission from RxReasoner is strictly prohibited. Any third-party content used on this site is acknowledged and utilized under fair use principles.