EPERZAN Powder and solvent for solution for injection Ref.[27937] Active ingredients: Albiglutide
Source: European Medicines Agency (EU) Revision Year: 2021 Publisher: GlaxoSmithKline Trading Services Limited, Currabinny, Carrigaline, County Cork, Ireland
5.1. Pharmacodynamic properties
Pharmacotherapeutic group: Drugs used in diabetes. Other blood glucose lowering drugs excl. insulins. Glucagon-like peptide-1 (GLP-1) analogues
ATC code: A10BJ04
Mechanism of action
Albiglutide is an agonist of the GLP-1 receptor and augments glucose-dependent insulin secretion. Albiglutide also slows gastric emptying.
Pharmacodynamic effects
Glucose control
Eperzan lowers fasting glucose and reduces postprandial glucose excursions. The majority of the observed reduction in fasting plasma glucose occurs after a single dose, consistent with the pharmacokinetic profile of albiglutide.
In patients with type 2 diabetes who received 2 doses of albiglutide 32 mg (Day 1 and 8), a statistically significant reduction (24%) in postprandial glucose AUC(0.5-4.5h) was observed compared to placebo following a standardised breakfast meal on Day 9.
A single dose of albiglutide 50 mg did not impair the glucagon, epinephrine, norepinephrine, cortisol or growth hormone counter-regulatory hormone response to hypoglycaemia.
Gastric motility
Albiglutide slowed gastric emptying compared with placebo for both solids and liquids when 100 mg was administered as a single dose in healthy subjects. For solids, gastric emptying t1/2 increased from 1.14 h to 2.23 h (p=0.0112). For liquids, gastric emptying t1/2 increased from 0.28 h to 0.69 h (p=0.0018).
Clinical efficacy and safety
A total of 2,365 patients with type 2 diabetes were treated with Eperzan and 2,530 received other study medications in 8 active and placebo-controlled phase III clinical trials. Studies evaluated the use of Eperzan 30 mg and 50 mg once weekly, allowing for optional titration of Eperzan from 30 mg to 50 mg once weekly in 5 of the 8 studies. Across the 8 clinical trials, and including subjects in all treatment groups, a total of 19% of patients (N = 937) were 65 years of age and older, and 2% (N = 112) were 75 years of age and older, 52% were male, with a mean body mass index (BMI) of 33 kg/m². Sixty seven percent of patients were Caucasian, 15% African American/African heritage and 11% Asian; 26% of patients were Hispanic/Latino.
No overall differences in glycaemic effectiveness or body weight were observed across demographic subgroups (age, gender, race/ethnicity, duration of diabetes).
Monotherapy
The efficacy of Eperzan was evaluated in a 3-year randomised, double-blind, placebo-controlled, multicentre study (n = 296) in patients inadequately controlled on diet and exercise. Patients were randomised (1:1:1) to Eperzan 30 mg once weekly, Eperzan 30 mg once weekly uptitrated to 50 mg once weekly at week 12, or placebo. The primary endpoint was change in HbA1c from baseline at 52 weeks. Compared to placebo, treatment with Eperzan 30 mg and 50 mg SC weekly resulted in statistically significant reductions in HbA1c from baseline at Week 52. The change from baseline in HbA1c at the 6 month timepoint was also statistically significant for the 30 mg (0.9%) and 50 mg (1.1%) weekly doses of Eperzan (see Table 2).
Table 2. Results at 52 weeks in a placebo-controlled study with two doses of Eperzan (30 vs. 50 mg SC weekly) as monotherapy:
| Eperzan 30 mg weekly | Eperzan 50 mg weekly | Placebo | |
|---|---|---|---|
| ITTa (N) | N = 100 | N = 97 | N = 99 |
| HbA1c (%) | |||
| Baseline (mean) | 8.05 | 8.21 | 8.02 |
| Change at Week 52b | -0.70 | -0.9 | +0.2 |
| Difference from placebob (95% CI) | -0.8 (-1.1, -0.6)c | -1.0 (-1.3, -0.8)c | |
| Patients (%) Achieving HbA1c <7% | 49 | 40 | 21 |
| Body Weight (kg) | |||
| Baseline (mean) | 96 | 97 | 96 |
| Change at Week 52b | -0.4 | -0.9 | -0.7 |
| Difference from placebob (95% CI) | 0.3 (-0.9, 1.5) | -0.2 (-1.4, 1.0) | |
a Intent to treat population - last observation carried forward
b Adjusted mean
c P <0.05 for treatment difference
Combination Therapy
Add-on to metformin
The efficacy of Eperzan was evaluated in a 3-year, randomised, double-blind, multicentre study (n = 999). On background therapy of metformin ≥1,500 mg daily, Eperzan 30 mg SC weekly (with optional uptitration to 50 mg weekly after a minimum of 4 weeks) was compared to sitagliptin 100 mg daily, glimepiride 2 mg daily (with optional titration to 4 mg daily), or placebo. The primary endpoint was change in HbA1c from baseline at 2 years compared to placebo. Results at 104 weeks are presented in Table 3. Eperzan demonstrated glycaemic lowering and was statistically superior in reduction in HbA1c from baseline compared to placebo, sitagliptin, or glimepiride (see Table 3).
Table 3. Results at 104 weeks in a placebo-controlled study comparing Eperzan 30 mg SC weekly (with optional uptitration to 50 mg weekly) to sitagliptin 100 mg daily and glimepiride 2 to 4 mg daily as add-on therapy in patients inadequately controlled on metformin ≥1,500 mg daily:
| Eperzan 30 mg/50 mg Weekly + Metformin ≥1,500 mg daily | Placebo + Metformin ≥1,500 mg daily | Sitagliptin 100 mg daily + Metformin ≥1,500 mg daily | Glimepiride 2 to 4 mg daily + Metformin ≥1,500 mg daily | |
|---|---|---|---|---|
| ITTa (N) | 297 | 100 | 300 | 302 |
| HbA1c (%) | ||||
| Baseline (mean) | 8.1 | 8.1 | 8.1 | 8.1 |
| Change at Week 104b | -0.6 | +0.3 | -0.3 | -0.4 |
| Difference from placebo + metforminb, (95% CI) | -0.9 (-1.2, -0.7)c | |||
| Difference from sitagliptin + metforminb, (95% CI) | -0.4 (-0.5, -0.2)c | |||
| Difference from glimepiride + metforminb, (95% CI) | -0.3 (-0.5, -0.1)c | |||
| Proportion Achieving HbA1c <7% | 39 | 16 | 32 | 31 |
| Body Weight (kg) | ||||
| Baseline (mean) | 90 | 92 | 90 | 92 |
| Change at Week 104b | -1.2 | -1.0 | -0.9 | +1.2 |
| Difference from placebo + metforminb, (95% CI) | -0.2 (-1.1, 0.7) | |||
| Difference from sitagliptin + metforminb, (95% CI) | -0.4 (-1.0, 0.3) | |||
| Difference from glimepiride + metforminb, (95% CI) | -2.4 (-3.0, -1.7)c | |||
a Intent to treat population - last observation carried forward
b Adjusted mean
c P <0.05 for treatment difference
Add-on to pioglitazone
The efficacy of Eperzan was evaluated in a 3-year, randomised, double-blind, multicentre study (n = 299). Eperzan 30 mg SC weekly was compared to placebo in patients inadequately controlled on pioglitazone ≥30 mg daily (with or without metformin ≥1,500 mg daily).
Compared to placebo, treatment with Eperzan resulted in statistically significant reductions from baseline in HbA1c (-0.8% for Eperzan versus -0.1% for placebo, p <0.05) and FPG (-1.3 mmol/l for Eperzan versus +0.4 mmol/l for placebo, p <0.05) at 52 weeks. The change from baseline in weight did not differ significantly between treatment groups (see Table 4).
Table 4. Results at 52 weeks in a placebo-controlled study comparing Eperzan 30 mg SC weekly as add-on therapy in patients inadequately controlled on pioglitazone ≥30 mg daily metformin ≥1,500 mg daily:
| Eperzan 30 mg Weekly + Pioglitazone ≥30 mg daily (+/- Metformin ≥1,500 mg daily) | Placebo + Pioglitazone ≥30 mg daily (+/- Metformin ≥1,500 mg daily) | |
|---|---|---|
| ITTa (N) | N = 150 | N = 149 |
| HbA1c (%) | ||
| Baseline (mean) | 8.1 | 8.1 |
| Change at Week 52b | -0.8 | -0.05 |
| Difference from placebo + pioglitazoneb (95% CI) | -0.8 (-1.0, -0.6)c | |
| Proportion Achieving HbA1c <7% | 44 | 15 |
| Body Weight (kg) | ||
| Baseline (mean) | 98 | 100 |
| Change at Week 52b | 0.3 | +0.5 |
| Difference from placebo + pioglitazoneb (95% CI) | -0.2 (-1.2, 0.8) | |
a Intent to treat population - last observation carried forward
b Adjusted mean
c P <0.05 for treatment difference
Add-on to metformin plus sulphonylurea
The efficacy of Eperzan was evaluated in a 3-year, randomised, double-blind, multicentre study (n = 657). On background therapy of metformin ≥1,500 mg daily plus glimepiride 4 mg daily, Eperzan 30 mg SC weekly (with optional uptitration to 50 mg weekly after a minimum of 4 weeks) was compared to placebo or pioglitazone 30 mg daily (with optional titration to 45 mg/day). The primary endpoint was change in HbA1c from baseline at 52 weeks compared to placebo. At 52 weeks, treatment with Eperzan resulted in statistically significant reductions from baseline in HbA1c compared to placebo. Treatment with Eperzan did not meet the pre-specified noninferiority margin (0.3%) against pioglitazone for HbA1c. The change from baseline in weight for Eperzan did not differ significantly from placebo but was significantly less compared to pioglitazone (see Table 5).
Table 5. Results at 52 weeks in a placebo-controlled study comparing Eperzan 30 mg SC weekly (with optional uptitration to 50 mg weekly) to pioglitazone 30 mg daily (with optional titration to 45 mg/day) as add-on therapy in patients inadequately controlled on metformin + sulphonylurea (glimepiride 4 mg daily):
| Eperzan 30 mg/50 mg Weekly + Metformin ≥1,500 mg daily + Glimepiride 4 mg daily | Placebo + Metformin ≥1,500 mg daily + Glimepiride 4 mg daily | Pioglitazone + Metformin ≥1,500 mg daily + Glimepiride 4 mg daily | |
|---|---|---|---|
| ITTa (N) | 269 | 115 | 273 |
| HbA1c (%) | |||
| Baseline (mean) | 8.2 | 8.3 | 8.3 |
| Change at Week 52b | -0.6 | +0.33 | -0.80 |
| Difference from placebo + met + glimb (95% CI) | -0.9 (-1.1, -0.7)c | ||
| Difference from pioglitazone + met + glimb (95% CI) | 0.3 (0.1, 0.4) | ||
| Proportion Achieving HbA1c <7% | 30 | 9 | 35 |
| Body Weight (kg) | |||
| Baseline (mean) | 91 | 90 | 91 |
| Change at Week 52b | -0.4 | -0.4 | +4.4 |
| Difference from placebo + met + glimb (95% CI) | -0.03 (-0.9, 0.8) | ||
| Difference from pioglitazone + met + glimb (95% CI) | -4.9 (-5.5, -4.2)c | ||
a Intent to treat population - last observation carried forward
b Adjusted mean
c P <0.05 for treatment difference
Add-on to insulin glargine
The efficacy of Eperzan was evaluated in a 52 week, randomised, open-label, multicentre noninferiority study (n = 563). On background therapy of insulin glargine (started at 10 units and titrated to ≥20 units per day), Eperzan 30 mg SC once weekly (with uptitration to 50 mg if inadequately controlled after Week 8) was compared to prandial insulin lispro (administered daily at mealtimes, started according to standard of care and titrated to effect). The primary endpoint was change in HbA1c from baseline at 26 weeks. At Week 26, the mean daily dose of insulin glargine was 53 IU for Eperzan and 51 IU for lispro. The mean daily dose of insulin lispro at Week 26 was 31 IU, and at Week 52, 69% of patients treated with Eperzan were on 50 mg weekly. At 26 weeks, the between-treatment difference in HbA1c of 0.2% for Eperzan and insulin lispro met the pre-specified noninferiority margin (0.4%). Treatment with Eperzan resulted in a mean weight loss for Eperzan (-0.7 kg) compared to a mean weight gain for insulin lispro (+0.8 kg) and the difference between treatment groups was statistically significant (see Table 6).
Table 6. Results at 26 weeks in a study comparing Eperzan 30 mg SC weekly (with optional uptitration to 50 mg weekly) to prandial insulin lispro as add-on therapy in patients inadequately controlled on insulin glargine alone:
| Eperzan + Insulin glargine (≥20 units per day) | Insulin lispro + Insulin glargine (≥20 units per day) | |
|---|---|---|
| ITTa (N) | N = 282 | N = 281 |
| HbA1c (%) | ||
| Baseline (mean) | 8.47 | 8.43 |
| Change at Week 26b | -0.8 | -0.6 |
| Difference from lispro insulinb (95% CI) | -0.2 (-0.3, 0.0) | |
| P value (noninferiority) | <0.0001 | |
| Proportion Achieving HbA1c <7% | 30% | 25% |
| Body Weight (kg) | ||
| Baseline (mean) | 93 | 92 |
| Change at Week 26b | -0.7 | +0.8 |
| Difference from lispro insulinb (95% CI) | -1.5 (-2.1, -1.0)c | |
a Intent to treat population - last observation carried forward
b Adjusted mean
c P <0.05 for treatment difference
In patients who completed the study (52 weeks), the adjusted mean change in baseline in HbA1c was -1.0% for Eperzan (N = 121) and -0.9% for insulin lispro (N = 141). The adjusted mean change in body weight from baseline at 52 weeks was -1.0 kg for Eperzan (N = 122) and +1.7 kg for insulin lispro (N = 141). These data exclude the use of antidiabetic therapies permitted after the efficacy assessment if glycaemic thresholds were exceeded.
Active-controlled study versus insulin glargine as add-on to metformin sulphonylurea
The efficacy of Eperzan was evaluated in a 3-year, randomised (2:1), open-label, insulin glargine-controlled noninferiority study (n = 735). On background therapy of metformin ≥1,500 mg daily (with or without sulphonylurea), Eperzan 30 mg SC weekly (with optional uptitration to 50 mg weekly) was compared to insulin glargine (started at 10 units and titrated weekly per prescribing information). The primary endpoint was change in HbA1c from baseline at 52 weeks. The starting total daily dose of insulin glargine ranged between 2 and 40 units (median daily dose of 10 units) and ranged between 3 and 230 units (median daily dose of 30 units) at Week 52. The median daily dose of insulin glargine used prior to hyperglycaemic rescue was 10 units (range 2 to 40 units) at study start and 30 units (range 3 to 230 units) at Week 52. At Week 156, 77% of patients treated with Eperzan were uptitrated to 50 mg SC weekly. The between-treatment difference in HbA1c of 0.1% (-0.04, 0.27) from baseline at 52 weeks for Eperzan and insulin glargine met the prespecified noninferiority margin (0.3%). A statistically significant decrease in body weight was observed for Eperzan compared to an increase in body weight for insulin glargine and the difference in weight change was statistically significant (see Table 7). Medicinal product no longer authorised
Table 7. Results at 52 weeks in an active-controlled study comparing Eperzan 30 mg SC weekly (with optional uptitration to 50 mg weekly) to insulin glargine (titrated weekly per prescribing information) as addon therapy in patients inadequately controlled on metformin sulfonylurea:
| Eperzan 30 mg/50 mg Weekly ± Metformin (with or without sulphonylurea) | Insulin glargine ± Metformin (with or without sulphonylurea) | |
|---|---|---|
| ITTa (N) | 496 | 239 |
| HbA1c (%) | ||
| Baseline (mean) | 8.28 | 8.36 |
| Change at Week 52b | -0.7 | -0.8 |
| Difference from insulin glargineb (95% CI) | 0.1 (-0.04, 0.3) | |
| P value (noninferiority) | <0.0086 | |
| Proportion Achieving HbA1c <7% | 32 | 33 |
| Body Weight (kg) | ||
| Baseline (mean) | 95 | 92 |
| Change at Week 52b | -1.1 | 1.6 |
| Difference from insulin glargineb (95% CI) | -2.6 (-3.2, -2.0)c | |
a Intent to treat population - last observation carried forward
b Adjusted mean
c P <0.05 for treatment difference
In patients who were treated for at least 104 weeks, the adjusted mean change in baseline in HbA1c was -0.97% for Eperzan (N = 182) and -1.04% for insulin glargine (N = 102). The adjusted mean change in body weight from baseline at 104 weeks was -2.6 kg for Eperzan (N = 184) and +1.4 kg for insulin glargine (N = 104). These data exclude the use of antidiabetic therapies permitted after the efficacy assessment if glycaemic thresholds were exceeded.
Active-controlled study versus liraglutide in combination with metformin, thiazolidinedione, or sulphonylurea (as monotherapy or dual therapy)
The efficacy of Eperzan was evaluated in a 32-week, randomised, open-label, liraglutide-controlled noninferiority study (N = 805). Eperzan 30 mg SC weekly (with uptitration to 50 mg weekly at Week 6) was compared to liraglutide 1.8 mg daily (titrated up from 0.6 mg at Week 1 and 1.2 mg at Week 1 to Week 2) in patients inadequately controlled on monotherapy or combination oral antidiabetic therapy (metformin, thiazolidinedione, or sulphonylureas). The primary endpoint was change in HbA1c from baseline at 32 weeks. Treatment with Eperzan did not meet the pre-specified noninferiority margin (0.3%) against liraglutide for HbA1c (see Table 8).
Table 8. Results of an active-controlled trial of Eperzan 30 mg SC weekly (with uptitration to 50 mg weekly) versus liraglutide 1.8 mg daily at 32 weeksa:
| Eperzan 30 mg/50 mg Weekly | Liraglutide 1.8 mg Daily | |
|---|---|---|
| Intent to Treat Population (N) | 402 | 403 |
| HbA1c (%) | ||
| Baseline (mean) | 8.2 | 8.2 |
| Change at Week 32b | -0.8 | -1.0 |
| Difference from liraglutideb (95% CI) | 0.2 (0.1, 0.3) | |
| P value (noninferiority) | p = 0.0846 | |
| Proportion Achieving HbA1c <7% | 42% | 52% |
| Body Weight (kg) | ||
| Baseline (mean) | 92 | 93 |
| Change at Week 32b | -0.6 | -2.2 |
| Difference from liraglutideb (95% CI) | 1.55 (1.05, 2.06)c | |
a Intent to treat population - last observation carried forward
b Adjusted mean
c P <0.05 for treatment difference
Active-controlled study versus sitagliptin in patients with type 2 diabetes and different degrees of renal impairment
The efficacy of Eperzan was evaluated in a randomised, double-blind, active-controlled 52-week study in 486 patients with mild, moderate, and severe renal impairment inadequately controlled on a current regimen of diet and exercise or other antidiabetic therapy. Eperzan 30 mg SC weekly (with uptitration to 50 mg weekly if needed) was compared to sitagliptin. Sitagliptin was dosed according to creatinine clearance estimated by Cockcroft-Gault formula (100 mg daily in mild, 50 mg daily in moderate, and 25 mg daily in severe renal impairment) The primary endpoint was change in HbA1c from baseline at 26 weeks. Treatment with Eperzan resulted in statistically significant reductions in HbA1c from baseline at Week 26 compared to sitagliptin. The model-adjusted mean decrease in HbA1c from baseline with Eperzan was -0.80 (n = 125), -0.83 (n = 98), and -1.08 (n = 19) in patients with mild (eGFR 60 to 89 ml/min/1.73m²), moderate (eGFR 30 to 59 ml/min/1.73m²), and severe (eGFR <30 ml/min/1.73m²) renal impairment, respectively (see Table 9).
Table 9. Results at 26 weeks in a study of Eperzan 30 mg SC weekly (with uptitration to 50 mg weekly if needed) versus sitagliptin (dosed according to renal function) in patients with different degrees of renal impairment:
| Eperzan 30 mg/50 mg Weekly | Sitagliptin | |
|---|---|---|
| Intent to Treat Population (N) | 246 (125 mild, 98 moderate, 19 severe)a | 240 (122 mild, 99 moderate, 15 severe)a |
| HbA1c (%) | ||
| Baseline (mean) | 8.1 | 8.2 |
| Change at Week 26b | -0.8 | -0.5 |
| Difference from sitagliptinb (95% CI) | -0.3 (-0.5, -0.2)c | |
| Proportion Achieving HbA1c <7% | 43% | 31% |
| Body Weight (kg) | ||
| Baseline (mean) | 84 | 83 |
| Change at Week 26b | -0.8 | -0.19 |
| Difference from sitagliptinb (95% CI) | -0.6 (-1.1, -0.1)c | |
a Intent to treat population - Last Observation Carried Forward (ITT-LOCF)
b Adjusted mean
c P <0.05 for treatment difference
Durability of glycaemic control
The durability of glycaemic control for Eperzan over time relative to other classes of type 2 antidiabetic agents and placebo is shown in Figure 1 as add-on to metformin.
Figure 1. Kaplan-Meier curve showing durability of glycaemic control (measured by time to rescue) for Eperzan, relative to two active controls (sitagliptin and glimepiride) and placebo:
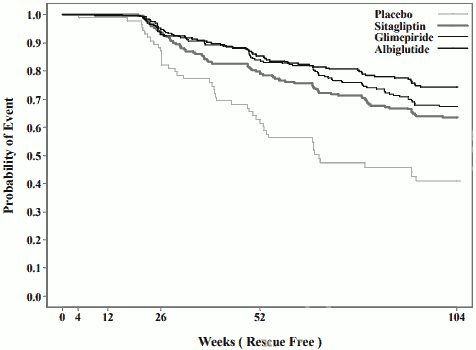
x axis; Weeks (Rescue free), y axis; Probability of event
Fasting plasma glucose
Treatment with Eperzan alone or in combination with one or two oral antidiabetic medicinal products resulted in a reduction in fasting plasma glucose from baseline as compared to placebo of 1.3 to 2.4 mmol/l. Most of this reduction was observed within the first two weeks of treatment.
Cardiovascular Evaluation:
A meta-analysis of 9 clinical studies (8 major effectiveness studies and 1 phase II dose finding study) of up to 3 years duration was conducted to assess the cardiovascular safety of Eperzan (N=2,524) compared to all comparators (N=2,583) within these trials. An endpoint called MACE+ (major adverse cardiac events plus) included hospitalisation for unstable angina in addition to the MACE endpoints (acute myocardial infarction, stroke, and CV death). The hazard ratio for Eperzan versus comparators for MACE+ was 1.0 (95% CI 0.68, 1.49). The incidence rates observed for first MACE+ were 1.2 and 1.1 events per 100 person-years for Eperzan versus all comparators, respectively.
Paediatric population
The European Medicines Agency has deferred the obligation to submit the results of studies with Eperzan in one or more subsets of the paediatric population in the treatment of type 2 diabetes mellitus (see section 4.2 for information on paediatric use).
5.2. Pharmacokinetic properties
Absorption
Following SC administration of a single 30 mg dose to subjects with type 2 diabetes, maximum concentrations were reached 3 to 5 days post dose with mean peak albiglutide concentration (Cmax) of 1.74 mcg/ml and mean area under the time-concentration curve (AUC) of 465 mcg.h/ml. The average weekly steady state concentrations following SC administration of 30 mg or 50 mg albiglutide estimated in the population PK analyses from phase III patient studies were approximately 2.6 mcg/ml and 4.4 mcg/ml, respectively. Steady-state exposures are achieved following 3-5 weeks of once-weekly administration. Exposures at the 30 mg and 50 mg dose levels were consistent with a dose-proportional increase. However, in healthy volunteers following 50 mg the steady state concentration was 7.39 µg/ml at day 36, thus higher than population PK analyses from phase III patient studies predicted. Similar exposure is achieved with SC administration of albiglutide in the abdomen, thigh, or upper arm.
Distribution
The mean estimate of apparent volume of distribution of albiglutide following SC administration is 11 litres. As albiglutide is an albumin fusion molecule, plasma protein binding has not been assessed.
Biotransformation
Albiglutide is a protein for which the expected metabolic pathway is degradation to small peptides and individual amino acids by ubiquitous proteolytic enzymes.
Elimination
The mean apparent clearance of albiglutide is 67 ml/h with an elimination half-life of approximately 5 days based on estimations from the population PK analyses from phase III patient studies and measured values.
Special populations
Patients with renal impairment
In a population pharmacokinetic analysis including a phase III trial in patients with mild, moderate and severe renal impairment, exposures were increased by approximately 30 to 40% in severe renal impairment compared to those observed in type 2 diabetic patients with normal renal function. In addition, a clinical pharmacology study showed a similar increased exposure for patients with moderate or severe renal impairment or those on haemodialysis relative to patients without renal impairment. These differences were not considered clinically relevant (see section 4.2).
Patients with hepatic insufficiency
No clinical studies were conducted to examine the effects of hepatic impairment on the pharmacokinetics of Eperzan. Therapeutic proteins such as albiglutide are catabolised by widely distributed proteolytic enzymes, which are not restricted to hepatic tissue; therefore, changes in hepatic function are unlikely to have any effect on the elimination of Eperzan (see section 4.2).
Gender
Based on the results of population pharmacokinetic analyses, there is no clinically relevant effect of gender on clearance.
Race and ethnicity
Based on the results of population pharmacokinetic analyses that included Caucasian, African American/African, Asian and Hispanic/Non-Hispanic patients, race and ethnicity had no clinically meaningful effect on the pharmacokinetics of Eperzan clearance.
Japanese patients showed approximately 30 to 40% higher exposures than Caucasians, likely attributable to lower body weight. This effect was not considered clinically relevant.
Elderly patients (≥65 years)
Age had no clinically relevant effect on the pharmacokinetics of albiglutide based on a population pharmacokinetic analysis of subjects aged 24-83 years (see section 4.2).
Body weight
Body weight has no clinically relevant effect on albiglutide AUC over the range 44 to 158 kg. A 20% increase in body weight resulted in an approximate 18.5% increase in clearance.
Paediatric population
No pharmacokinetic data are available in paediatric patients.
5.3. Preclinical safety data
Non-clinical data reveal no special hazards for humans based on studies of safety pharmacology or repeatdose toxicity. As albiglutide is a recombinant protein, no genotoxicity studies have been conducted.
In a 52-week monkey study, there was a small increase in pancreas tissue weight at 50 mg/kg/week (75 times clinical exposure based on AUC) associated with acinar cell hypertrophy. A small increase in islet cell number was also observed. The pancreas changes were not associated with histomorphologic abnormalities or evidence of increased proliferation.
No carcinogenicity studies have been performed with albiglutide due to immunogenicity in rodents. Thyroid C-cell tumours were observed in 2 year rodent carcinogenicity studies with other GLP-1 receptor agonists. Increased serum calcitonin levels have been associated with the thyroid C-cell hyperplasia and tumours observed in rodent studies with these other agents. Albiglutide also produced dose-dependent increases in serum calcitonin levels in a 21-day study in mice, suggesting that thyroid tumours in rodents are a theoretical possibility for albiglutide as well. There were no albiglutide related findings in thyroids of monkeys given up to 50 mg/kg/week for up to 52 weeks (75 times clinical exposure based on AUC). The clinical relevance of the observed thyroid C-cell tumours in rodents is unknown.
In reproductive toxicology studies with albiglutide in mice, there were no effects on mating or fertility at doses up to 50 mg/kg/day (at low multiple of clinical exposure). Reductions in oestrous cycles were observed at 50 mg/kg/day, a dose associated with maternal toxicity (body weight loss and reduced food consumption). Effects on embryo-foetal development (embryo-foetal lethality and skeletal variations) were observed at 50 mg/kg/day (at low multiple of clinical exposure). Offspring of mice dosed with 50 mg/kg/day during organogenesis had reduced weight during the pre-weaning period (which recovered after weaning), dehydration and coldness, and a delay in balanopreputial separation. No effects were seen at 5 mg/kg/day (at exposures similar to clinical exposure).
In pre- and postnatal development studies in mice administered albiglutide during pregnancy or while nursing, reduced pre-weaning body weight of F1 offspring was observed at ≥1 mg/kg/day (at exposures below clinical exposure). Reduced F1 body weight reversed post-weaning with the exception of F1 females from dams treated perinatally (end of gestation to 10 days postpartum) at ≥5 mg/kg/day with no other effects on development. Trace levels of albiglutide were detected in plasma of offspring. It is unknown whether the reduced offspring body weight was caused by a direct albiglutide effect on the offspring or secondary to effects on the dam.
Increased mortality and morbidity were seen at all doses (≥1 mg/kg/day) in lactating females in mouse preand postnatal development studies. Mortalities have not been observed in previous toxicology studies in nonlactating or non-pregnant mice, nor in pregnant mice. These findings are consistent with lactational ileus syndrome which has been previously reported in mice. Since the relative stress of lactation energy demands is much lower in humans than mice and humans have large energy reserves, the mortalities observed in lactating mice are considered not relevant to humans.
© All content on this website, including data entry, data processing, decision support tools, "RxReasoner" logo and graphics, is the intellectual property of RxReasoner and is protected by copyright laws. Unauthorized reproduction or distribution of any part of this content without explicit written permission from RxReasoner is strictly prohibited. Any third-party content used on this site is acknowledged and utilized under fair use principles.