FOUNDAYO Film-coated tablet Ref.[116652] Active ingredients: Orforglipron
Source: FDA, National Drug Code (US) Revision Year: 2026
12.1. Mechanism of Action
FOUNDAYO is a GLP-1 receptor agonist that binds to and activates the human GLP-1 receptor.
GLP-1 is a physiological regulator of appetite and caloric intake. GLP-1 receptors are present in brain regions that regulate appetite. In animal studies, orforglipron distributed to and activated neurons in brain regions that regulate appetite and food intake.
12.2. Pharmacodynamics
FOUNDAYO reduces body weight, with greater fat mass loss than lean mass loss. FOUNDAYO decreases food intake. This effect is likely mediated by decreased appetite.
FOUNDAYO delays gastric emptying. The delay is largest after the first dose and diminishes over time.
Cardiac Electrophysiology
At 1.4 times the mean of maximum concentrations provided by the maximum recommended FOUNDAYO dose (17.2 mg) once daily, clinically significant QTc interval prolongation was not observed.
12.3. Pharmacokinetics
The pharmacokinetics of orforglipron is similar between healthy subjects and patients with overweight (BMI ≥27 kg/m²) or obesity. Steady state exposure is achieved after approximately 1 week of once daily administration.
The data below refer to FOUNDAYO dosages [see Dosage and Administration (2.1)]. Except in the food effect study, data were generated with the corresponding orforglipron investigational formulation [see Adverse Reactions (6.1)].
Absorption
Maximum concentration of orforglipron is reached 4 to 8 hours post dose. Orforglipron tablet exposure increases in a dose-proportional manner. The geometric mean absolute bioavailability of orforglipron was 77% after a 0.8 mg dose.
Effect of food
No clinically relevant food effect on orforglipron exposure was observed. Following multiple doses of an investigational 37.5 mg orforglipron tablet, the AUC(0-24h) decreased by 19%, and Cmax decreased by 26% with food compared to fasted state. The tmax and t1/2 were unchanged.
Distribution
The mean steady-state volume of distribution of orforglipron is approximately 285 L, following intravenous dosing in healthy subjects. Orforglipron plasma protein binding is greater than 99%. FOUNDAYO is only for oral use.
Elimination
The mean systemic clearance of orforglipron is 7.15 L/hour. The elimination half-life is approximately 29 to 49 hours after an oral dose.
Metabolism
Orforglipron is metabolized primarily via hepatic CYP3A4 to several oxidative metabolites. These oxidative metabolites are excreted into the intestinal lumen.
Excretion
After administration of a single oral dose of 2.5 mg orforglipron, 87% of the dose was recovered in feces (all metabolites) and less than 1% of the dose was recovered in urine.
Special Populations
The intrinsic factors of age (18 to 92 years), sex, race (White, Asian, Black or African American, American Indian, Multiracial, or Hawaiian Pacific Islander), ethnicity (Hispanic, Non-Hispanic), body weight (56.4 to 227 kg), and renal impairment (eGFR 27.8 to 156 mL/min/1.73 m 2) do not have a clinically relevant effect on the pharmacokinetics of orforglipron.
Patients with Hepatic Impairment
The pharmacokinetics of orforglipron after a single oral 0.8 mg dose was evaluated in patients with mild, moderate, and severe hepatic impairment (Child-Pugh Class A, B, and C, respectively) and in subjects with normal hepatic function. Orforglipron exposure was similar in patients with mild hepatic impairment and normal hepatic function. Orforglipron AUC(0-∞) increased by 1.7-fold and 4.6-fold in patients with moderate and severe hepatic impairment, respectively, compared to subjects with normal hepatic function. Cmax in patients with moderate and severe hepatic impairment was similar to Cmax in subjects with normal hepatic function [see Use in Specific Populations (8.6)].
Patients with Renal Impairment
Renal impairment does not impact the pharmacokinetics of orforglipron. The pharmacokinetics of orforglipron after a single oral 0.8 mg dose were evaluated in patients with severe renal impairment and ESRD compared with subjects who had normal renal function. Data from clinical trials have also shown that renal impairment in patients with overweight or obesity does not impact the pharmacokinetics of orforglipron [see Use in Specific Populations (8.7)].
Drug Interaction Studies
Clinical Studies and Model-Informed Approaches
Effects of Other Drugs on FOUNDAYO:
Table 4 outlines the results of definitive clinical trials and physiologically based pharmacokinetic (PBPK) simulations assessing the effect of other drugs on orforglipron pharmacokinetics. Concomitant use of strong CYP3A4 inhibitors significantly increased exposure of orforglipron while concomitant use of moderate or strong CYP3A4 inducers led to reductions in orforglipron exposure [see Dose and Administration (2.2), Drug Interactions (7.1)].
Table 4. Potential for Other Drugs to Affect FOUNDAYO:
| Concomitant Drug Category | Concomitant Drug (Dose) | Change in Orforglipron | |
| AUC | Cmax | ||
| Strong CYP3A4 inhibitors | Clarithromycin (500 mg twice daily) | ↑3.5-fold | ↑1.9-fold |
| Moderate CYP3A4 inhibitors | Verapamila (80 mg three times daily) | ↑2-fold | ↑1.6-fold |
| Strong CYP3A4 inducers | Carbamazepine (300 mg twice daily) | ↓82% | ↓55% |
| Moderate CYP3A4 inducers | Efavirenza (600 mg once daily) | ↓61% | ↓33% |
| Weak CYP3A4 inducers | Modafinila (200 mg once daily) | ↓16% | ↓7% |
| OATP1B inhibitors | Cyclosporine (200 mg twice daily) | ↑2.6-fold | ↑1.3-fold |
| P-gp inhibitors | Quinidine (200 mg twice daily) | ↓12% | ↓26% |
| Acid reducing agents | Esomeprazole (40 mg once daily) | No effect | No effect |
a Simulated using physiologically based pharmacokinetic modeling.
Effects of FOUNDAYO on Other Drug:
Table 5 outlines the results of clinical assessments that evaluated the effect of orforglipron on other drugs. Concomitant use of orforglipron and simvastatin led to significant increases in the active metabolite simvastatin acid whether orforglipron was co-administered or dosing was staggered by 2 hours [see Drug Interactions (7.2)]. No clinically relevant changes were observed for orforglipron when used with rosuvastatin or atorvastatin.
Table 5. Potential for FOUNDAYO to Affect Other Drugs:
| Concomitant Drug Category | Concomitant Drug (Dose) | Orforglipron Dosage | Change in Concomitant Drug | |
| AUC | Cmax | |||
| Statin | Simvastatin (prodrug) (20 mg) | 17.2 mg once daily | up to ↓16% | up to ↓27% |
| Simvastatin acid (active metabolite) | 17.2 mg once daily | ↑2- to 2.5-fold | ↑2.3- to 2.5-fold | |
| Atorvastatin (40 mg) | 14.5 mg once daily | ↑1.5-fold | ↑0.9-fold | |
| BCRP substrate | Rosuvastatin (20 mg) | 17.2 mg once daily | ↑1.7-fold | ↑1.3-fold |
| CYP3A4 substrates | Midazolam (200 mcg) | 17.2 mg once daily | ↑1.1-fold | No effect |
| P-gp substrates | Digoxin (0.25 mg) | 17.2 mg once daily | ↑1.2-fold | ↑1.2-fold |
| OATP1B substrates | Endogenous OATP1B biomarker coproporphyrin-1 | up to 14.5 mg once daily | No effect | No effect |
Potential Drug Interactions due to Gastric Emptying Delay:
Orforglipron delays gastric emptying and has the potential to affect the rate of absorption of other concomitantly administered oral drugs. The gastric emptying delay effect of orforglipron on acetaminophen Cmax was largest after the first dose of FOUNDAYO 0.8 mg with acetaminophen Cmax decreased by 28%. The effect diminished after repeated dosing of FOUNDAYO 17.2 mg.
In Vitro Assessments of Drug Interactions
CYP Enzymes: In in vitro studies, orforglipron did not inhibit or induce CYP1A2, CYP2B6, CYP2C8, CYP2C9, CYP2C19, or CYP2D6. Orforglipron is a substrate of CYP3A4 and CYP2J2, and is not a substrate of CYP1A2, CYP2B6, CYP2C8, CYP2C19, CYP2D6, and CYP3A5.
Transporter Systems: Orforglipron did not inhibit OATP1B1, OATP1B3, OATP2B1, OAT1, OAT3, OCT1, OCT2, MATE1, or MATE2K. Orforglipron is a substrate of P-gp, OATP1B1 and OATP1B3, and is not a substrate of BCRP or OCT1.
13.1. Carcinogenesis, Mutagenesis, Impairment of Fertility
Orforglipron is not pharmacologically active in rats or mice. In a 2-year rat carcinogenicity study, orforglipron was non-carcinogenic at oral daily doses of 5, 30, and 200 mg/kg/day resulting in exposures approximately 3, 9, and 26 times the clinical exposure at the MRHD, respectively, based on AUC. In a 26-week study in Tg.RasH2 transgenic mice, orforglipron was non-carcinogenic at oral daily doses of 5, 30, and 200 mg/kg/day. For other GLP-1 receptor agonists that are pharmacologically active in rats, thyroid C-cell hyperplasia, and thyroid C-cell adenoma and carcinoma have been observed at clinically relevant exposures and are considered an on-target class effect. Orforglipron would be expected to have the same on-target class effect if it was pharmacologically active in rats. The human relevance of these findings is unknown.
Orforglipron was not mutagenic or clastogenic in a bacterial reverse mutation test, an in vitro micronucleus test in human lymphoblastoid cells, or in an in vivo bone marrow micronucleus study in rats.
There were no effects on male and female fertility in rats orally administered orforglipron up to 200 mg/kg/day (19 times and 36 times the clinical exposure at the MRHD, respectively, based on AUC).
14. Clinical Studies
Overview of Trials 1 and 2
The effectiveness of FOUNDAYO has been established in combination with a reduced-calorie diet and increased physical activity to reduce excess body weight and maintain weight reduction long term in adults with obesity or adults with overweight in the presence of at least one weight-related comorbid condition based on adequate and well-controlled trials of an investigational orforglipron formulation (Trials 1 and 2), referred to in this section as FOUNDAYO. This section of labeling presents efficacy data from administration of the investigational orforglipron formulation shown as equivalent dosages of once daily FOUNDAYO [see Dosage and Administration (2.1)].
FOUNDAYO was studied in two randomized, double-blind, placebo-controlled trials (Trials 1 and 2) in adults aged 18 years and older. In these trials, all patients received standard lifestyle intervention which included instruction on reduced-calorie diet and physical activity counseling (recommended minimum of 150 minutes/week) that began with the first dose of trial medication or placebo and continued throughout the trials.
In Trial 1 patients were randomized in a 3:3:3:4 ratio to FOUNDAYO 5.5 mg once daily, 9 mg once daily, 17.2 mg once daily, or placebo once daily. In Trial 2 patients were randomized in a 1:1:1:2 ratio to FOUNDAYO 5.5 mg once daily, 9 mg once daily, 17.2 mg once daily, or placebo once daily. In Trials 1 and 2, dosages were titrated according to the dosage escalation described in Section 2.1. In these trials, the primary efficacy parameter was mean percent change in body weight after 72 weeks of treatment.
Trial 1 (NCT05869903) was a 72-week trial that enrolled 3,127 adult patients with obesity (BMI ≥30 kg/m² ), or with overweight (BMI 27 to <30 kg/m² ) and at least one weight-related comorbid condition, such as dyslipidemia, hypertension, obstructive sleep apnea, or cardiovascular disease; patients with type 2 diabetes were excluded. At baseline, mean age was 45 years (range 18 to 88 years), 64% were female, 56% were White, 28% were Asian, 9% were Black or African American, and 0.4% were American Indian/Alaska Native. A total of 38% were Hispanic or Latino ethnicity. Mean baseline body weight was 103.2 kg and mean BMI was 37 kg/m² . At baseline, 40% of patients had hypertension, 39% had dyslipidemia, 11% had obstructive sleep apnea, 1.4% had coronary artery disease, and 1.5% had cerebrovascular disease.
Trial 2 (NCT05872620) was a 72-week trial that enrolled 1,613 adult patients with BMI ≥27 kg/m² and type 2 diabetes. Patients included in the trial had baseline HbA1c 7% to 10% and were treated with either diet and exercise alone, or any oral anti-hyperglycemic agent except dipeptidyl peptidase-4 (DPP-4) inhibitors or GLP-1 receptor agonists. Patients who were taking injectable glucose-lowering agents, including insulin, GLP-1 receptor agonists, or pramlintide were also excluded. At baseline, mean age was 57 years (range 20 to 92 years), 47% were female, 71% were White, 17% were Asian, 7% were Black or African American, and 0.3% were American Indian/Alaska Native. A total of 30% were Hispanic or Latino ethnicity. Mean baseline body weight was 101.4 kg, mean BMI was 35.6 kg/m² , and mean HbA1c was 8%. At baseline, 74% of patients had hypertension, 71% had dyslipidemia, 13% had obstructive sleep apnea, 7% had coronary artery disease, 5% had cerebrovascular disease, and 11% had diabetic retinopathy.
Results for Trials 1 and 2
The proportions of patients who discontinued trial drug in Trial 1 were 22%, 22%, and 24% for the 5.5 mg, 9 mg, and 17.2 mg once daily FOUNDAYO-treated groups, respectively, and 30% for the placebo-treated group. The proportion of patients who discontinued trial drug in Trial 2 were 19%, 22%, and 20% for the 5.5 mg, 9 mg, and 17.2 mg once daily FOUNDAYO-treated groups, respectively, and 20% for the placebo-treated group.
For Trials 1 and 2, the primary efficacy parameter was mean percent change in body weight from baseline to Week 72. After 72 weeks of treatment in Trials 1 and 2, there was a statistically significant reduction in body weight in the FOUNDAYO-treated groups compared with the placebo groups (see Table 6). A reduction in body weight was observed with FOUNDAYO regardless of age, sex, race, ethnicity, baseline BMI, and glycemic status.
Table 6. Changes from Baseline in Body Weight at Week 72 in Trials 1 and 2 in Patients with Obesity or Overweight with ≥1 Weight-related Comorbid Condition:
| Trial 1 (without diabetes) | Trial 2 (with type 2 diabetes) | |||||||
| Intent-to-Treat (ITT) Populationa | Placebo once daily N = 949 | FOUNDAYO 5.5 mg once daily N = 723 | FOUNDAYO 9 mg once daily N = 725 | FOUNDAYO 17.2 mg once daily N = 730 | Placebo once daily N = 630 | FOUNDAYO 5.5 mg once daily N = 329 | FOUNDAYO 9 mg once daily N = 332 | FOUNDAYO 17.2 mg once daily N = 322 |
| Body Weight | ||||||||
| Baseline mean (kg) | 103.9 | 103.2 | 102.2 | 103.1 | 101.2 | 102.3 | 102.7 | 99.8 |
| % Change from baselineb | -2.1 | -7.4 | -8.3 | -11.1 | -2.5 | -5.1 | -7 | -9.6 |
| % difference from placebo (95% CI)b | -5.3 (-6.1, -4.4)c | -6.2 (-7.1, -5.3)c | -9 (-10, -8.1)c | -2.6 (-3.5, -1.6)c | -4.5 (-5.4, -3.6)c | -7.1 (-8.1, -6.1)c | ||
| % of patients who lost ≥5% body weight | 26.8 | 59.6 | 63.1 | 71.5 | 26.8 | 47.4 | 54.7 | 67 |
| % difference from placebo (95% CI)d | 32.7 (27.9, 37.6)c | 36.3 (31.5, 41.1)c | 44.7 (40, 49.3)c | 20.6 (13.9, 27.3)c | 27.9 (21.3, 34.5)c | 40.2 (33.8, 46.6)c | ||
| % of patients who lost ≥10% body weight | 13 | 32.5 | 39.8 | 54.5 | 9.2 | 22.5 | 31.1 | 45.6 |
| % difference from placebo (95% CI)d | 19.4 (15.1, 23.7)c | 26.8 (22.4, 31.1)c | 41.4 (37, 45.9)c | 13.3 (8.1, 18.5)c | 21.9 (16.3, 27.5)c | 36.4 (30.5, 42.3)c | ||
| % of patients who lost ≥15% body weight | 6 | 14.3 | 20.1 | 35.9 | 3.1 | 6.7 | 14.4 | 25.9 |
| % difference from placebo (95% CI)d | 8.3 (5.2, 11.4)c | 14.1 (10.7, 17.6)c | 29.8 (25.9, 33.7)c | 3.6 (0.4, 6.8)e | 11.3 (7.3, 15.3)c | 22.8 (17.8, 27.8)c | ||
| % of patients who lost ≥20% body weight | 2.9 | 5.9 | 8.9 | 18.4 | 0.7 | 2.6 | 4.4 | 10.8 |
| % difference from placebo (95% CI)d | 3 (0.9, 5.2)e | 6 (3.5, 8.4)c | 15.5 (12.4, 18.6)c | 1.8 (-0.2, 3.8)e | 3.7 (1.4, 6)e | 10.1 (6.6, 13.5)e | ||
Abbreviations: ANCOVA = analysis of covariance; CI = confidence interval; N = number of patients randomly assigned to trial drug.
Note: Baseline mean is calculated using all randomized patients.
a The intent-to-treat population consists of all randomized patients. For Trial 1 at Week 72, the body weight endpoint was missing for 24%, 16%, 14%, and 15% of patients randomized to placebo, FOUNDAYO 5.5 mg once daily, 9 mg once daily and 17.2 mg once daily, respectively. For Trial 2 at Week 72, the body weight endpoint was missing for 13%, 13%, 10%, and 7% of patients randomized to placebo, FOUNDAYO 5.5 mg once daily, 9 mg once daily and 17.2 mg once daily, respectively. Missing data were imputed from retrieved patients of the same randomized treatment group when the missingness was possibly related to trial treatment; otherwise, missing data were imputed using observed data from the same randomized treatment group (primary modified multiple imputation).
b Unconditional average treatment effect estimated using ANCOVA adjusted for baseline value and other stratification factors.
c p<0.001 (unadjusted 2-sided) compared to placebo for superiority; controlled for multiplicity.
d Unconditional average treatment effect estimated using logistic regression adjusted for baseline value and other stratification factors.
e Not controlled for multiplicity.
The time courses of weight reduction from baseline with FOUNDAYO and placebo through Week 72 are depicted in Figure 1 for Trial 1 and Figure 2 for Trial 2.
Figure 1: Change Over Time in Body Weight in Trial 1 in Patients with Obesity or Overweight with ≥1 Weight-related Comorbid Condition (without Type 2 Diabetes)
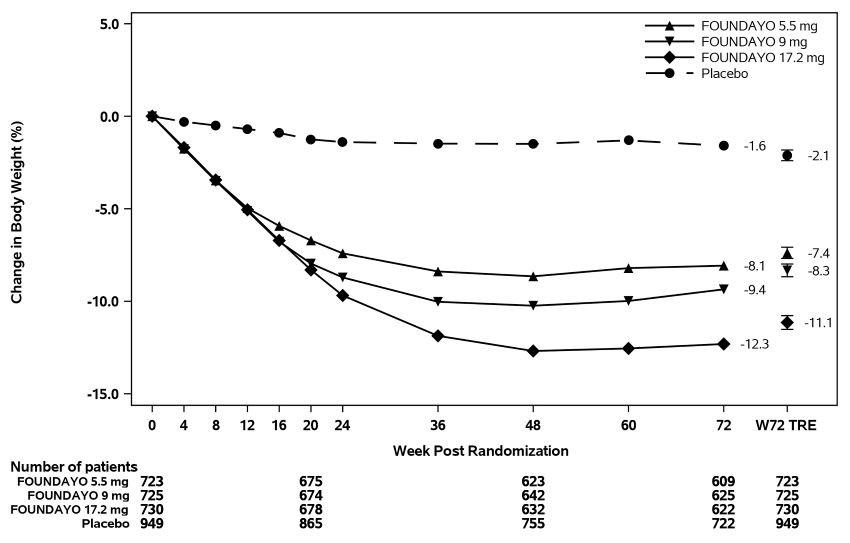
Abbreviation: W72 TRE = treatment effect under treatment regimen estimand at Week 72.
Displayed results are from randomized patients and treatment regimen estimand data points set. (1) Observed mean value from Week 0 to Week 72, and (2) model-based estimate ± standard error at Week 72 using primary modified multiple imputation.
Figure 2. Change Over Time in Body Weight in Trial 2 in Patients with Obesity or Overweight and Type 2 Diabetes:
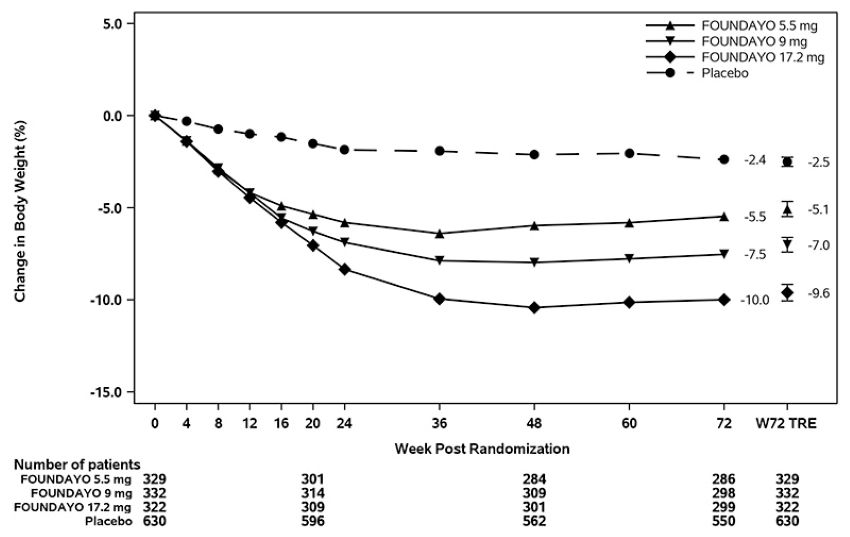
Abbreviation: W72 TRE = treatment effect under treatment regimen estimand at Week 72.
Displayed results are from randomized participants and treatment regimen estimand data points set. (1) Observed mean value from Week 0 to Week 72, and (2) model-based estimate ± standard error at Week 72 using primary modified multiple imputation.
The cumulative frequency distributions of percentage change in body weight are shown in Figure 3 for Trial 1 and Figure 4 for Trial 2. One way to interpret this figure is to select a change in body weight of interest on the horizontal axis and note the corresponding proportions of patients (vertical axis) in each treatment group who achieved at least that degree of weight reduction. For example, the vertical line arising from -10% in Figure 3 intersects the FOUNDAYO 17.2 mg once daily and placebo curves at approximately 55% and 13%, respectively, which correspond to the values shown in Table 6.
Figure 3. Changes in Body Weight (%) from Baseline to Week 72 in Trial 1 in Patients with Obesity or Overweight with ≥1 Weight-related Comorbid Condition (without Type 2 Diabetes):
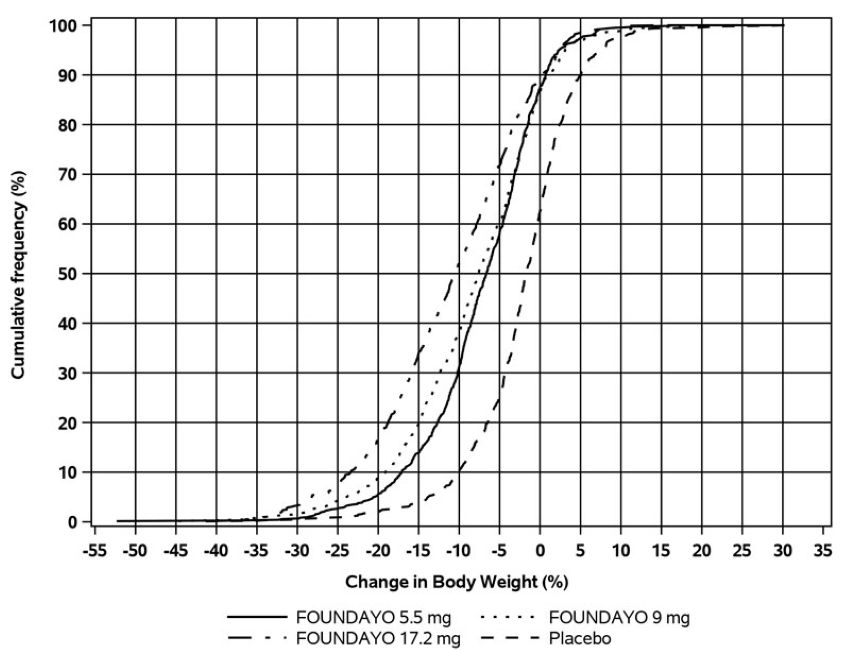
Note: Based on average percent weight change of each randomized patient within each specific treatment group from 100 imputed datasets including observed data and imputed data using the primary modified multiple imputation method for missing values.
Figure 4. Changes in Body Weight (%) from Baseline to Week 72 in Trial 2 in Patients with Obesity or Overweight and Type 2 Diabetes:
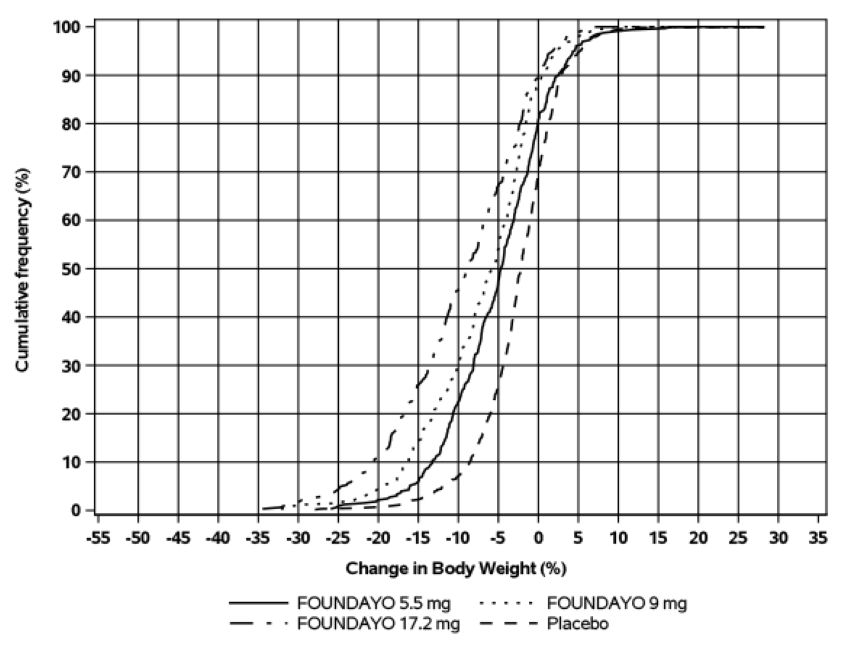
Based on average percent weight change of each randomized patient within each specific treatment group from 100 imputed datasets including observed data and imputed data using the primary modified multiple imputation method for missing values.
Effect of FOUNDAYO on Anthropometry and Cardiometabolic Parameters in Trials 1 and 2
Changes in waist circumference and cardiometabolic parameters with FOUNDAYO are shown in Table 7 for Trial 1 and Trial 2.
Table 7. Changes from Baseline Anthropometry and Cardiometabolic Parameters at Week 72 in Trials 1 and 2 in Patients with Obesity or Overweight with ≥1 Weight-related Comorbid Condition:
| Trial 1 (without diabetes) | Trial 2 (with type 2 diabetes) | |||||||
| Intent-to-Treat (ITT) Populationa | Placebo once daily N = 949 | FOUNDAYO 5.5 mg once daily N = 723 | FOUNDAYO 9 mg once daily N = 725 | FOUNDAYO 17.2 mg once daily N = 730 | Placebo once daily N = 630 | FOUNDAYO 5.5 mg once daily N = 329 | FOUNDAYO 9 mg once daily N = 332 | FOUNDAYO 17.2 mg once daily N = 322 |
| Waist Circumference (cm) | ||||||||
| Baseline mean | 112.8 | 112.2 | 112 | 112.4 | 115 | 116.8 | 116.2 | 114.7 |
| Change from baselineb | -3.1 | -7 | -8.2 | -10 | -2.8 | -5.4 | -6.3 | -8.3 |
| Difference from placebo (95% CI)b | -3.9 (-4.7, -3.1)c | -5.1 (-5.9, -4.2)c | -6.9 (-7.8, -6)c | -2.6 (-3.5, -1.6)d | -3.5 (-4.4, -2.6)d | -5.5 (-6.5, -4.6)c | ||
| Systolic Blood Pressure (mm Hg) | ||||||||
| Baseline mean | 125.8 | 125.4 | 125.1 | 125.8 | 130.6 | 131.3 | 132.1 | 132.5 |
| Change from baselineb | -1.4 | -5.7 | -5.1 | -6.4 | -1.5 | -4 | -4.2 | -4.6 |
| Difference from placebo (95% CI)b | -4.2 (-5.4, -3)d | -3.7 (-4.8, -2.5)d | -4.9 (-6.1, -3.8)d | -2.5 (-4.1, -0.8)d | -2.7 (-4.4, -1)d | -3 (-4.8, -1.2)d | ||
| Diastolic Blood Pressure (mm Hg) | ||||||||
| Baseline mean | 81.8 | 81 | 81.2 | 80.9 | 81 | 81.6 | 82.1 | 81.8 |
| Change from baselineb | -1.4 | -2.4 | -2.3 | -2.7 | -1.3 | -1.4 | -1.4 | -1.8 |
| Difference from placebo (95% CI)b | -0.9 (-1.7, -0.1)d | -0.8 (-1.7, 0)d | -1.2 (-2, -0.4)d | -0.1 (-1.2, 0.9)d | -0.1 (-1.2, 0.9)d | -0.6 (-1.6, 0.5)d | ||
| Pulse Rate (beats per minute) | ||||||||
| Baseline mean | 73.7 | 73 | 73 | 73.5 | 74.2 | 75.9 | 73.7 | 74.6 |
| Change from baselineb | 0.6 | 3.6 | 3.9 | 4.6 | 0.4 | 2.8 | 3.9 | 3.6 |
| Difference from placebo (95% CI)b | 3.1 (2.2, 4)d | 3.4 (2.5, 4.2)d | 4.1 (3.1, 5)d | 2.4 (1.3, 3.6)d | 3.5 (2.4, 4.6)d | 3.2 (2, 4.4)d | ||
| HbA1c (%) | ||||||||
| Baseline mean | 5.6 | 5.6 | 5.6 | 5.6 | 8 | 8 | 8.1 | 8.1 |
| Change from baselineb | -0.1 | -0.3 | -0.3 | -0.3 | -0.4 | -1.2 | -1.4 | -1.7 |
| Difference from placebo (95% CI)b | -0.2 (-0.2, -0.2)d | -0.2 (-0.2, -0.2)d | -0.3 (-0.3, -0.2)d | -0.8 (-1, -0.6)c | -1 (-1.2, -0.8)c | -1.2 (-1.4, -1.1)c | ||
| Total Cholesterol (mg/dL) | ||||||||
| Baseline meane | 192.6 | 192.5 | 191.2 | 192.2 | 167.6 | 168 | 167.4 | 167.6 |
| Percent change from baselineb | -1.9 | -3.4 | -4.5 | -4.3 | -2.2 | -1.5 | -2 | -4.9 |
| Relative difference from placebo (95% CI)b | -1.6 (-3.1, 0)d,f | -2.7 (-4.2, -1.1)d,f | -2.5 (-4, -0.9)d,f | 0.7 (-2.2, 3.6)d,f | 0.1 (-2.6, 2.9)d,f | -2.7 (-5.3, -0.1)d,f | ||
| Non-HDL Cholesterol (mg/dL) | ||||||||
| Baseline meane | 142.3 | 141.9 | 139.8 | 142.5 | 122.2 | 120.7 | 121.8 | 121 |
| Percent change from baselineb | -2 | -5.4 | -7 | -7.7 | -3 | -4.3 | -4.7 | -9.7 |
| Relative difference from placebo (95% CI)b | -3.5 (-5.5, -1.4)d,f | -5.1 (-7, -3.1)d,f | -5.8 (-7.8, -3.8)d,f | -1.3 (-5.1, 2.7)d,f | -1.7 (-5.4, 2.1)d,f | -6.9 (-10.2, -3.4)d,f | ||
| LDL Cholesterol (mg/dL) | ||||||||
| Baseline meane | 114.4 | 115 | 113.3 | 114.6 | 84.7 | 84.3 | 84.1 | 85.3 |
| Percent change from baselineb | -1.6 | -3.8 | -5.5 | -4.9 | -3.1 | -0.2 | -0.7 | -5.5 |
| Relative difference from placebo (95% CI)b | -2.2 (-4.5, 0.1)d,f | -4 (-6.2, -1.7)d,f | -3.3 (-5.5, -1)d,f | 3.1 (-2.2, 8.6)d,f | 2.5 (-2.1, 7.4)d,f | -2.4 (-6.8, 2.2)d,f | ||
| HDL Cholesterol (mg/dL) | ||||||||
| Baseline meane | 47.8 | 48.1 | 48.6 | 47 | 42 | 43.5 | 42.8 | 43.1 |
| Percent change from baselineb | -1 | 2.1 | 3.1 | 4.5 | 0.8 | 5.8 | 5.3 | 8 |
| Relative difference from placebo (95% CI)b | 3.1 (1.4, 4.8)d,f | 4.1 (2.3, 5.8)d,f | 5.5 (3.8, 7.2)d,f | 5 (2.5, 7.6)d,f | 4.4 (2.1, 6.8)d,f | 7.2 (4.7, 9.7)d,f | ||
| Triglycerides (mg/dL) | ||||||||
| Baseline meane | 125.3 | 121.1 | 119.2 | 125.6 | 162.4 | 157.8 | 164.4 | 157.2 |
| Percent change from baselineb | -4 | -10.4 | -13.1 | -20 | -4.1 | -13.3 | -14.7 | -19.4 |
| Relative difference from placebo (95% CI)b | -6.7 (-9.9, -3.3)d,f | -9.4 (-12.6, -6.1)d,f | -16.6 (-19.5, -13.6)d,f | -9.6 (-14.5, -4.4)d,f | -11 (-15.6, -6.2)d,f | -15.9 (-20.3, -11.3)d,f | ||
Abbreviations: ANCOVA = analysis of covariance; CI = confidence interval; N = number of patients randomly assigned to trial drug.
Note: Baseline mean is calculated using all randomized patients. For patients with missing baseline values, imputed values are used.
a The intent-to-treat population consists of all randomized patients. Missing data were imputed from retrieved patients of the same randomized treatment group when the missingness was possibly related to trial treatment; otherwise, missing data were imputed using observed data from the same randomized treatment group (primary modified multiple imputation).
b Unconditional average treatment effect estimated using ANCOVA adjusted for baseline value and other stratification factors.
c p<0.001 (unadjusted 2-sided) compared to placebo for superiority; controlled for multiplicity.
d Not controlled for multiplicity.
e Baseline value is the geometric mean.
f Analyzed using log-transformed data.
© All content on this website, including data entry, data processing, decision support tools, "RxReasoner" logo and graphics, is the intellectual property of RxReasoner and is protected by copyright laws. Unauthorized reproduction or distribution of any part of this content without explicit written permission from RxReasoner is strictly prohibited. Any third-party content used on this site is acknowledged and utilized under fair use principles.