GAZYVARO Concentrate for solution for infusion Ref.[8946] Active ingredients: Obinutuzumab
Source: European Medicines Agency (EU) Revision Year: 2026 Publisher: Roche Registration GmbH, Emil-Barell-Strasse 1, 79639, Grenzach-Wyhlen, Germany
Pharmacodynamic properties
Pharmacotherapeutic group: Antineoplastic agents, monoclonal antibodies
ATC code: L01FA03
Mechanism of action
Obinutuzumab is a recombinant monoclonal humanised and glycoengineered Type II anti-CD20 antibody of the IgG1 isotype. It specifically targets the extracellular loop of the CD20 transmembrane antigen on the surface of non-malignant and malignant pre-B and mature B-lymphocytes, but not on haematopoietic stem cells, pro-B-cells, normal plasma cells or other normal tissue. Glycoengineering of the Fc part of obinutuzumab results in higher affinity for FcɣRIII receptors on immune effector cells such as natural killer (NK) cells, macrophages and monocytes as compared to non-glycoengineered antibodies.
In nonclinical studies, obinutuzumab induces direct cell death and mediates antibody dependent cellular cytotoxicity (ADCC) and antibody dependent cellular phagocytosis (ADCP) through recruitment of FcɣRIII positive immune effector cells. In addition, in vivo, obinutuzumab mediates a low degree of complement dependent cytotoxicity (CDC). Compared to Type I antibodies, obinutuzumab, a Type II antibody, is characterised by an enhanced direct cell death induction with a concomitant reduction in CDC at an equivalent dose. Obinutuzumab, as a glycoengineered antibody, is characterised by enhanced ADCC and ADCP compared to non-glycoengineered antibodies at an equivalent dose. In animal models obinutuzumab mediates potent B-cell depletion and antitumour efficacy.
In the pivotal clinical study in patients with CLL (BO21004/CLL11), 91% (40 out of 44) of evaluable patients treated with Gazyvaro were B-cell depleted (defined as CD19+ B-cell counts <0.07 x 10⁹/L) at the end of treatment period and remained depleted during the first 6 months of follow up. Recovery of B-cells was observed within 12-18 months of follow up in 35% (14 out of 40) of patients without progressive disease and 13% (5 out of 40) with progressive disease.
In the pivotal clinical study in patients with iNHL (GAO4753/GADOLIN), 97% (171 out of 176) of evaluable patients treated with Gazyvaro were B-cell depleted at the end of the treatment period, and 97% (61 out of 63) remained depleted for more than 6 months from the last dose. Recovery of B-cells was observed within 12-18 months of follow-up in 11% (5 out of 46) of evaluable patients.
In the pivotal clinical study in patients with LN (CA41705/REGENCY), 99.2% (127 out of 128) of evaluable patients treated with Gazyvaro were B-cell depleted (defined as CD19+ B-cell counts <10 cells/μl) at Week 4 and 95% (117 out of 123) were B cell depleted at Week 76. Reductions in circulating naïve B, memory B, and plasmablasts/plasma cells were observed by Week 4 and remained low through Week 76 after treatment initiation.
Clinical efficacy and safety
Chronic Lymphocytic Leukaemia
A Phase III international, multicentre, open label, randomised, two-stage, three-arm clinical study (BO21004/CLL11) investigating the efficacy and safety of Gazyvaro plus chlorambucil (GClb) compared to rituximab plus chlorambucil (RClb) or chlorambucil (Clb) alone was conducted in patients with previously untreated CLL with comorbidities.
Prior to enrolment, patients had to have documented CD20+ CLL, and one or both of the following measures of coexisting medical conditions: comorbidity score (CIRS) of greater than 6 or reduced renal function as measured by CrCl <70 mL/min. Patients with inadequate liver function (National Cancer Institute – Common Terminology Criteria for Adverse Events Grade 3 liver function tests (AST, ALT >5 x ULN for >2 weeks; bilirubin >3 x ULN) and renal function (CrCl <30 mL/min) were excluded. Patients with one or more individual organ/system impairment score of 4 as assessed by the CIRS definition, excluding eyes, ears, nose, throat and larynx organ system, were excluded.
A total of 781 patients were randomised 2:2:1 to receive Gazyvaro plus chlorambucil, rituximab plus chlorambucil or chlorambucil alone. Stage 1a compared Gazyvaro plus chlorambucil to chlorambucil alone in 356 patients and Stage 2 compared Gazyvaro plus chlorambucil to rituximab plus chlorambucil in 663 patients.
In the majority of patients, Gazyvaro was given intravenously as a 1 000 mg initial dose administered on Day 1, Day 8 and Day 15 of the first treatment cycle. In order to reduce the rate of infusion related reactions in patients, an amendment was implemented and 140 patients received the first Gazyvaro dose administered over 2 days (Day 1 [100 mg] and Day 2 [900 mg]) (see section 4.2 and 4.4). For each subsequent treatment cycle (Cycles 2 to 6), patients received Gazyvaro 1 000 mg on Day 1 only. Chlorambucil was given orally at 0.5 mg/kg body weight on Day 1 and Day 15 of all treatment cycles (1 to 6).
The demographics data and baseline characteristics were well balanced between the treatment arms. The majority of patients were Caucasian (95%) and male (61%). The median age was 73 years, with 44% being 75 years or older. At baseline, 22% of patients had Binet Stage A, 42% had Binet Stage B and 36% had Binet Stage C.
The median comorbidity score was 8 and 76% of the patients enrolled had a comorbidity score above 6. The median estimated CrCl was 62 mL/min and 66% of all patients had a CrCl <70 mL/min. Forty-two percent of patients enrolled had both a CrCl <70 mL/min and a comorbidity score of >6. Thirty-four percent of patients were enrolled on comorbidity score alone, and 23% of patients were enrolled with only impaired renal function.
The most frequently reported coexisting medical conditions (using a cut off of 30% or higher), in the MedDRA body systems are: Vascular disorders (73%), Cardiac disorders (46%), Gastrointestinal disorders (38%), Metabolism and nutrition disorders (40%), Renal and urinary disorders (38%), Musculoskeletal and connective tissue disorders (33%).
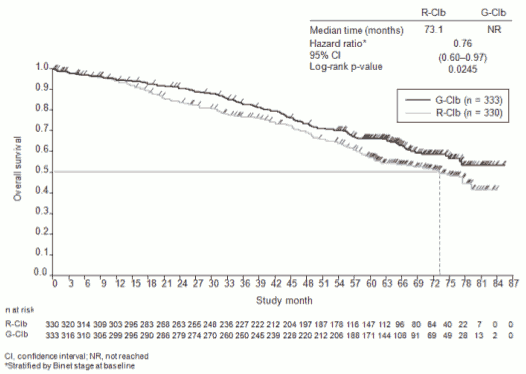
Efficacy results for patients with previously untreated CLL are summarised in Table 12. Kaplan-Meier curves for progression-free survival (PFS) and Overall Survival (OS) are shown in Figures 1-4.
Table 12. Summary of efficacy from BO21004/CLL11 study:
| Stage 1a | Stage 2 | |||
| Chlorambucil N=118 | Gazyvaro + chlorambucil N=238 | Rituximab + chlorambucil N=330 | Gazyvaro + chlorambucil N=333 | |
| 22.8 months median observation timeg | 18.7 months median observation timeg | |||
| Primary endpoint | ||||
| Investigator-assessed PFS (PFS-INV)a | ||||
| Number (%) of patients with event | 96 (81.4%) | 93 (39.1%) | 199 (60.3%) | 104 (31.2%) |
| Median time to event (months) | 11,1 | 26,7 | 15,2 | 26,7 |
| Hazard ratio (95% CI) | 0,18 [0,13, 0,24] | 0,39 [0,31, 0,49] | ||
| p-value (Log-Rank test, stratifiedb) | <0.0001 | <0.0001 | ||
| Key secondary endpoints | ||||
| IRC-assessed PFS (PFS-IRC)a | ||||
| Number (%) of patients with event | 90 (76.3%) | 89 (37.4%) | 183 (55.5%) | 103 (30.9%) |
| Median time to event (months) | 11.2 | 27.2 | 14.9 | 26.7 |
| Hazard ratio (95% CI) | 0.19 [0.14, 0.27] | 0.42 [0.33, 0.54] | ||
| p-value (Log-Rank test, stratifiedb) | <0.0001 | <0.0001 | ||
| End of treatment response rate | ||||
| No. of patients included in the analysis | 118 | 238 | 329 | 333 |
| Responders (%) | 37 (31.4%) | 184 (77.3%) | 214 (65.0%) | 261 (78.4%) |
| Non-responders (%) | 81 (68,6%) | 54 (22,7%) | 115 (35,0%) | 72 (21,6%) |
| Difference in response rate, (95% CI) | 45.95 [35.6, 56.3] | 13.33 [6.4, 20.3] | ||
| p-value (Chi-squared Test) | <0,0001 | 0,0001 | ||
| No. of complete respondersc (%) | 0 (0,0%) | 53 (22,3%) | 23 (7,0%) | 69 (20,7%) |
| Molecular remission at end of treatmentd | ||||
| No. of patients included in the analysis | 90 | 168 | 244 | 239 |
| MRD negativee (%) | 0 (0%) | 45 (26,8%) | 6 (2.5%) | 61 (25.5%) |
| MRD positivef (%) | 90 (100%) | 123 (73.2%) | 238 (97,5%) | 178 (74.5%) |
| Difference in MRD rates, (95% CI) | 26.79 [19.5, 34.1] | 23.06 [17.0, 29.1] | ||
| Event free survival | ||||
| No. (%) of patients with event | 103 (87.3%) | 104 (43.7%) | 208 (63.0%) | 118 (35.4%) |
| Median time to event (months) | 10.8 | 26.1 | 14.3 | 26.1 |
| Hazard ratio (95% CI) | 0.19 [0.14, 0.25] | 0.43 [0.34, 0.54] | ||
| p-value (Log-Rank test, stratifiedb) | <0.0001 | <0.0001 | ||
| Time to new anti-leukaemic therapy | ||||
| No. (%) of patients with event | 65 (55.1%) | 51 (21.4%) | 86 (26.1%) | 55 (16.5%) |
| Median time to event (months) | 14.8 | NR | 30.8 | NR |
| Hazard ratio (95% CI) | 0.24 [0.16, 0.35] | 0.59 [0.42, 0.82] | ||
| p-value (Log-Rank test, stratifiedb) | <0.0001 | <0.0018 | ||
| Overall survival | ||||
| No. (%) of patients with event | 57 (48.3%) | 93 (39.1%) | 147 (44.5%) | 121 (36.3%) |
| Median time to event (months) | 66.7 | NR | 73.1 | NR |
| Hazard ratio (95% CI) | 0.68 [0.49; 0.94] | 0.76 [0.60; 0.97] | ||
| p-value (Log-Rank test, stratifiedb) | 0.0196 | 0.0245 | ||
IRC: Independent Review Committee; PFS: progression-free survival; HR: Hazard Ratio; CI: Confidence Intervals, MRD: Minimal Residual Disease, NR = Not reached
a Defined as the time from randomisation to the first occurrence of progression, relapse or death from any cause as assessed by the investigator
b stratified by Binet stage at baseline
c Includes 11 patients in the GClb arm with a complete response with incomplete marrow recovery
d Blood and bone marrow combined
e MRD negativity is defined as a result below 0.0001
f Includes MRD positive patients and patients who progressed or died before the end of treatment
g Median observation time for overall survival (OS) data corresponds to 62.5 months median observation time in Stage 1a and to 59.4 months median observation time in Stage 2.
Results of subgroup analyses
Results of the progression free survival (PFS) subgroup analysis (i.e. sex, age, Binet stages, CrCl, CIRS score, beta2-microglobulin, IGVH status, chromosomal abnormalities, lymphocyte count at baseline) were consistent with the results seen in the overall Intent-to-Treat population. The risk of disease progression or death was reduced in the GClb arm compared to the RClb arm and Clb arm in all subgroups except in the subgroup of patients with deletion 17p. In the small subgroup of patients with deletion 17p, only a positive trend was observed compared to Clb (HR=0.42, p=0.0892); no benefit was observed compared to RClb. For subgroups, reduction of the risk of disease progression or death ranged from 92% to 58% for GClb versus Clb and 72% to 29% for GClb versus RClb.
Figure 1. Kaplan-Meier curve of Investigator assessed PFS from Stage 1a in patients with CLL (Study BO21004/CLL11):
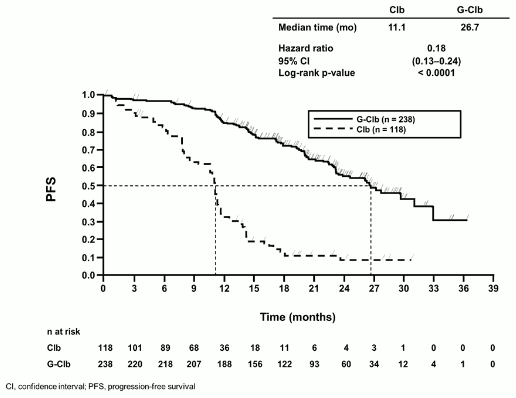
Figure 2. Kaplan-Meier curve of OS from Stage 1a in patients with CLL (Study BO21004/CLL11):
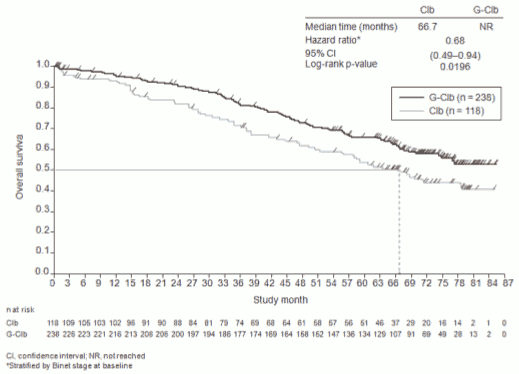
Figure 3. Kaplan-Meier curve of investigator assessed PFS from Stage 2 in patients with CLL (Study BO21004/CLL11):
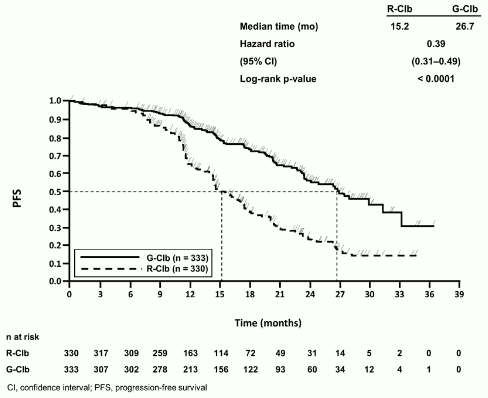
Figure 4. Kaplan-Meier curve of OS from Stage 2 in patients with CLL (Study BO21004/CLL11):
Quality of life
In the QLQC30 and QLQ-CLL-16 questionnaires conducted during the treatment period, no substantial difference in any of the subscales was observed. Data during follow up, especially for the chlorambucil alone arm, is limited. However, no notable differences in quality of life during follow up have been identified to date.
Health-related quality of life assessments, specific to fatigue through treatment period, show no statistically significant difference suggesting that the addition of Gazyvaro to a chlorambucil regimen does not increase the experience of fatigue for patients.
Follicular lymphoma
Previously untreated follicular lymphoma (study BO21223/GALLIUM)
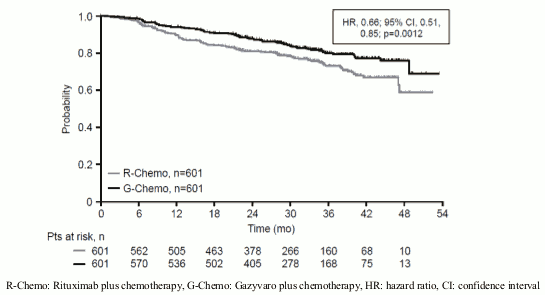
In a phase III, open label, multicentre, randomised clinical study (BO21223/GALLIUM), 1202 patients with previously untreated Grade 1-3a advanced (stage II bulky disease, stage III/IV) FL were evaluated. Patients with FL Grade 3b were excluded from the study. Patients were randomised to 1:1 to receive either Gazyvaro (n=601 patients) or rituximab (n=601 patients) in combination with chemotherapy (bendamustine, CHOP or CVP), followed by Gazyvaro or rituximab maintenance in patients achieving a complete or partial response.
Gazyvaro was given by intravenous infusion as a dose of 1 000 mg on Days 1, 8 and 15 of Cycle 1, on Day 1 of subsequent cycles. In total, six cycles of Gazyvaro (every 28 days) were given in combination with six cycles of bendamustine, and a total of eight cycles of Gazyvaro (every 21 days) were given in combination with six cycles of CHOP or eight cycles of CVP. Gazyvaro was administered prior to chemotherapy. Bendamustine was given intravenously on Days 1 and 2 for all treatment cycles (Cycles 1-6) at 90 mg/m²/day when given in combination with Gazyvaro. Standard dosing of CHOP and CVP was given. Following Cycles 6-8, in combination with chemotherapy, responding patients received Gazyvaro maintenance therapy every 2 months until disease progression or for up to 2 years.
The demographic data and baseline characteristics of the patient population were well balanced between the treatment arms; median age was 59 years, 81% were Caucasian, 53% were female, 79% had a FLIPI score of ≥2 and 7% had Stage II (bulky), 35% had Stage III and 57% had Stage IV disease, 44% had bulky disease (>7 cm), 34% had at least one B-symptom at baseline and 97% had an ECOG performance status of 0-1 at baseline. Fifty-seven percent received bendamustine, 33% received CHOP, and 10% received CVP chemotherapy.
Efficacy results for patients with previously untreated FL are summarised in Table 13. Kaplan-Meier curves for progression-free survival (PFS) are shown in Figure 5.
Table 13. Summary of efficacy in patients with previously untreated FL from BO21223/GALLIUM study:
| Rituximab + Chemotherapy followed by rituximab maintenance N=601 | Gazyvaro + Chemotherapy followed by Gazyvaro maintenance N=601 | |
| Primary Endpoint | ||
| Investigator-assessed PFS§ (PFS-INV) primary analysis | ||
| Number (%) of patients with event | 144 (24.0%) | 101 (16.8%) |
| HR [95% CI] | 0.66 [0.51, 0.85] | |
| p-value (Log-Rank test, stratified*) | 0.0012 | |
| 3 year PFS estimate [95% CI] | 73.3 [68.8, 77.2] | 80.0 [75.9, 83.6] |
| PFS-INV final analysis§§ | ||
| Number (%) of patients with event | 244 (40.6%) | 206 (34.3%) |
| HR [95% CI] | 0.77 [0.64, 0.93] | |
| p-value (Log-Rank test, stratified*) | 0.0055 | |
| 3 year PFS estimate [%] [95% CI] | 75.5 [71.8, 78.9] | 82.4 [79.0, 85.3] |
| 7 year PFS estimate [%] [95% CI] | 55.7 [51.3, 59.9] | 63.4 [59.0, 67.4] |
| Key Endpoints | ||
| IRC-assessed PFS (PFS-IRC) primary analysis | ||
| Number (%) of patients with event | 125 (20.8%) | 93 (15.5%) |
| HR [95% CI] | 0,71 [0.54, 0.93] | |
| p-value (Log-Rank test, stratified*) | 0.0138 | |
| Time to next anti-lymphoma therapy# primary analysis | ||
| Number (%) of patients with event | 111 (18.5%) | 80 (13.3%) |
| HR [95% CI] | 0.68 [0.51, 0.91] | |
| p-value (Log-Rank test, stratified*) | 0.0094 | |
| Overall Survival# primary analysis | ||
| No. (%) of patients with event | 46 (7.7%) | 35 (5.8%) |
| HR [95% CI] | 0.75 [0.49, 1.17]¶ | |
| p-value (Log-Rank test, stratified*) | 0.21¶ | |
| Overall Survival final analysis§§ | ||
| No. (%) of patients with event | 86 (14.3%) | 76 (12.6%) |
| HR [95% CI] | 0.86 [0.63, 1.18] | |
| p-value (Log-Rank test, stratified*) | 0.36 | |
| Overall Response Rate** at End of Induction‡ (INV-assessed, CT)# primary analysis | ||
| Responders (%) (CR, PR) | 522 (86.9%) | 532 (88.5%) |
| Difference in response rate (%) [95% CI] | 1.7% [-2.1%, 5.5%] | |
| p-value (Cochran-Mantel-Haenszel test) | 0.33 | |
| Complete Response (CR) | 143 (23.8%) | 117 (19.5%) |
| Partial Response (PR) | 379 (63.1%) | 415 (69.1%) |
IRC: Independent Review Committee; PFS: progression-free survival; HR: Hazard Ratio; CI: Confidence Interval
* Stratification factors were chemotherapy regimen, FLIPI risk group for follicular lymphoma, geographic region
§ Significance level at this efficacy interim analysis: 0.012
¶ Data Not Yet Mature. Median was not reached at time of analysis
# not adjusted for multiplicity
** Assessed as per modified Cheson 2007 criteria
‡ End of Induction = end of induction phase, does not include monotherapy maintenance
Figure 5. Kaplan-Meier curve of INV-assessed progressio:
Results of subgroup analyses:
Results of subgroup analyses (not adjusted for multiplicity) were, in general, consistent with the results seen in the FL population, supporting the robustness of the overall result (primary analysis, data cut-off 31 January 2016). The subgroups evaluated included IPI, FLIPI, Bulky Disease, B Symptoms at baseline, Ann Arbor Stage and ECOG at baseline. In patients with FLIPI score 0-1 (low risk), no difference between Gazyvaro plus chemotherapy and rituximab plus chemotherapy was observed (INV-assessed PFS HR 1.17 (95%CI 0.63;2.19, 40 PFS events). This subgroup comprised 21% (253/1202) of the FL ITT population and experienced 16.3% (40/245) of the PFS events. In addition, exploratory subgroup analyses of PFS across chemotherapy regimens (bendamustine, CHOP and CVP) were consistent with the results seen in the Gazyvaro plus chemotherapy population. The observed HRs by chemotherapy subgroup were as follows; CHOP (n=398): HR 0.77 (95% CI: 0.50, 1.20), CVP (n=118): HR 0.63 (95% CI: 0.32, 1.21), and bendamustine (n=686): HR 0.61 (95% CI: 0.43, 0.86).
Patient Reported Outcomes:
Based on the FACT-Lym questionnaire collected during treatment and follow-up phases, patients in both treatment arms experienced clinically meaningful improvements in lymphoma-related symptoms as defined by a ≥3 point increase from baseline in the Lymphoma subscale, a ≥6 point increase from baseline in the FACT Lym TOI and a ≥7 point increase from baseline in the FACT Lym Total score. EQ-5D utility scores were similar at baseline, during treatment and follow-up. No meaningful differences were seen between the arms in HRQOL or health status measures.
Due to the open label design the patient reported outcomes should be interpreted with caution.
Patients with follicular lymphoma who did not respond or who progressed during or up to 6 months after treatment with rituximab or a rituximab-containing regimen (study GAO4753g/GADOLIN)
In a phase III, open label, multicentre, randomised clinical study (GAO4753g/GADOLIN), 396 patients with iNHL who had no response during treatment or who progressed within 6 months following the last dose of rituximab or a rituximab-containing regimen (including rituximab monotherapy as part of induction or maintenance treatment) were evaluated. Patients were randomised 1:1 to receive either bendamustine (B) alone (n=202) or Gazyvaro in combination with bendamustine (G+B) (n=194) for 6 cycles, each of 28 days duration. Patients in the G+B arm who did not have disease progression (i.e. patients with a complete response (CR), partial response (PR) or stable disease (SD)) at the end of induction continued receiving Gazyvaro maintenance once every two months for two years or until disease progression (whichever occurred first). Patients were stratified according to region, iNHL subtype (follicular versus non-follicular), rituximab-refractory type (whether refractory to prior rituximab monotherapy or rituximab in combination with chemotherapy) and the number of prior therapies (≤2 versus >2).
The demographic data and baseline characteristics were well balanced between the treatment arms (median age 63 years, the majority were Caucasian [88%] and male [58%]). The majority of patients had follicular lymphoma (81%). The median time from initial diagnosis was 3 years and the median number of prior therapies was 2 (range 1 to 10); 44% of patients had received 1 prior therapy and 34% of patients had received 2 prior therapies.
Gazyvaro was given by intravenous infusion as a dose of 1 000 mg on Days 1, 8 and 15 of Cycle 1, on Day 1 of Cycles 2-6, and in patients who did not have disease progression, once every two months for two years or until disease progression (whichever occurs first). Bendamustine was given intravenously on Days 1 and 2 for all treatment cycles (Cycles 1-6) at 90 mg/m²/day when given in combination with Gazyvaro or 120 mg/m²/day when given alone. In patients treated with G+ B, 79.4% received all six treatment cycles compared to 66.7% of patients in the B arm.
The primary analysis, based on independent Review Committee (IRC) assessment demonstrated a statistically significant - 45% reduction in the risk of disease progression or death, in patients with iNHL receiving G+B followed by Gazyvaro maintenance, compared with patients receiving bendamustine alone. The reduction in the risk of disease progression or death seen in the iNHL population is driven by the subset of patients with FL.
The majority of the patients in study GAO4753g had FL (81.1%). Efficacy results from the primary analysis in the FL population are shown in Table 14 and Figures 6 and 8. 11.6% of the patients had marginal zone lymphoma (MZL) and 7.1% had small lymphocytic lymphoma (SLL). In the non-FL population the HR for IRC-assessed PFS was 0.94 [95% CI: 0.49, 1.90]. No definitive conclusions could be drawn on efficacy in the MZL and SLL sub-populations.
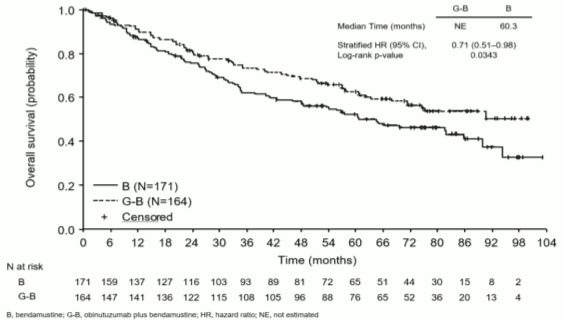
At final analysis, the median observation time was 45.9 months (range: 0-100.9 months) for FL patients in the B arm and 57.3 months (range: 0.4-97.6 months) for patients in the G+B arm, representing an additional 25.6 months and 35.2 months of median follow-up in B and G+B arms, respectively, since the primary analysis. Only Investigator (INV) assessed endpoints were reported at final analysis since IRC assessments did not continue. Overall, the investigator assessed efficacy results were consistent with what was observed in the primary analysis. The overall survival (OS) in patients with FL was stable with longer follow-up (see Figure 7); the HR for risk of death was 0.71 (95%CI: 0.51, 0.98).
Table 14. Summary of primary efficacy analysis in patients with FL# from GAO4753g/GADOLIN study:
| Bendamustine N=166 | Gazyvaro + Bendamustine followed by Gazyvaro maintenance N=155 | |
| Median observation time: 20 months | Median observation time: 22 months | |
| Primary Endpoint in FL population | ||
| IRC-assessed PFS (PFS-IRC) | ||
| Number (%) of patients with event | 90 (54.2%) | 54 (34.8%) |
| Median time to event (months, 95% CI) | 13.8 (11.4, 16.2) | NR (22.5,-) |
| HR (95% CI) | 0.48 (0.34, 0.68) | |
| p-value (Log-Rank test, stratified*) | <0.0001 | |
| Secondary Endpoints | ||
| Investigator-assessed PFS (PFS-INV) | ||
| Number (%) of patients with event | 102 (61.4%) | 62 (40.0%) |
| Median time to event (months, 95% CI) | 13.7 (11.0, 15.5) | 29.2 (17.5,-) |
| HR (95% CI) | 0.48 (0.35, 0.67) | |
| p-value (Log-Rank test, stratified*) | <0.0001 | |
| Best Overall Response (BOR) (IRC-assessed)§ | ||
| No. of patients included in the analysis | 161 | 153 |
| Responders (%) (CR/PR) | 124 (77,0%) | 122 (79.7%) |
| Difference in response rate (95% CI) | 2.72 (-6.74, 12.18) | |
| p-value (Cochran-Mantel-Haenszel test) | 0.6142 | |
| Complete Responders (%) | 31 (19.3%) | 24 (15.7%) |
| Partial Responders (%) | 93 (57.8%) | 98 (64.1%) |
| Stable Disease (%) | 18 (11.2%) | 13 (8.5%) |
| Duration of response (DOR) (IRC-assessed) | ||
| No of patients included in the analysis | 127 | 122 |
| No. (%) of patients with event | 74 (58.3%) | 36 (29.5%) |
| Median duration (months) of DOR (95% CI) | 11.9 (8.8, 13.6) | NR (25.4, -) |
| HR (95% CI) | 0.36 (0.24, 0.54) | |
| Overall Survival | ||
| No. (%) of patients with event | 36 (21.7%) | 25 (16.1%) |
| Median time to event (months) | NR | NR |
| HR (95% CI) | 0.71 (0.43, 1.19) | |
| p-value (Log-Rank test, stratified*) | 0.1976 | |
IRC: Independent Review Committee; PFS: progression-free survival; HR: Hazard Ratio; CI: Confidence Intervals, NR = Not Reached
# Patients with FL who did not respond or who progressed during or up to 6 months after treatment with rituximab or a rituximab-containing regimen
* Stratification factors for analysis were refractory type (rituximab monotherapy vs. rituximab + chemotherapy) and prior therapies (≤2 vs >2). Follicular versus non-follicular was also a stratification factor for the study but is not applicable in the subgroup analysis of patients with FL.
§ Best response within 12 months of start of treatment
Figure 6. Kaplan-Meier curve of IRC-assessed PFS in patients with FL# (Study GAO4753g/GADOLIN):
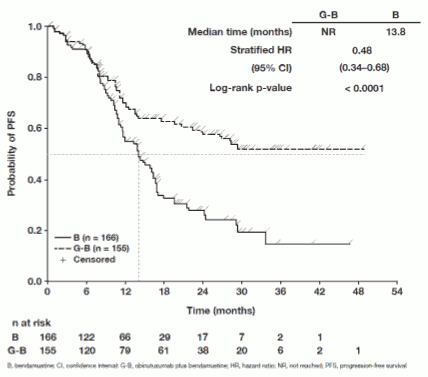
Figure 7. Kaplan-Meier curve of Overall Survival in FL patients at Final Analysis (Study GAO4753g/GADOLIN):
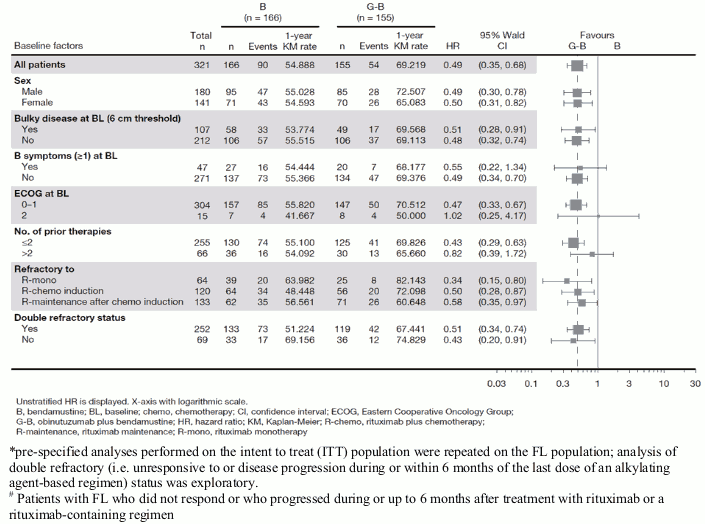
Results of subgroup analyses:
Results of subgroup analyses were in general consistent with the results seen in the FL population, supporting the robustness of the overall result.
Figure 8. IRC-assessed PFS by patient subgroup in FL*# (Study GAO4753g/GADOLIN):
Short Duration Infusion Study MO40597 (GAZELLE)
The safety of short (approximately 90 minutes) duration infusion (SDI) of obinutuzumab administered in combination with CHOP, CVP or bendamustine chemotherapy was evaluated in a multicenter, open-label, single arm study in 113 patients with previously untreated advanced follicular lymphoma (Study MO40597/GAZELLE).
Patients received the first cycle of obinutuzumab at the standard infusion rate on Day 1, 8, and 15 of Cycle 1. Patients who did not experience any Grade ≥3 IRRs during the first cycle received SDI from Cycle 2 onwards.
The primary endpoint of the study was the proportion of patients who experienced a Grade ≥3 IRR associated with SDI during Cycle 2, among those who had previously received 3 administrations of obinutuzumab at the standard infusion rate during Cycle 1 without experiencing a Grade ≥3 IRR. No Grade ≥3 IRRs were observed among patients receiving SDI at Cycle 2. After Cycle 2 only one patient experienced a Grade 3 IRR (hypertension at Cycle 5). See section 4.8 Undesirable Effects.
Patient-reported Outcomes:
Due to the open label design the patient reported outcomes should be interpreted with caution. Based on the FACT-Lym questionnaire and EQ-5D index scale collected during the treatment and during follow-up periods, health-related quality of life was generally maintained in the pivotal study with no meaningful difference between the arms. However, in patients with FL the addition of Gazyvaro to bendamustine delayed the time to worsening of health-related quality of life as measured by the FACT-Lym TOI score by 2.2 months (median 5.6 versus 7.8 months for B and G+B respectively HR = 0.83; 95% CI: 0.60, 1.13).
Lupus nephritis
A Phase III, randomised, double-blind, placebo-controlled, parallel-group, multicentre study (CA41705/REGENCY) was conducted in patients with ISN/RPS 2003 Class III or IV, with or without concomitant Class V, lupus nephritis, treated with standard therapy consisting of mycophenolate mofetil (MMF) and corticosteroids.
Patients had active or active/chronic ISN/RPS 2003 Class III or IV, with or without concomitant Class V proliferative LN determined by kidney biopsy, current or past positive antinuclear antibody (ANA), urine protein-to-creatinine ratio (UPCR) ≥1 g/g, and had received at least one dose of pulse methylprednisolone IV (≥250 mg) or equivalent treatment for LN during the 6 months prior to screening or during screening.
Patients with eGFR <30 ml/min/1.73 m² or in need of dialysis or transplantation, with sclerosis in >50% of glomeruli on kidney biopsy, presence of rapidly progressive glomerulonephritis, evidence of active infection, receipt of anti-CD20 therapy <9 months before or during screening, or receipt of cyclophosphamide, tacrolimus, ciclosporin, or voclosporin within 2 months of or during screening were excluded.
A total of 271 patients were randomised 1:1 to receive Gazyvaro 1 000 mg or placebo intravenously, in combination with MMF 2-2.5 g/day and a tapering course of corticosteroids, and were evaluated over 76 weeks. Patients randomised to receive Gazyvaro were further randomised in a 1:1 ratio to receive either Gazyvaro 1 000 mg IV on Day 1, Weeks 2, 24, 26, 50, and 52 (Arm 1) or Gazyvaro 1 000 mg IV on Day 1, Weeks 2, 24, 26, and 52 (Arm 2). The totality of the Gazyvaro efficacy data combining both treatment arms is shown on Table 15.
All patients received oral prednisone 0.5 mg/kg/day (maximum 60 mg/day) and remained at this dose until Week 2. Beginning on Day 15, prednisone was tapered to achieve a target dose of 5 mg/day by Week 24. Prednisone was maintained at a low dose (5 mg/day) from Week 24 until Week 80.
The median age of patients was 31 years; 84.5% were female, 57.6% were Hispanic or Latino, 47.6% were White, 14.8% were Black or African American. The distribution by kidney biopsy class was 39.5% Class III, 60.5% Class IV and 31.4% had concomitant Class V. Mean (SD) eGFR at baseline 102.3 (±30.8) mL/min/1.73 m². Mean (SD) UPCR at baseline was 3.34 (±2.87) mg/mg with 42.2% of patients exhibiting UPCR ≥3 mg/mg at baseline. At baseline, 17% of patients had mild (eGFR 60 - <90 mL/min/1.73m²) and 11.4% had moderate (eGFR 30 - <60 mL/min/1.73m²) renal impairment.
The primary outcome measure was proportion of patients who achieved complete renal response (CRR) at Week 76, defined as meeting all of the following criteria: UPCR <0.5 g/g; estimated glomerular filtration rate (eGFR) ≥85% of baseline, as calculated using the 2009 Chronic Kidney Disease Epidemiology Collaboration (CKD-EPI) equation; with no occurrence of the following intercurrent events: rescue therapy, treatment failure, death or early study withdrawal.
Key secondary outcome measures included: proportion of patients who achieved CRR with successful prednisone taper at Week 76, proportion of patients who achieved a proteinuric response at Week 76 and proportion of patients who experience death or kidney-related events through Week 76.
Results
The proportion of patients with lupus nephritis achieving CRR at Week 76 was significantly greater (46.4%) in patients treated with Gazyvaro in combination with standard therapy compared to patients who received placebo plus standard therapy (33.1%). Efficacy results are summarised in Table 15.
Table 15. Efficacy results in adults with lupus nephritis (REGENCY/CA41705):
| Placebo + standard therapy^ (N=136) | Gazyvaro + standard therapy^ (N=135) | |
| Primary endpoint | ||
| CRR at Week 76 (%) | 33.1 | 46.4 |
| Treatment difference (95% CI) | 13.40 (1.95, 24.84) | |
| p-value | 0.0232 | |
| Components of CRR: | ||
| UPCR <0.5 | 49 (36.0%) | 64 (47.4%) |
| eGFR ≥85% of baseline | 103 (75.7%) | 113 (83.7%) |
| No occurrence of intercurrent events | 102 (75.0%) | 120 (88.9%) |
| Key secondary endpoints | ||
| CRR with successful prednisone taper at Week 76 (%)* | 30.9 | 42.7 |
| Treatment difference (95% CI) | 11.88 (0.57, 23.18) | |
| p-value | 0.0421 | |
| Proteinuric response at Week 76 (%)# | 41.9 | 55.5 |
| Treatment difference (95% CI) | 13.68 (2.01, 25.36) | |
| p-value | 0.0227 | |
CRR: complete renal response; CI: Confidence Interval; UPCR: urine protein-to-creatinine ratio; eGFR: estimated glomerular filtration rate
^ mycophenolate mofetil (MMF) and corticosteroids
* CRR at Week 76 without receiving prednisone taper >7.5 mg/day or equivalent from Week 64 through Week 76
# UPCR <0.8 g/g at Week 76 and no occurrence of the following intercurrent events: rescue therapy, treatment failure, death or early study withdrawal
Immunogenicity
Immunogenicity assay results are highly dependent on several factors including assay sensitivity and specificity, assay methodology, assay robustness to quantities of Gazyvaro/antibody in the circulation, sample handling, timing of sample collection, concomitant medicines and underlying disease. For these reasons, comparison of incidence of antibodies to Gazyvaro with the incidence of antibodies to other products may be misleading.
Patients in the CLL pivotal study BO21004/CLL11 were tested at multiple time-points for anti-therapeutic antibodies (ATA) to Gazyvaro. In patients treated with Gazyvaro 8 out of 140 patients in the randomised phase and 2 out of 6 in the run in phase tested positive for ATA at 12 months of follow up. Of these patients, none experienced anaphylactic or hypersensitivity reactions that were considered related to ATA, nor was clinical response affected.
No post-baseline HAHA (Human Anti-Human Antibody) were observed in patients with iNHL treated in study GAO4753g/GADOLIN. In study BO21223/GALLIUM, 1/565 patient (0.2% of patients with a post-baseline assessment) developed HAHA at induction completion. While the clinical significance of HAHA is not known, a potential correlation between HAHA and clinical course cannot be ruled out.
In Gazyvaro-treated patients in the LN studies, a total of 12 out of 200 (6%) had at least one ADA-positive sample recorded at any time during the studies. Six (3%) subjects had ADA-positive samples recorded at baseline. Two of the 6 patients who were ADA-positive at baseline remained ADA-positive throughout the studies, 1 had a single post-baseline sample that was ADA-positive and in the remaining 3 patients all post-baseline samples were ADA-negative. Six (3%) patients for whom the baseline sample was ADA-negative had a positive ADA titre post-baseline (treatment-induced ADA).
None of the 12 patients with positive ADA titres at any time during the treatment period experienced an IRR or anaphylactic or hypersensitivity reaction during the study.
Paediatric population
The European Medicines Agency has waived the obligation to submit the results of studies with Gazyvaro in all subsets of the paediatric population in CLL and FL (see section 4.2 for information on paediatric use).
The European Medicines Agency has deferred the obligation to submit the results of studies with Gazyvaro in one or more subsets of the paediatric population, in systemic lupus erythematosus including LN (see section 4.2 for information on paediatric use).
Pharmacokinetic properties
A population pharmacokinetic (PK) model was developed to analyse the PK data in 469 iNHL, 342 CLL and 130 diffuse large B-cell lymphoma (DLBCL) patients from Phase I, Phase II and Phase III studies who received obinutuzumab alone or in combination with chemotherapy.
A population PK model was developed to analyse the PK data in 196 LN patients from Phase II and Phase III studies who received obinutuzumab.
Absorption
Obinutuzumab is administered intravenously, therefore absorption is not applicable. There have been no studies performed with other routes of administration. From the population PK model, after the Cycle 6 Day 1 infusion in CLL patients, the estimated median Cmax value was 465.7 μg/mL and AUC(τ) value was 8961 μg•d/mL and in iNHL patients the estimated median Cmax value was 539.3 μg/mL and AUC(τ) value was 10956 μg•day/mL. Based on the population PK model in LN patients, the estimated median Cmax at steady state was 468 μg/mL and AUC at steady state was 8740 μg•d/mL.
Distribution
Following intravenous administration, the volume of distribution of the central compartment (2.98 L in patients with CLL, 2.97 L in patients with iNHL, and 2.22 L in patients with LN) approximates serum volume, which indicates distribution is largely restricted to plasma and interstitial fluid.
Biotransformation
The metabolism of obinutuzumab has not been directly studied. Antibodies are mostly cleared by catabolism.
Elimination
The clearance of obinutuzumab was approximately 0.11 L/day in CLL patients and 0.08 L/day in iNHL patients with a median elimination t½ of 26.4 days in CLL patients and 36.8 days in iNHL patients. Obinutuzumab elimination comprises two parallel pathways which describe clearance, a linear clearance pathway and a non-linear clearance pathway which changes as a function of time. During the initial treatment, the non-linear time-varying clearance pathway is dominant and is consequently the major clearance pathway. As treatment continues, the impact of this pathway diminishes and the linear clearance pathway predominates. This is indicative of target mediated drug disposition (TMDD), where the initial abundance of CD20 cells causes a rapid removal of obinutuzumab from the circulation. However, once the majority of CD20 cells are bound with obinutuzumab, the impact of TMDD on PK is minimised.
In LN patients the steady state clearance of obinutuzumab was approximately 0.13 L/day with a median elimination t1/2 of 22.4 days. Obinutuzumab elimination comprises two parallel pathways which describe clearance: a linear clearance pathway and a non-linear clearance pathway which changes as a function of time. The time-varying clearance decreases with time with an exponential decay coefficient, likely related to CD20 target reduction and proteinuria improvement over time and a time-independent one related to the endogenous catabolic processes of IgG.
Pharmacokinetic/pharmacodynamic relationship(s)
In the population pharmacokinetic analysis, gender was found to be a covariate which explains some of the inter-patient variability, with a 22% greater steady state clearance (CLss) and a 19% greater volume of distribution (V) in males. However, results from the population analysis have shown that the differences in exposure are not significant (with an estimated median AUC and Cmax in CLL patients of 11282 μg•d/mL and 578.9 μg/mL in females and 8451 μg•d/mL and 432.5 μg/mL in males, respectively at Cycle 6 and AUC and Cmax in iNHL of 13172 μg•d/mL and 635.7 μg/mL in females and 9769 μg•d/mL and 481.3 μg/mL in males, respectively), indicating that there is no need to dose adjust based on gender.
Elderly
Chronic lymphocytic leukaemia and follicular lymphoma:
The population pharmacokinetic analysis of obinutuzumab showed that age did not affect the pharmacokinetics of obinutuzumab. No significant difference was observed in the pharmacokinetics of obinutuzumab among patients <65 years (n=375), patients between 65-75 years (n=265) and patients >75 years (n=171).
Lupus nephritis:
No studies have been conducted to investigate the pharmacokinetics of obinutuzumab in patients ≥65 years of age.
Paediatric population
No studies have been conducted to investigate the pharmacokinetics of obinutuzumab in paediatric patients.
Renal impairment
Chronic lymphocytic leukaemia and follicular lymphoma:
The population pharmacokinetic analysis of obinutuzumab showed that creatinine clearance does not affect pharmacokinetics of obinutuzumab. Pharmacokinetics of obinutuzumab in patients with mild creatinine clearance (CrCl 50-89 mL/min, n=464) or moderate (CrCl 30 to 49 mL/min, n=106) renal impairment were similar to those in patients with normal renal function (CrCl ≥90 mL/min, n=383). Pharmacokinetic data in patients with severe renal impairment (CrCl 15-29 mL/min) is limited (n=8), therefore no dose recommendations can be made.
Lupus nephritis:
The population pharmacokinetic analysis (n=196) of obinutuzumab showed that creatinine clearance does not affect the pharmacokinetics in patients with LN. The pharmacokinetics of obinutuzumab in patients with mild (CrCl 60 - <90 mL/min, n=45) or moderate (CrCl 30 - <60 mL/min, n=17) renal impairment were similar to those in patients with normal kidney function.
Hepatic impairment:
No formal pharmacokinetic study has been conducted in patients with hepatic impairment.
Preclinical safety data
No studies have been performed to establish the carcinogenic potential of obinutuzumab.
No specific studies in animals have been performed to evaluate the effect of obinutuzumab on fertility. In repeat-dose toxicity studies in cynomolgus monkeys obinutuzumab had no adverse effects on male and female reproductive organs.
An enhanced pre and postnatal development (ePPND) toxicity study in pregnant cynomolgus monkeys showed no evidence of teratogenic effects. However, weekly obinutuzumab dosing from post-coitum day 20 to delivery resulted in complete depletion of B-cells in infant monkeys at weekly intravenous obinutuzumab doses of 25 and 50 mg/kg (2-5 times the clinical exposure based on Cmax and AUC). Offspring exposure on day 28 post-partum suggests that obinutuzumab can cross the blood-placenta barrier. Concentrations in infant serum on day 28 post-partum were in the range of concentrations in maternal serum, whereas concentrations in milk on the same day were very low (less than 0.5% of the corresponding maternal serum levels) suggesting that exposure of infants must have occurred in utero. The B-cell counts returned to normal levels, and immunologic function was restored within 6 months post-partum.
In a 26-week cynomolgus monkey study, hypersensitivity reactions were noted and attributed to the foreign recognition of the humanised antibody in cynomolgus monkeys (0.7-6 times the clinical exposure based on Cmax and AUC at steady state after weekly administration of 5, 25, and 50 mg/kg). Findings included acute anaphylactic or anaphylactoid reactions and an increased prevalence of systemic inflammation and infiltrates consistent with immune-complex mediated hypersensitivity reactions, such as arteritis/periarteritis, glomerulonephritis, and serosal/adventitial inflammation. These reactions led to unscheduled termination of 6/36 animals treated with obinutuzumab during dosing and recovery phases; these changes were partially reversible. No renal toxicity with a causal relationship to obinutuzumab has been observed in humans.
© All content on this website, including data entry, data processing, decision support tools, "RxReasoner" logo and graphics, is the intellectual property of RxReasoner and is protected by copyright laws. Unauthorized reproduction or distribution of any part of this content without explicit written permission from RxReasoner is strictly prohibited. Any third-party content used on this site is acknowledged and utilized under fair use principles.