IRESSA Film-coated tablets Ref.[9032] Active ingredients: Gefitinib
Source: European Medicines Agency (EU) Revision Year: 2019 Publisher: AstraZeneca AB, SE-151 85, Södertälje, Sweden
Pharmacodynamic properties
Pharmacotherapeutic group: antineoplastic agents, protein kinase inhibitors
ATC code: L01XE02
Mechanism of action and pharmacodynamic effects
The epidermal growth factor (EGF) and its receptor (EGFR [HER1; ErbB1]) have been identified as key drivers in the process of cell growth and proliferation for normal and cancer cells. EGFR activating mutation within a cancer cell is an important factor in promotion of tumour cell growth, blocking of apoptosis, increasing the production of angiogenic factors and facilitating the processes of metastasis.
Gefitinib is a selective small molecule inhibitor of the epidermal growth factor receptor tyrosine kinase and is an effective treatment for patients with tumours with activating mutations of the EGFR tyrosine kinase domain regardless of line of therapy. No clinically relevant activity has been shown in patients with known EGFR mutation-negative tumours.
The common EGFR activating mutations (Exon 19 deletions; L858R) have robust response data supporting sensitivity to gefitinib; for example a progression free survival HR (95% CI) of 0.489 (0.336, 0.710) for gefitinib vs. doublet chemotherapy [WJTOG3405]. Gefitinib response data is more sparse in patients whose tumours contain the less common mutations; the available data indicates that G719X, L861Q and S7681 are sensitising mutations; and T790M alone or exon 20 insertions alone are resistance mechanisms.
Resistance
Most NSCLC tumours with sensitising EGFR kinase mutations eventually develop resistance to IRESSA treatment, with a median time to disease progression of 1 year. In about 60% of cases, resistance is associated with a secondary T790M mutation for which T790M targeted EGFR TKIs may be considered as a next line treatment option. Other potential mechanisms of resistance that have been reported following treatment with EGFR signal blocking agents include: bypass signalling such as HER2 and MET gene amplification and PIK3CA mutations. Phenotypic switch to small cell lung cancer has also been reported in 5-10% of cases.
Circulating Tumour DNA (ctDNA)
In the IFUM trial, mutation status was assessed in tumour and ctDNA samples derived from plasma, using the Therascreen EGFR RGQ PCR kit (Qiagen). Both ctDNA and tumour samples were evaluable for 652 patients out of 1060 screened. The objective response rate (ORR) in those patients who were tumour and ctDNA mutation positive was 77% (95% CI: 66% to 86%) and in those who were tumour only mutation positive 60% (95% CI: 44% to 74%).
Table 2. Summary of baseline mutation status for tumour and ctDNA samples in all screened patients evaluable for both samples:
| Measure | Definition | IFUM rate % (CI) | IFUM N |
|---|---|---|---|
| Sensitivity | Proportion of tumour M+ that are M+ by ctDNA | 65.7 (55.8, 74.7) | 105 |
| Specificity | Proportion of tumour M- that are M- by ctDNA) | 99.8 (99.0, 100.0) | 547 |
These data are consistent with the pre-planned exploratory Japanese subgroup analysis in IPASS (Goto 2012). In that study ctDNA derived from serum, not plasma was used for EGFR mutation analysis using the EGFR Mutation Test Kit (DxS) (N=86). In that study, sensitivity was 43.1%, specificity was 100%.
Clinical efficacy and safety
First line treatment
The randomised phase III first line IPASS study was conducted in patients in Asia 1 with advanced (stage IIIB or IV) NSCLC of adenocarcinoma histology who were ex-light smokers (ceased smoking >15 years ago and smoked <10 pack years) or never smokers (see Table 3).
1 China, Hong Kong, Indonesia, Japan, Malaysia, Philippines, Singapore, Taiwan and Thailand.
Table 3. Efficacy outcomes for gefitinib versus carboplatin/paclitaxel from the IPASS study:
| Population | N | Objective response rates and 95% CI for difference between treatmentsa | Primary endpoint Progression free survival (PFS)a,b | Overall survivala,b |
|---|---|---|---|---|
| Overall | 1217 | 43.0% vs 32.2% [5.3%, 16.1%] | HR 0.74 [0.65, 0.85] 5.7m vs 5.8m p<0.0001 | HR 0.90 [0.79, 1.02] 18.8m vs 17.4m p=0.1087 |
| EGFR mutation-positive | 261 | 71.2% vs 47.3% [12.0%, 34.9%] | HR 0.48 [0.36, 0.64] 9.5m vs 6.3m p<0.0001 | HR 1.00 [0.76, 1.33] 21.6m vs 21.9m |
| EGFR mutation-negative | 176 | 1.1% vs 23.5% [-32.5%, -13,3%] | HR 2.85 [2.05, 3.98] 1.5m vs 5.5m p<0.0001 | HR 1.18 [0.86, 1.63] 11.2m vs 12.7m |
| EGFR mutationun-known | 780 | 43.3% vs 29.2% [7.3%, 20.6%] | HR 0.68 [0.58 έως 0.81] 6.6m vs 5.8m p<0.0001 | HR 0.82 [0.70 έως 0.96] 18.9m vs 17.2m |
a Values presented are for IRESSA versus carboplatin/paclitaxel.
b “m” is medians in months. Numbers in square brackets are 95% confidence intervals for HR
N Number of patients randomised.
HR Hazard ratio (hazard ratios <1 favour IRESSA)
Quality of life outcomes differed according to EGFR mutation status. In EGFR mutation-positive patients, significantly more IRESSA-treated patients experienced an improvement in quality of life and lung cancer symptoms vs. carboplatin/paclitaxel (see Table 4).
Table 4. Quality of life outcomes for gefitinib versus carboplatin/paclitaxel from the IPASS study:
| Population | N | FACT-L QoL improvement ratea % | LCS symptom improvement ratea % |
|---|---|---|---|
| Overall | 1151 | (48.0% vs 40.8%) p=0.0148 | (51.5% vs 48.5%) p=0.3037 |
| EGFR mutation-positive | 259 | (70.2% vs 44.5%) p<0.0001 | (75.6% vs 53.9%) p=0.0003 |
| EGFR mutation-negative | 169 | (14.6% vs 36.3%) p=0.0021 | (20.2% vs 47.5%) p=0.0002 |
Trial outcome index results were supportive of FACT-L and LCS results
a Values presented are for IRESSA versus carboplatin/paclitaxel.
N Number of patients evaluable for quality of life analyses
QoL Quality of life
FACT-L Functional assessment of cancer therapy-lung
LCS Lung cancer subscale
In the IPASS trial, IRESSA demonstrated superior PFS, ORR, QoL and symptom relief with no significant difference in overall survival compared to carboplatin/paclitaxel in previously untreated patients, with locally advanced or metastatic NSCLC, whose tumours harboured activating mutations of the EGFR tyrosine kinase.
Pretreated patients
The randomised phase III INTEREST study was conducted in patients with locally advanced or metastatic NSCLC who had previously received platinum-based chemotherapy. In the overall population, no statistically significant difference between gefitinib and docetaxel (75 mg/m²) was observed for overall survival, progression free survival and objective response rates (see Table 5).
Table 5. Efficacy outcomes for gefitinib versus docetaxel from the INTEREST study:
| Population | N | Objective response rates and 95% CI for difference between treatmentsa | Progression free survivala,b | Primary endpoint overall survivala,b |
|---|---|---|---|---|
| Overall | 1466 | 9.1% vs 7.6% [-1.5%, 4.5%] | HR 1.04 [0.93, 1.18] 2.2m vs 2.7m p=0.4658 | HR 1.020 [0.905, 1.150]c 7.6m vs 8.0m p=0.7332 |
| EGFR mutation-positive | 44 | 42.1% vs 21.1% [-8.2%, 46.0%] | HR 0.16 [0.05, 0.49] 7.0m vs 4.1m p=0.0012 | HR 0.83 [0.41, 1.67] 14.2m vs 16.6m p=0.6043 |
| EGFR mutation-negative | 253 | 6.6% vs 9.8% [-10.5%, 4.4%] | HR 1.24 [0.94, 1.64] 1.7m vs 2.6m p=0.1353 | HR 1.02 [0.78, 1.33] 6.4m vs 6.0m p=0.9131 |
| Asiansc | 323 | 19.7% vs 8.7% [3.1%, 19.2%] | HR 0.83 [0.64, 1.08] 2.9m vs 2.8m p=0.1746 | HR 1.04 [0.80, 1.35] 10.4m vs 12.2m p=0.7711 |
| Non-Asians | 1143 | 6.2% vs 7.3% [-4.3%, 2.0%] | HR 1.12 [0.98, 1.28] 2.0m vs 2.7m p=0.1041 | HR 1.01 [0.89, 1.14] 6.9m vs 6.9m p=0.9259 |
a Values presented are for IRESSA versus docetaxel.
b “m” is medians in months. Numbers in square brackets are 96% confidence interval for overall survival HR in the overall population, or otherwise 95% confidence intervals for HR
c Confidence interval entirely below non-inferiority margin of 1.154
N Number of patients randomised.
HR Hazard ratio (hazard ratios <1 favour IRESSA)
Figures 1 and 2. Efficacy outcomes in subgroups of non-Asian patients in the INTEREST study (N patients = Number of patients randomised):
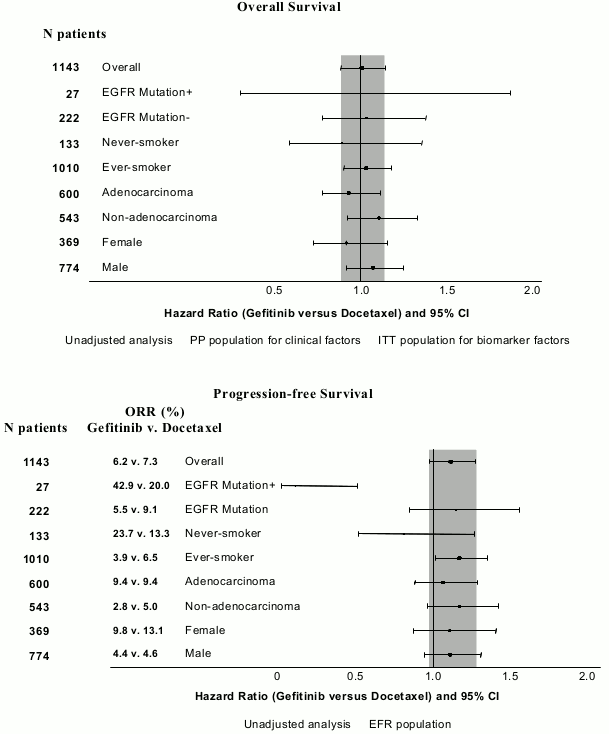
The randomised phase III ISEL study was conducted in patients with advanced NSCLC who had received 1 or 2 prior chemotherapy regimens and were refractory or intolerant to their most recent regimen. Gefitinib plus best supportive care was compared to placebo plus best supportive care. IRESSA did not prolong survival in the overall population. Survival outcomes differed by smoking status and ethnicity (see Table 6).
Table 6. Efficacy outcomes for gefitinib versus placebo from the ISEL study:
| Population | N | Objective response rates and 95% CI for difference between treatmentsa | Time to treatment failurea,b | Primary endpoint overall survivala,b,c |
|---|---|---|---|---|
| Overall | 1692 | 8.0% vs 1.3% [4.7%, 8.8%] | HR 0.82 [0.73, 0.92] 3.0m vs 2.6m p=0.0006 | HR 0.89 [0.77, 1.02] 5.6m vs 5.1m p=0.0871 |
| EGFR mutation-positive | 26 | 37.5% vs 0% [-15.1%, 61.4%] | HR 0.79 [0.20, 3.12] 10.8m vs 3.8m p=0.7382 | HR NC NR vs 4.3m |
| EGFR mutation-negative | 189 | 2.6% vs 0% [-5.6%, 7.3%] | HR 1.10 [0.78, 1.56] 2.0m vs 2.6m p=0.5771 | HR 1.16 [0.79, 1.72] 3.7m vs 5.9m p=0.4449 |
| Never smoker | 375 | 18.1% vs 0% [12.3%, 24.0%] | HR 0.55 [0.42, 0.72] 5.6m vs 2.8m p<0.0001 | HR 0.67 [0.49, 0.92] 8.9m vs 6.1m p=0.0124 |
| Ever smoker | 1317 | 5.3% vs 1.6% [1.4%, 5.7%] | HR 0.89 [0.78, 1.01] 2.7m vs 2.6m p=0.0707 | HR 0.92 [0.79, 1.06] 5.0m vs 4.9m p=0.2420 |
| Asiansd | 342 | 12.4% vs 2.1% [4.0%, 15.8%] | HR 0.69 [0.52, 0.91] 4.4m vs 2.2m p=0.0084 | HR 0.66 [0.48, 0.91] 9.5m vs 5.5m p=0.0100 |
| Non-Asians | 1350 | 6.8% vs 1.0% [3.5%, 7.9%] | HR 0.86 [0.76, 0.98] 2.9m vs 2.7m p=0.0197 | HR 0.92 [0.80, 1.07] 5.2m vs 5.1m p=0.2942 |
a Values presented are for IRESSA versus placebo.
b “m” is medians in months. Numbers in square brackets are 95% confidence intervals for HR
c Stratified log-rank test for overall; otherwise cox proportional hazards model
d Asian ethnicity excludes patients of Indian origin and refers to the racial origin of a patient group and not necessarily their place of birth
N Number of patients randomised
NC Not calculated for overall survival HR as the number of events is too few
NR Not reached
HR Hazard ratio (hazard ratios <1 favour IRESSA)
The IFUM study was a single-arm, multicentre study conducted in Caucasian patients (n=106) with activating, sensitising EGFR mutation positive NSCLC to confirm that the activity of gefitinib is similar in Caucasian and Asian populations. The ORR according to investigator review was 70% and the median PFS was 9.7 months. These data are similar to those reported in the IPASS study.
EGFR mutation status and clinical characteristics
Clinical characteristics of never smoker, adenocarcinoma histology, and female gender have been shown to be independent predictors of positive EGFR mutation status in a multivariate analysis of 786 Caucasian patients from gefitinib studies* (see Table 7). Asian patients also have a higher incidence of EGFR mutation-positive tumours.
Table 7. Summary of multivariate logistic regression analysis to identify factors that independently predicted for the presence of EGFR mutations in 786 Caucasian patients*:
| Factors that predicted for presence of EGFR mutation | p-value | Odds of EGFR mutation | Positive predictive value (9.5% of the overall population are EGFR mutation-positive (M+)) |
|---|---|---|---|
| Smoking status | <0.0001 | 6.5 times higher in never smokers than ever-smokers | 28/70 (40%) of never smokers are M+ |
| 47/716 (7%) of ever smokers are M+ | |||
| Histology | <0.0001 | 4.4 times higher in adenocarcinoma than in non-adenocarcinoma | 63/396 (16%) of patients with adenocarcinoma histology are M+ |
| 12/390 (3%) of patients with non-adenocarcinoma histology are M+ | |||
| Gender | 0.0397 | 1.7times higher in females than males | 40/235 (17%) of females are M+ |
| 35/551 (6%) of males are M+ |
* from the following studies: INTEREST, ISEL, INTACT 1&2, IDEAL 1&2, INVITE
Pharmacokinetic properties
Absorption
Following oral administration of gefitinib, absorption is moderately slow and peak plasma concentrations of gefitinib typically occur at 3 to 7 hours after administration. Mean absolute bioavailability is 59% in cancer patients. Exposure to gefitinib is not significantly altered by food. In a trial in healthy volunteers where gastric pH was maintained above pH 5, gefitinib exposure was reduced by 47%, likely due to impaired solubility of gefitinib in the stomach (see sections 4.4 and 4.5).
Distribution
Gefitinib has a mean steady-state volume of distribution of 1400 l indicating extensive distribution into tissue. Plasma protein binding is approximately 90%. Gefitinib binds to serum albumin and alpha 1-acid glycoprotein.
In vitro data indicate that gefitinib is a substrate for the membrane transport protein P-gp.
Biotransformation
In vitro data indicate that CYP3A4 and CYP2D6 are the major P450 isozyme involved in the oxidative metabolism of gefitinib.
In vitro studies have shown that gefitinib has limited potential to inhibit CYP2D6. Gefitinib shows no enzyme induction effects in animal studies and no significant inhibition (in vitro) of any other cytochrome P450 enzyme.
Gefitinib is extensively metabolised in humans. Five metabolites have been fully identified in excreta and 8 metabolites in plasma. The major metabolite identified was O-desmethyl gefitinib, which is 14-fold less potent than gefitinib at inhibiting EGFR stimulated cell growth and has no inhibitory effect on tumour cell growth in mice. It is therefore considered unlikely that it contributes to the clinical activity of gefitinib.
The formation of O-desmethyl gefitinib has been shown, in vitro, to be via CYP2D6. The role of CYP2D6 in the metabolic clearance of gefitinib has been evaluated in a clinical trial in healthy volunteers genotyped for CYP2D6 status. In poor metabolisers no measurable levels of O-desmethyl gefitinib were produced. The levels of exposure to gefitinib achieved in both the extensive and the poor metaboliser groups were wide and overlapping but the mean exposure to gefitinib was 2-fold higher in the poor metaboliser group. The higher average exposures that could be achieved by individuals with no active CYP2D6 may be clinically relevant since adverse effects are related to dose and exposure.
Elimination
Gefitinib is excreted mainly as metabolites via the faeces, with renal elimination of gefitinib and metabolites accounting for less than 4% of the administered dose.
Gefitinib total plasma clearance is approximately 500 ml/min and the mean terminal half-life is 41 hours in cancer patients. Administration of gefitinib once daily results in 2- to 8-fold accumulation, with steady state exposures achieved after 7 to 10 doses. At steady state, circulating plasma concentrations are typically maintained within a 2- to 3-fold range over the 24-hour dosing interval.
Special populations
From analyses of population pharmacokinetic data in cancer patients, no relationships were identified between predicted steady-state trough concentration and patient age, body weight, gender, ethnicity or creatinine clearance (above 20 ml/min).
Hepatic impairment
In a phase I open-label study of single dose gefitinib 250 mg in patients with mild, moderate or severe hepatic impairment due to cirrhosis (according to Child-Pugh classification), there was an increase in exposure in all groups compared with healthy controls. An average 3.1-fold increase in exposure to gefitinib in patients with moderate and severe hepatic impairment was observed. None of the patients had cancer, all had cirrhosis and some had hepatitis. This increase in exposure may be of clinical relevance since adverse experiences are related to dose and exposure to gefitinib.
Gefitinib has been evaluated in a clinical trial conducted in 41 patients with solid tumours and normal hepatic function, or moderate or severe hepatic impairment (classified according to baseline Common Toxicity Criteria grades for AST, alkaline phosphatase and bilirubin) due to liver metastases. It was shown that following daily administration of 250 mg gefitinib, time to steady-state, total plasma clearance (CmaxSS) and steady-state exposure (AUC24SS) were similar for the groups with normal and moderately impaired hepatic function. Data from 4 patients with severe hepatic impairment due to liver metastases suggested that steady-state exposures in these patients are also similar to those in patients with normal hepatic function.
Preclinical safety data
Adverse reactions not observed in clinical studies, but seen in animals at exposure levels similar to the clinical exposure levels and with possible relevance to clinical use were as follows:
- Corneal epithelia atrophy and corneal translucencies
- Renal papillary necrosis
- Hepatocellular necrosis and eosinophilic sinusoidal macrophage infiltration
Data from non-clinical (in vitro) studies indicate that gefitinib has the potential to inhibit the cardiac action potential repolarisation process (e.g. QT interval). Clinical experience has not shown a causal association between QT prolongation and gefitinib.
A reduction in female fertility was observed in the rat at a dose of 20 mg/kg/day.
Published studies have shown that genetically modified mice, lacking expression of EGFR, exhibit developmental defects, related to epithelial immaturity in a variety of organs including the skin, gastrointestinal tract and lung. When gefitinib was administered to rats during organogenesis, there were no effects on embryofoetal development at the highest dose (30 mg/kg/day). However, in the rabbit, there were reduced foetal weights at 20 mg/kg/day and above. There were no compound-induced malformations in either species. When administered to the rat throughout gestation and parturition, there was a reduction in pup survival at a dose of 20 mg/kg/day.
Following oral administration of C-14 labelled gefitinib to lactating rats 14 days post-partum, concentrations of radioactivity in milk were 11-19 fold higher than in blood.
Gefitinib showed no genotoxic potential.
A 2-year carcinogenicity study in rats resulted in a small but statistically significant increased incidence of hepatocellular adenomas in both male and female rats and mesenteric lymph node haemangiosarcomas in female rats at the highest dose (10 mg/kg/day) only. The hepatocellular adenomas were also seen in a 2-year carcinogenicity study in mice, which demonstrated a small increased incidence of this finding in male mice at the mid dose, and in both male and female mice at the highest dose. The effects reached statistical significance for the female mice, but not for the males. At no-effect levels in both mice and rats there was no margin in clinical exposure. The clinical relevance of these findings is unknown.
The results of an in vitro phototoxicity study demonstrated that gefitinib may have phototoxicity potential.
© All content on this website, including data entry, data processing, decision support tools, "RxReasoner" logo and graphics, is the intellectual property of RxReasoner and is protected by copyright laws. Unauthorized reproduction or distribution of any part of this content without explicit written permission from RxReasoner is strictly prohibited. Any third-party content used on this site is acknowledged and utilized under fair use principles.