JARDIANCE Film-coated tablet Ref.[7237] Active ingredients: Empagliflozin
Source: European Medicines Agency (EU) Revision Year: 2023 Publisher: Boehringer Ingelheim International GmbH, Binger Str. 173, 55216 Ingelheim am Rhein, Germany
Pharmacodynamic properties
Pharmacotherapeutic group: Drugs used in diabetes, Other blood glucose lowering drugs, excl. insulins
ATC code: A10BK03
Mechanism of action
Empagliflozin is a reversible, highly potent (IC50 of 1.3 nmol) and selective competitive inhibitor of sodium-glucose co-transporter 2 (SGLT2). Empagliflozin does not inhibit other glucose transporters important for glucose transport into peripheral tissues and is 5000 times more selective for SGLT2 versus SGLT1, the major transporter responsible for glucose absorption in the gut. SGLT2 is highly expressed in the kidney, whereas expression in other tissues is absent or very low. It is responsible, as the predominant transporter, for the reabsorption of glucose from the glomerular filtrate back into the circulation. In patients with type 2 diabetes and hyperglycaemia a higher amount of glucose is filtered and reabsorbed.
Empagliflozin improves glycaemic control in patients with type 2 diabetes by reducing renal glucose reabsorption. The amount of glucose removed by the kidney through this glucuretic mechanism is dependent on blood glucose concentration and GFR. Inhibition of SGLT2 in patients with type 2 diabetes and hyperglycaemia leads to excess glucose excretion in the urine. In addition, initiation of empagliflozin increases excretion of sodium resulting in osmotic diuresis and reduced intravascular volume.
In patients with type 2 diabetes, urinary glucose excretion increased immediately following the first dose of empagliflozin and is continuous over the 24 hour dosing interval. Increased urinary glucose excretion was maintained at the end of the 4-week treatment period, averaging approximately 78 g/day. Increased urinary glucose excretion resulted in an immediate reduction in plasma glucose levels in patients with type 2 diabetes.
Empagliflozin improves both fasting and post-prandial plasma glucose levels. The mechanism of action of empagliflozin is independent of beta cell function and insulin pathway and this contributes to a low risk of hypoglycaemia. Improvement of surrogate markers of beta cell function including Homeostasis Model Assessment-β (HOMA-β) was noted. In addition, urinary glucose excretion triggers calorie loss, associated with body fat loss and body weight reduction. The glucosuria observed with empagliflozin is accompanied by diuresis which may contribute to sustained and moderate reduction of blood pressure.
Empagliflozin also reduces sodium reabsorption and increases the delivery of sodium to the distal tubule. This may influence several physiological functions including, but not restricted to: increasing tubuloglomerular feedback and reducing intraglomerular pressure, lowering both pre- and afterload of the heart, downregulating of sympathetic activity and reducing left ventricular wall stress as evidenced by lower NT-proBNP values which may have beneficial effects on cardiac remodeling, filling pressures and diastolic function as well as preserving kidney structure and function. Other effects such as an increase in haematocrit, a reduction in body weight and blood pressure may further contribute to the beneficial cardiac and renal effects.
Clinical efficacy and safety
Type 2 diabetes mellitus
Both improvement of glycaemic control and reduction of cardiovascular morbidity and mortality are an integral part of the treatment of type 2 diabetes.
Glycaemic efficacy and cardiovascular outcomes have been assessed in a total of 14,663 patients with type 2 diabetes who were treated in 12 double-blind, placebo- and active-controlled clinical studies, of which 9,295 received empagliflozin (empagliflozin 10 mg: 4,165 patients; empagliflozin 25 mg: 5,130 patients). Five studies had treatment durations of 24 weeks; extensions of those and other studies had patients exposed to empagliflozin for up to 102 weeks.
Treatment with empagliflozin as monotherapy and in combination with metformin, pioglitazone, a sulphonylurea, DPP-4 inhibitors, and insulin lead to clinically relevant improvements in HbA1c, fasting plasma glucose (FPG), body weight, and systolic and diastolic blood pressure. Administration of empagliflozin 25 mg resulted in a higher proportion of patients achieving HbA1c goal of less than 7% and fewer patients needing glycaemic rescue compared to empagliflozin 10 mg and placebo. Higher baseline HbA1c was associated with a greater reduction in HbA1c. In addition, empagliflozin as adjunct to standard care therapy reduced cardiovascular mortality in patients with type 2 diabetes and established cardiovascular disease.
Monotherapy
The efficacy and safety of empagliflozin as monotherapy was evaluated in a double-blind, placebo- and active-controlled study of 24 weeks duration in treatment-naïve patients. Treatment with empagliflozin resulted in a statistically significant (p<0.0001) reduction in HbA1c compared to placebo (Table 2) and a clinically meaningful decrease in FPG. In a prespecified analysis of patients (N=201) with a baseline HbA1c ≥8.5%, treatment resulted in a reduction in HbA1c from baseline of -1.44% for empagliflozin 10 mg, -1.43% for empagliflozin 25 mg, -1.04% for sitagliptin, and an increase of 0.01% for placebo. In the double-blind placebo-controlled extension of this study, reductions of HbA1c, body weight and blood pressure were sustained up to Week 76.
Table 2. Efficacy results of a 24 week placebo-controlled study of empagliflozin as monotherapya:
| Placebo | Jardiance | Sitagliptin | ||
|---|---|---|---|---|
| 10 mg | 25 mg | 100 mg | ||
| N | 228 | 224 | 224 | 223 |
| HbA1c (%) | ||||
| Baseline (mean) | 7.91 | 7.87 | 7.86 | 7.85 |
| Change from baseline1 | 0.08 | -0.66 | -0.78 | -0.66 |
| Difference from placebo1 (97.5% CI) | -0.74* (-0.90, -0.57) | -0.85* (-1.01, -0.69) | -0.73 (-0.88, -0.59)3 | |
| N | 208 | 204 | 202 | 200 |
| Patients (%) achieving HbA1c <7% with baseline HbA1c ≥7%2 | 12.0 | 35.3 | 43.6 | 37.5 |
| N | 228 | 224 | 224 | 223 |
| Body Weight (kg) | ||||
| Baseline (mean) | 78.23 | 78.35 | 77.80 | 79.31 |
| Change from baseline1 | -0.33 | -2.26 | -2.48 | 0.18 |
| Difference from placebo1 (97.5% CI) | -1.93* (-2.48, -1.38) | -2.15* (-2.70,-1.60) | 0.52 (-0.04, 1.00)3 | |
| N | 228 | 224 | 224 | 223 |
| SBP (mmHg)4 | ||||
| Baseline (mean) | 130.4 | 133.0 | 129.9 | 132.5 |
| Change from baseline1 | -0.3 | -2.9 | -3.7 | 0.5 |
| Difference from placebo1 (97.5% CI) | -2.6* (-5.2, -0.0) | -3.4* (-6.0, -0.9) | 0.8 (-1.4, 3.1)3 | |
a Full analysis set (FAS) using last observation carried forward (LOCF) prior to glycaemic rescue therapy
1 Mean adjusted for baseline value
2 Not evaluated for statistical significance as a result of the sequential confirmatory testing procedure
3 95% CI
4 LOCF, values after antihypertensive rescue censored
* p-value<0.0001
Combination therapy
Empagliflozin as add-on to metformin, sulphonylurea, pioglitazone:
Empagliflozin as add-on to metformin, metformin and a sulphonylurea, or pioglitazone with or without metformin resulted in statistically significant (p<0.0001) reductions in HbA1c and body weight compared to placebo (Table 3). In addition it resulted in a clinically meaningful reduction in FPG, systolic and diastolic blood pressure compared to placebo. In the double-blind placebo-controlled extension of these studies, reduction of HbA1c, body weight and blood pressure were sustained up to Week 76.
Table 3. Efficacy results of 24 week placebo-controlled studiesa:
| Add-on to metformin therapy | |||
| Placebo | Jardiance | ||
| 10 mg | 25 mg | ||
| N | 207 | 217 | 213 |
| HbA1c (%) | |||
| Baseline (mean) | 7.90 | 7.94 | 7.86 |
| Change from baseline1 | -0.13 | -0.70 | -0.77 |
| Difference from placebo1 (97.5% CI) | -0.57* (-0.72, -0.42) | -0.64* (-0.79, -0.48) | |
| N | 184 | 199 | 191 |
| Patients (%) achieving HbA1c <7% with baseline HbA1c ≥7%2 | 12.5 | 37.7 | 38.7 |
| N | 207 | 217 | 213 |
| Body Weight (kg) | |||
| Baseline (mean) | 79.73 | 81.59 | 82.21 |
| Change from baseline1 | -0.45 | -2.08 | -2.46 |
| Difference from placebo1 (97.5% CI) | -1.63* (-2.17, -1.08) | -2.01* (-2.56, -1.46) | |
| N | 207 | 217 | 213 |
| SBP (mmHg)2 | |||
| Baseline (mean) | 128.6 | 129.6 | 130.0 |
| Change from baseline1 | -0.4 | -4.5 | -5.2 |
| Difference from placebo1 (95% CI) | -4.1* (-6.2, -2.1) | -4.8* (-6.9, -2.7) | |
| Add-on to metformin and a sulphonylurea therapy | |||
| Placebo | Jardiance | ||
| 10 mg | 25 mg | ||
| N | 225 | 225 | 216 |
| HbA1c (%) | |||
| Baseline (mean) | 8.15 | 8.07 | 8.10 |
| Change from baseline1 | -0.17 | -0.82 | -0.77 |
| Difference from placebo1 (97.5% CI) | -0.64* (-0.79, -0.49) | -0.59* (-0.74, -0.44) | |
| N | 216 | 209 | 202 |
| Patients (%) achieving HbA1c <7% with baseline HbA1c ≥7%2 | 9.3 | 26.3 | 32.2 |
| N | 225 | 225 | 216 |
| Body Weight (kg) | |||
| Baseline (mean) | 76.23 | 77.08 | 77.50 |
| Change from baseline1 | -0.39 | -2.16 | -2.39 |
| Difference from placebo1 (97.5% CI) | -1.76* (-2.25, -1.28) | -1.99* (-2.48, -1.50) | |
| N | 225 | 225 | 216 |
| SBP (mmHg)2 | |||
| Baseline (mean) | 128.8 | 128.7 | 129.3 |
| Change from baseline1 | -1.4 | -4.1 | -3.5 |
| Difference from placebo1 (95% CI) | -2.7 (-4.6, -0.8) | -2.1 (-4.0, -0.2) | |
| Add-on to pioglitazone +/- metformin therapy | |||
| Placebo | Jardiance | ||
| 10 mg | 25 mg | ||
| N | 165 | 165 | 168 |
| HbA1c (%) | |||
| Baseline (mean) | 8.16 | 8.07 | 8.06 |
| Change from baseline1 | -0.11 | -0.59 | -0.72 |
| Difference from placebo1 (97.5% CI) | -0.48* (-0.69, -0.27) | -0.61* (-0.82, -0.40) | |
| N | 155 | 151 | 160 |
| Patients (%) achieving HbA1c <7% with baseline HbA1c ≥7%2 | 7.7 | 24 | 30 |
| N | 165 | 165 | 168 |
| Body Weight (kg) | |||
| Baseline (mean) | 78.1 | 77.97 | 78.93 |
| Change from baseline1 | 0.34 | -1.62 | -1.47 |
| Difference from placebo1 (97.5% CI) | -1.95* (-2.64, -1.27) | -1.81* (-2.49, -1.13) | |
| N | 165 | 165 | 168 |
| SBP (mmHg)3 | |||
| Baseline (mean) | 125.7 | 126.5 | 126 |
| Change from baseline1 | 0.7 | -3.1 | -4.0 |
| Difference from placebo1 (95% CI) | -3.9 (-6.23, -1.50) | -4.7 (-7.08, -2.37) | |
a Full analysis set (FAS) using last observation carried forward (LOCF) prior to glycaemic rescue therapy
1 Mean adjusted for baseline value
2 Not evaluated for statistical significance as a result of the sequential confirmatory testing procedure
3 LOCF, values after antihypertensive rescue censored
* p-value <0.0001
In combination with metformin in drug-naïve patients:
A factorial design study of 24 weeks duration was conducted to evaluate the efficacy and safety of empagliflozin in drug-naïve patients. Treatment with empagliflozin in combination with metformin (5 mg and 500 mg; 5 mg and 1000 mg; 12.5 mg and 500 mg, and 12.5 mg and 1000 mg given twice daily) provided statistically significant improvements in HbA1c (Table 4) and led to greater reductions in FPG (compared to the individual components) and body weight (compared to metformin).
Table 4. Efficacy results at 24 week comparing empagliflozin in combination with metformin to the individual componentsa:
| Empagliflozin 10 mgb | Empagliflozin 25 mgb | Metforminc | ||||||
|---|---|---|---|---|---|---|---|---|
| + Met 1000 mgc | + Met 2000 mgc | No Met | + Met 1000 mgc | + Met 2000 mgc | No Met | 1000 mg | 2000 mg | |
| N | 161 | 167 | 169 | 165 | 169 | 163 | 167 | 162 |
| HbA1c (%) | ||||||||
| Baseline (mean) | 8.68 | 8.65 | 8.62 | 8.84 | 8.66 | 8.86 | 8.69 | 8.55 |
| Change from baseline1 | -1.98 | -2.07 | -1.35 | -1.93 | -2.08 | -1.36 | -1.18 | -1.75 |
| Comparison vs. empa (95% CI)1 | -0.63* (-0.86, -0.40) | -0.72* (-0.96, -0.49) | -0.57* (-0.81, -0.34) | -0.72* (-0.95, -0.48) | ||||
| Comparison vs. met (95% CI)1 | -0.79* (-1.03, -0.56) | -0.33* (-0.56, -0.09) | -0.75* (-0.98, -0.51) | -0.33* (-0.56, -0.10) | ||||
Met = metformin; empa = empagliflozin
1 mean adjusted for baseline value
a Analyses were performed on the full analysis set (FAS) using an observed cases (OC) approach
b Given in two equally divided doses per day when given together with metformin
c Given in two equally divided doses per day
* p≤0.0062 for HbA1c
Empagliflozin in patients inadequately controlled with metformin and linagliptin:
In patients inadequately controlled with metformin and linagliptin 5 mg, treatment with both empagliflozin 10 mg or 25 mg resulted in statistically significant (p<0.0001) reductions in HbA1c and body weight compared to placebo (Table 5). In addition it resulted in clinically meaningful reductions in FPG, systolic and diastolic blood pressure compared to placebo.
Table 5. Efficacy results of a 24 week placebo-controlled study in patients inadequately controlled with metformin and linagliptin 5 mg:
| Add-on to metformin and linagliptin 5 mg | |||
|---|---|---|---|
| Placebo5 | Empagliflozin6 | ||
| 10 mg | 25 mg | ||
| N | 106 | 109 | 110 |
| HbA1c (%)3 | |||
| Baseline (mean) | 7.96 | 7.97 | 7.97 |
| Change from baseline1 | 0.14 | -0.65 | -0.56 |
| Difference from placebo (95% CI) | -0.79* (-1.02, -0.55) | -0.70* (-0.93, -0.46) | |
| N | 100 | 100 | 107 |
| Patients (%) achieving HbA1c <7% with baseline HbA1c ≥7%2 | 7.0 | 37.0 | 32.7 |
| N | 106 | 109 | 110 |
| Body Weight (kg)3 | |||
| Baseline (mean) | 82.3 | 88.4 | 84.4 |
| Change from baseline1 | -0.3 | -3.1 | -2.5 |
| Difference from placebo (95% CI) | -2.8* (-3.5, -2.1) | -2.2* (-2.9, -1.5) | |
| N | 106 | 109 | 110 |
| SBP (mmHg)4 | |||
| Baseline (mean) | 130.1 | 130.4 | 131.0 |
| Change from baseline1 | -1.7 | -3.0 | -4.3 |
| Difference from placebo (95% CI) | -1.3 (-4.2, 1.7) | -2.6 (-5.5, 0.4) | |
1 Mean adjusted for baseline value
2 Not evaluated for statistical significance; not part of sequential testing procedure for the secondary endpoints
3 MMRM model on FAS (OC) included baseline HbA1c, baseline eGFR (MDRD), geographical region, visit, treatment, and treatment by visit interaction. For weight, baseline weight was included.
4 MMRM model included baseline SBP and baseline HbA1c as linear covariate(s), and baseline eGFR, geographical region, treatment, visit, and visit by treatment interaction as fixed effects.
5 Patients randomized to the placebo group were receiving the placebo plus linagliptin 5 mg with background metformin
6 Patients randomized to the empagliflozin 10 mg or 25 mg groups were receiving empagliflozin 10 mg or 25 mg and linagliptin 5 mg with background metformin
* p-value <0.0001
In a prespecified subgroup of patients with baseline HbA1c greater or equal than 8.5% the reduction from baseline in HbA1c was -1.3% with empagliflozin 10 mg or 25 mg at 24 weeks (p<0.0001) compared to placebo.
Empagliflozin 24 months data, as add-on to metformin in comparison to glimepiride:
In a study comparing the efficacy and safety of empagliflozin 25 mg versus glimepiride (up to 4 mg per day) in patients with inadequate glycaemic control on metformin alone, treatment with empagliflozin daily resulted in superior reduction in HbA1c (Table 6), and a clinically meaningful reduction in FPG, compared to glimepiride. Empagliflozin daily resulted in a statistically significant reduction in body weight, systolic and diastolic blood pressure and a statistically significantly lower proportion of patients with hypoglycaemic events compared to glimepiride (2.5% for empagliflozin, 24.2% for glimepiride, p<0.0001).
Table 6. Efficacy results at 104 week in an active controlled study comparing empagliflozin to glimepiride as add-on to metformina:
| Empagliflozin 25 mg | Glimepirideb | ||||
|---|---|---|---|---|---|
| N | 765 | 780 | |||
| HbA1c (%) | |||||
| Baseline (mean) | 7.92 | 7.92 | |||
| Change from baseline1 | -0.66 | -0.55 | |||
| Difference from glimepiride1 (97.5% CI) | -0.11* (-0.20, -0.01) | ||||
| N | 690 | 715 | Patients (%) achieving HbA1c <7% with baseline HbA1c ≥7%2 | 33.6 | 30.9 |
| N | 765 | 780 | |||
| Body Weight (kg) | |||||
| Baseline (mean) | 82.52 | 83.03 | |||
| Change from baseline1 | -3.12 | 1.34 | |||
| Difference from glimepiride1 (97.5% CI) | -4.46** (-4.87, -4.05) | ||||
| N | 765 | 780 | |||
| SBP (mmHg)2 | |||||
| Baseline (mean) | 133.4 | 133.5 | |||
| Change from baseline1 | -3.1 | 2.5 | |||
| Difference from glimepiride1 (97.5% CI) | -5.6** (-7.0,-4.2) | ||||
a Full analysis set (FAS) using last observation carried forward (LOCF) prior to glycaemic rescue therapy
b Up to 4 mg glimepiride
1 Mean adjusted for baseline value
2 LOCF, values after antihypertensive rescue censored
* p-value <0.0001 for non-inferiority, and p-value =0.0153 for superiority
** p-value <0.0001
Add-on to insulin therapy:
Empagliflozin as add-on to multiple daily insulin:
The efficacy and safety of empagliflozin as add-on to multiple daily insulin with or without concomitant metformin therapy was evaluated in a double-blind, placebo-controlled trial of 52 weeks duration. During the initial 18 weeks and the last 12 weeks, the insulin dose was kept stable, but was adjusted to achieve pre-prandial glucose levels <100 mg/dl [5.5 mmol/l], and post-prandial glucose levels <140 mg/dl [7.8 mmol/l] between Weeks 19 and 40.
At Week 18, empagliflozin provided statistically significant improvement in HbA1c compared with placebo (Table 7).
At Week 52, treatment with empagliflozin resulted in a statistically significant decrease in HbA1c and insulin sparing compared with placebo and a reduction in FPG and body weight.
Table 7. Efficacy results at 18 and 52 weeks in a placebo-controlled study of empagliflozin as add on to multiple daily doses of insulin with or without metformin:
| Placebo | Jardiance | ||||||
|---|---|---|---|---|---|---|---|
| 10 mg | 25 mg | ||||||
| N | 188 | 186 | 189 | ||||
| HbA1c (%) at week 18 | |||||||
| Baseline (mean) | 8.33 | 8.39 | 8.29 | ||||
| Change from baseline1 | -0.50 | -0.94 | -1.02 | ||||
| Difference from placebo1 (97.5% CI) | -0.44* (-0.61, -0.27) | -0.52* (-0.69, -0.35) | |||||
| N | 115 | 119 | 118 | ||||
| HbA1c (%) at week 522 | |||||||
| Baseline (mean) | 8.25 | 8.40 | 8.37 | Change from baseline1 | -0.81 | -1.18 | -1.27 |
| Difference from placebo1 (97.5% CI) | -0.38*** (-0.62, -0.13) | -0.46* (-0.70, -0.22) | |||||
| N | 113 | 118 | 118 | ||||
| Patients (%) achieving HbA1c <7% with baseline HbA1c ≥7% at week 52 | 26.5 | 39.8 | 45.8 | ||||
| N | 115 | 118 | 117 | ||||
| Insulin dose (IU/day) at week 52 | |||||||
| Baseline (mean) | 89.94 | 88.57 | 90.38 | ||||
| Change from baseline1 | 10.16 | 1.33 | -1.06 | ||||
| Difference from placebo1 (97.5% CI) | -8.83 (-15.69, -1.97) | -11.22** (-18.09, -4.36) | |||||
| N | 115 | 119 | 118 | ||||
| Body Weight (kg) at week 522 | |||||||
| Baseline (mean) | 96.34 | 96.47 | 95.37 | Change from baseline1 | 0.44 | -1.95 | -2.04 |
| Difference from placebo1 (97.5% CI) | -2.39* (-3.54, -1.24) | -2.48* (-3.63, -1.33) | |||||
1 Mean adjusted for baseline value
2 Week 19-40: treat-to-target regimen for insulin dose adjustment to achieve pre-defined glucose target levels (pre-prandial <100 mg/dl (5.5 mmol/l), post-prandial <140 mg/dl (7.8 mmol/l)
* p-value <0.0001
** p-value =0.0003
*** p-value =0.0005
# p-value =0.0040
Empagliflozin as add-on to basal insulin
The efficacy and safety of empagliflozin as add-on to basal insulin with or without metformin and/or a sulphonylurea was evaluated in a double-blind, placebo-controlled trial of 78 weeks duration. During the initial 18 weeks the insulin dose was kept stable, but was adjusted to achieve a FPG <110 mg/dl in the following 60 weeks.
At week 18, empagliflozin provided statistically significant improvement in HbA1c (Table 8).
At 78 weeks, empagliflozin resulted in a statistically significant decrease in HbA1c and insulin sparing
Table 8. Efficacy results at 18 and 78 weeks in a placebo-controlled study of empagliflozin as add-on to basal insulin with or without metformin or a sulphonylureaa:
| Placebo | Empagliflozin 10 mg | Empagliflozin 25 mg | |||||
|---|---|---|---|---|---|---|---|
| N | 125 | 132 | 117 | ||||
| HbA1c (%) at week 18 | |||||||
| Baseline (mean) | 8.10 | 8.26 | 8.34 | ||||
| Change from baseline1 | -0.01 | -0.57 | -0.71 | ||||
| Difference from placebo1 (97.5% CI) | -0.56* (-0.78, -0.33) | -0.70* (-0.93, -0.47) | |||||
| N | 112 | 127 | 110 | ||||
| HbA1c (%) at week 78 | |||||||
| Baseline (mean) | 8.09 | 8.27 | 8.29 | ||||
| Change from baseline1 | -0.02 | -0.48 | -0.64 | ||||
| Difference from placebo1 (97.5% CI) | -0.46* (-0.73, -0.19) | -0.62* (-0.90, -0.34) | |||||
| N | 112 | 127 | 110 | ||||
| Basal insulin dose (IU/day) at week 78 | |||||||
| Baseline (mean) | 47.84 | 45.13 | 48.43 | Change from baseline1 | 5.45 | -1.21 | -0.47 |
| Difference from placebo1 (97.5% CI) | -6.66** (-11.56, -1.77) | -5.92** (-11.00, -0.85) | |||||
a Full analysis set (FAS) - Completers using last observation carried forward (LOCF) prior to glycaemic rescue therapy
1 mean adjusted for baseline value
* p-value <0.0001
** p-value <0.025
Patients with renal impairment, 52 week placebo controlled data:
The efficacy and safety of empagliflozin as add-on to antidiabetic therapy was evaluated in patients with renal impairment in a double-blind, placebo-controlled study for 52 weeks. Treatment with empagliflozin led to a statistically significant reduction of HbA1c (Table 9) and clinically meaningful improvement in FPG compared to placebo at Week 24. The improvement in HbA1c, body weight, and blood pressure was sustained up to 52 weeks. compared to placebo. Furthermore, empagliflozin resulted in a reduction in FPG, body weight, and blood pressure.
Table 9. Results at 24 week in a placebo-controlled study of empagliflozin in renally impaired type 2 diabetes patientsa:
| Placebo | Empagliflozin 10 mg | Empagliflozin 25 mg | Placebo | Empagliflozin 25 mg | |
|---|---|---|---|---|---|
| eGFR ≥60 to <90 ml/min/1.73 m² | eGFR ≥30 to <60 ml/min/1.73 m² | ||||
| N | 95 | 98 | 97 | 187 | 187 |
| HbA1c (%) | |||||
| Baseline (mean) | 8.09 | 8.02 | 7.96 | 8.04 | 8.03 |
| Change from baseline1 | 0.06 | -0.46 | -0.63 | 0.05 | -0.37 |
| Difference from placebo1 (95% CI) | -0.52* (-0.72, -0.32) | -0.68* (-0.88, -0.49) | -0.42* (-0.56, -0.28) | ||
| N | 89 | 94 | 91 | 178 | 175 |
| Patients (%) achieving HbA1c <7% with baseline HbA1c ≥7%2 | 6.7 | 17.0 | 24.2 | 7.9 | 12.0 |
| N | 95 | 98 | 97 | 187 | 187 |
| Body Weight (kg)2 | |||||
| Baseline (mean) | 86.00 | 92.05 | 88.06 | 82.49 | 83.22 |
| Change from baseline1 | -0.33 | -1.76 | -2.33 | -0.08 | -0.98 |
| Difference from placebo1 (95% CI) | -1.43 (-2.09, -0.77) | -2.00 (-2.66, -1.34) | -0.91 (-1.41, -0.41) | ||
| N | 95 | 98 | 97 | 187 | 187 |
| SBP (mmHg)2 | |||||
| Baseline (mean) | 134.69 | 137.37 | 133.68 | 136.38 | 136.64 |
| Change from baseline1 | 0.65 | -2.92 | -4.47 | 0.40 | -3.88 |
| Difference from placebo1 (95% CI) | -3.57 (-6.86, -0.29) | -5.12 (-8.41, -1.82) | -4.28 (-6.88, -1.68) | ||
a Full analysis set (FAS) using last observation carried forward (LOCF) prior to glycaemic rescue therapy
1 Mean adjusted for baseline value
2 Not evaluated for statistical significance as a result of the sequential confirmatory testing procedure
* p<0.0001
Cardiovascular outcome:
The double-blind, placebo-controlled EMPA-REG OUTCOME study compared pooled doses of empagliflozin 10 mg and 25 mg with placebo as adjunct to standard care therapy in patients with type 2 diabetes and established cardiovascular disease. A total of 7020 patients were treated (empagliflozin 10 mg: 2345, empagliflozin 25 mg: 2342, placebo: 2333) and followed for a median of 3.1 years. The mean age was 63 years, the mean HbA1c was 8.1%, and 71.5% were male. At baseline, 74% of patients were being treated with metformin, 48% with insulin, and 43% with a sulfonylurea. About half of the patients (52.2%) had an eGFR of 60-90 ml/min/1.73 m², 17.8% of 45-60 ml/min/1.73 m² and 7.7% of 30-45 ml/min/1.73 m².
At week 12, an adjusted mean (SE) improvement in HbA1c when compared to baseline of 0.11% (0.02) in the placebo group, 0.65% (0.02) and 0.71% (0.02) in the empagliflozin 10 and 25 mg groups was observed. After the first 12 weeks glycaemic control was optimized independent of investigative treatment. Therefore the effect was attenuated at week 94, with an adjusted mean (SE) improvement in HbA1c of 0.08% (0.02) in the placebo group, 0.50% (0.02) and 0.55% (0.02) in the empagliflozin 10 and 25 mg groups.
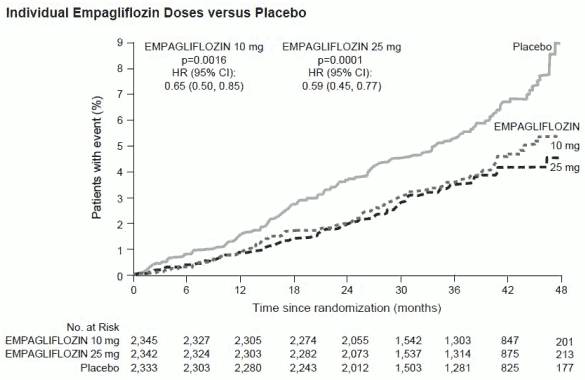
Empagliflozin was superior in preventing the primary combined endpoint of cardiovascular death, non-fatal myocardial infarction, or non-fatal stroke, as compared with placebo. The treatment effect was driven by a significant reduction in cardiovascular death with no significant change in non-fatal myocardial infarction, or non-fatal stroke. The reduction of cardiovascular death was comparable for empagliflozin 10 mg and 25 mg (Figure 1) and confirmed by an improved overall survival (Table 10).
The efficacy for preventing cardiovascular mortality has not been conclusively established in patients using empagliflozin concomitantly with DPP-4 inhibitors or in Black patients because the representation of these groups in the EMPA-REG OUTCOME study was limited.
Table 10. Treatment effect for the primary composite endpoint, its components and mortalitya:
| Placebo | Empagliflozinb | |
|---|---|---|
| N | 2333 | 4687 |
| Time to first event of CV death, non-fatal MI, or non-fatal stroke N (%) | 282 (12.1) | 490 (10.5) |
| Hazard ratio vs. placebo (95.02% CI)* | 0.86 (0.74, 0.99) | |
| p−value for superiority | 0.0382 | |
| CV Death N (%) | 137 (5.9) | 172 (3.7) |
| Hazard ratio vs. placebo (95% CI) | 0.62 (0.49, 0.77) | |
| p-value | <0.0001 | |
| Non-fatal MI N (%) | 121 (5.2) | 213 (4.5) |
| Hazard ratio vs. placebo (95% CI) | 0.87 (0.70, 1.09) | |
| p−value | 0.2189 | |
| Non-fatal stroke N (%) | 60 (2.6) | 150 (3.2) |
| Hazard ratio vs. placebo (95% CI) | 1.24 (0.92, 1.67) | |
| p−value | 0.1638 | |
| All-cause mortality N (%) | 194 (8.3) | 269 (5.7) |
| Hazard ratio vs. placebo (95% CI) | 0.68 (0.57, 0.82) | |
| p−value | <0.0001 | |
| Non-CV mortality N (%) | 57 (2.4) | 97 (2.1) |
| Hazard ratio vs. placebo (95% CI) | 0.84 (0.60, 1.16) |
CV = cardiovascular, MI = myocardial infarction
a Treated set (TS), i.e. patients who had received at least one dose of study drug
b Pooled doses of empagliflozin 10 mg and 25 mg
* Since data from the trial were included in an interim analysis, a two-sided 95.02% confidence interval applied which corresponds to a p-value of less than 0.0498 for significance.
Figure 1. Time to occurrence of cardiovascular death in the EMPA-REG OUTCOME study:
Heart failure requiring hospitalization
In the EMPA-REG OUTCOME study, empagliflozin reduced the risk of heart failure requiring hospitalization compared with placebo (empagliflozin 2.7 %; placebo 4.1 %; HR 0.65, 95 % CI 0.50, 0.85).
Nephropathy
In the EMPA-REG OUTCOME study, for time to first nephropathy event, the HR was 0.61 (95 % CI 0.53, 0.70) for empagliflozin (12.7 %) vs placebo (18.8 %).
In addition, empagliflozin showed a higher (HR 1.82, 95 % CI 1.40, 2.37) occurrence of sustained normo- or micro-albuminuria (49.7 %) in patients with baseline macro-albuminuria compared with placebo (28.8 %).
Fasting plasma glucose:
In four placebo-controlled studies, treatment with empagliflozin as monotherapy or add-on therapy to metformin, pioglitazone, or metformin plus a sulfonylurea resulted in mean changes from baseline in FPG of -20.5 mg/dl [-1.14 mmol/l] for empagliflozin 10 mg and -23.2 mg/dl [-1.29 mmol/l] for empagliflozin 25 mg compared to placebo (7.4 mg/dl [0.41 mmol/l]). This effect was observed after 24 weeks and maintained for 76 weeks.
2-hour post-prandial glucose:
Treatment with empagliflozin as add-on to metformin or metformin and a sulphonylurea resulted in a clinically meaningful reduction of 2-hour post-prandial glucose (meal tolerance test) at 24 weeks (add-on to metformin: placebo +5.9 mg/dl, empagliflozin 10 mg: -46.0 mg/dl, empagliflozin 25 mg: -44.6 mg/dl, add-on to metformin and a sulphonylurea: placebo -2.3 mg/dl, empagliflozin 10 mg: -35.7 mg/dl, empagliflozin 25 mg: -36.6 mg/dl).
Patients with high baseline HbA1c >10%:
In a pre-specified pooled analysis of three phase 3 studies, treatment with open-label empagliflozin 25 mg in patients with severe hyperglycaemia (N=184, mean baseline HbA1c 11.15%) resulted in a clinically meaningful reduction in HbA1c from baseline of 3.27% at week 24; no placebo or empagliflozin 10 mg arms were included in these studies.
Body weight:
In a pre-specified pooled analysis of 4 placebo controlled studies, treatment with empagliflozin resulted in body weight reduction (-0.24 kg for placebo, -2.04 kg for empagliflozin 10 mg and -2.26 kg for empagliflozin 25 mg) at week 24 that was maintained up to week 52 (-0.16 kg for placebo, -1.96 kg for empagliflozin 10 mg and -2.25 kg for empagliflozin 25 mg).
Blood pressure:
The efficacy and safety of empagliflozin was evaluated in a double-blind, placebo controlled study of 12 weeks duration in patients with type 2 diabetes and high blood pressure on different antidiabetic and up to 2 antihypertensive therapies. Treatment with empagliflozin once daily resulted in statistically significant improvement in HbA1c, and 24 hour mean systolic and diastolic blood pressure as determined by ambulatory blood pressure monitoring (Table 11). Treatment with empagliflozin provided reductions in seated SBP and DBP.
Table 11. Efficacy results at 12 week in a placebo-controlled study of empagliflozin in patients with type 2 diabetes and uncontrolled blood pressurea:
| Placebo | Jardiance | ||||||
|---|---|---|---|---|---|---|---|
| 10 mg | 25 mg | ||||||
| N | 271 | 276 | 276 | ||||
| HbA1c (%) at week 121 | |||||||
| Baseline (mean) | 7.90 | 7.87 | 7.92 | ||||
| Change from baseline2 | 0.03 | -0.59 | -0.62 | ||||
| Difference from placebo2 (95% CI) | -0.62* (-0.72, -0.52) | -0.65* (-0.75, -0.55) | |||||
| 24 hour SBP at week 123 | |||||||
| Baseline (mean) | 131.72 | 131.34 | 131.18 | ||||
| Change from baseline4 | 0.48 | -2.95 | -3.68 | ||||
| Difference from placebo4 (95% CI) | -3.44* (-4.78, -2.09) | -4.16* (-5.50, -2.83) | |||||
| 24 hour DBP at week 123 | |||||||
| Baseline (mean) | 75.16 | 75.13 | 74.64 | Change from baseline5 | 0.32 | -1.04 | -1.40 |
| Difference from placebo5 (95% CI) | -1.36** (-2.15, -0.56) | -1.72* (-2.51, -0.93) | |||||
a Full analysis set (FAS)
1 LOCF, values after taking antidiabetic rescue therapy censored
2 Mean adjusted for baseline HbA1c, baseline eGFR, geographical region and number of antihypertensive medicinal products
3 LOCF, values after taking antidiabetic rescue therapy or changing antihypertensive rescue therapy censored
4 Mean adjusted for baseline SBP, baseline HbA1c, baseline eGFR, geographical region and number of antihypertensive medicinal products
5 Mean adjusted for baseline DBP, baseline HbA1c, baseline eGFR, geographical region and number of antihypertensive medicinal products
* p-value <0.0001
** p-value <0.001
In a pre-specified pooled analysis of 4 placebo-controlled studies, treatment with empagliflozin resulted in a reduction in systolic blood pressure (empagliflozin 10 mg: -3.9 mmHg; empagliflozin 25 mg: -4.3 mmHg) compared with placebo (-0.5 mmHg) and in diastolic blood pressure (empagliflozin 10 mg: -1.8 mmHg; empagliflozin 25 mg: -2.0 mmHg) compared with placebo (-0.5 mmHg) at week 24 that were maintained up to week 52.
Heart failure
Empagliflozin in patients with heart failure and reduced ejection fraction
A randomised, double-blind, placebo-controlled study (EMPEROR-Reduced) was conducted in 3 730 patients with chronic heart failure (New York Heart Association [NYHA] II-IV) and reduced ejection fraction (LVEF ≤40%) to evaluate the efficacy and safety of empagliflozin 10 mg once daily as adjunct to standard of care heart failure therapy. The primary endpoint was the time to adjudicated first event of either cardiovascular (CV) death or hospitalisation for heart failure (HHF). Occurrence of adjudicated HHF (first and recurrent) and eGFR (CKD-EPI)cr slope of change from baseline were included in the confirmatory testing. Heart Failure therapy at baseline included ACE inhibitors/angiotensin receptor blockers/angiotensin receptor-neprilysin inhibitor (88.3%), beta blockers (94.7%), mineralocorticoid receptor antagonists (71.3%) and diuretics (95.0%).
A total of 1 863 patients were randomised to empagliflozin 10 mg (placebo: 1 867) and followed for a median of 15.7 months. The study population consisted of 76.1% men and 23.9% women with a mean age of 66.8 years (range: 25-94 years), 26.8% were 75 years of age or older. 70.5% of the study population were White, 18.0% Asian and 6.9% Black/African American. At randomisation, 75.1% of patients were NYHA class II, 24.4% were class III and 0.5% were class IV. The mean LVEF was 27.5%. At baseline, the mean eGFR was 62.0 ml/min/1.73 m² and the median urinary albumin to
creatinine ratio (UACR) was 22 mg/g. About half of the patients (51.7%) had an eGFR of ≥60 ml/min/1.73 m², 24.1% of 45 to <60 ml/min/1.73 m², 18.6% of 30 to <45 ml/min/1.73 m² and 5.3% 20 to <30 ml/min/1.73 m².
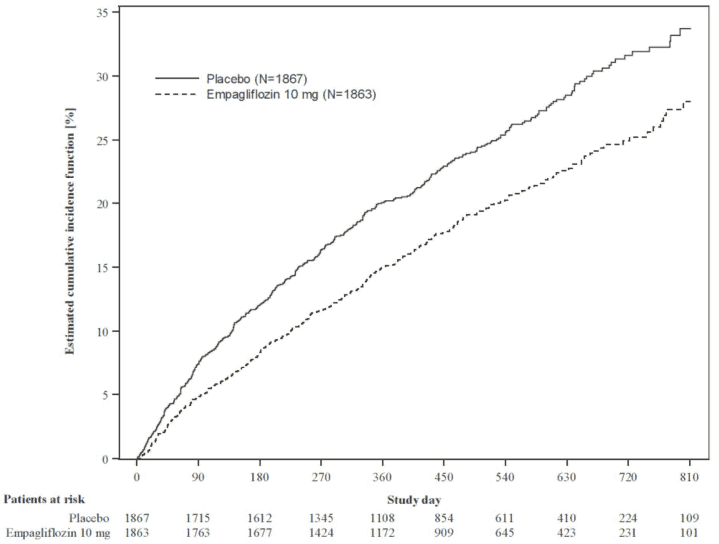
Empagliflozin was superior in reducing the risk of the primary composite endpoint of cardiovascular death or hospitalisation for heart failure compared with placebo. Additionally, empagliflozin significantly reduced the risk of occurrence of HHF (first and recurrent), and significantly reduced the rate of eGFR decline (Table 12; Figure 2).
Table 12. Treatment effect for the primary composite endpoint, its components and the two key secondary endpoints included in the pre-specified confirmatory testing:
| Placebo | Empagliflozin 10 mg | |
|---|---|---|
| N | 1 867 | 1 863 |
| Time to first event of CV death or HHF, N (%) | 462 (24.7) | 361 (19.4) |
| Hazard ratio vs. placebo (95% CI)* | 0.75 (0.65, 0.86) | |
| p−value for superiority | <0.0001 | |
| CV Death, N (%) | 202 (10.8) | 187 (10.0) |
| Hazard ratio vs. placebo (95% CI) | 0.92 (0.75, 1.12) | |
| HHF (first occurrence), N (%) | 342 (18.3) | 246 (13.2) |
| Hazard ratio vs. placebo (95% CI) | 0.69 (0.59, 0.81) | |
| HHF (first and recurrent), N of events | 553 | 388 |
| Hazard ratio vs. placebo (95% CI)* | 0.70 (0.58, 0.85) | |
| p−value | 0.0003 | |
| eGFR (CKD-EPI)cr slope**, Rate of decline (ml/min/1.73m²/year) | -2.28 | -0.55 |
| Treatment difference vs. placebo (95% CI) | 1.73 (1.10, 2.37) | |
| p-value | <0.0001 |
CV = cardiovascular, HHF = hospitalisation for heart failure, eGFR = Estimated glomerular filtration rate, CKD EPI = Chronic kidney disease epidemiology collaboration equation
* CV death and HHF events were adjudicated by an independent clinical event committee and analysed based on the randomised set.
** eGFR slope was analysed based on the treated set. Intercept is -0.95 ml/min/1.73 m² for placebo and -3.02 ml/min/1.73 m² for empagliflozin. The intercept represents the acute effect on eGFR while the slope represents the long-term effect.
Figure 2. Time to first event of adjudicated CV death or HHF:
The results of the primary composite endpoint were generally consistent with a hazard ratio (HR) below 1 across the pre-specified subgroups, including patients with heart failure, with or without type 2 diabetes mellitus and with or without renal impairment (down to an eGFR of 20 ml/min/1.73 m²).
Empagliflozin in patients with heart failure and preserved ejection fraction
A randomised, double-blind, placebo-controlled study (EMPEROR-Preserved) was conducted in 5 988 patients with chronic heart failure (NYHA II-IV) and preserved ejection fraction (LVEF >40%) to evaluate the efficacy and safety of empagliflozin 10 mg once daily as adjunct to standard of care therapy. The primary endpoint was the time to adjudicated first event of either cardiovascular (CV) death or hospitalisation for heart failure (HHF). Occurrence of adjudicated HHF (first and recurrent), and eGFR (CKD-EPI)cr slope of change from baseline were included in the confirmatory testing. Baseline therapy included ACE inhibitors/angiotensin receptor blockers/angiotensin receptorneprilysin inhibitor (80.7%), beta blockers (86.3%), mineralocorticoid receptor antagonists (37.5%) and diuretics (86.2%).
A total of 2 997 patients were randomised to empagliflozin 10 mg (placebo: 2 991) and followed for a median of 26.2 months. The study population consisted of 55.3% men and 44.7% women with a mean age of 71.9 years (range: 22-100 years), 43.0% were 75 years of age or older. 75.9% of the study population were White, 13.8% Asian and 4.3% Black/African American. At randomisation, 81.5% of patients were NYHA class II, 18.1% were class III and 0.3% were class IV. The EMPEROR-Preserved study population included patients with a LVEF <50% (33.1%), with a LVEF 50 to <60% (34.4%) and a LVEF ≥60% (32.5%). At baseline, the mean eGFR was 60.6 ml/min/1.73 m² and the median urinary albumin to creatinine ratio (UACR) was 21 mg/g. About half of the patients (50.1%) had an eGFR of ≥60 ml/min/1.73 m², 26.1% of 45 to <60 ml/min/1.73 m², 18.6% of 30 to <45 ml/min/1.73 m² and 4.9% 20 to <30 ml/min/1.73 m².
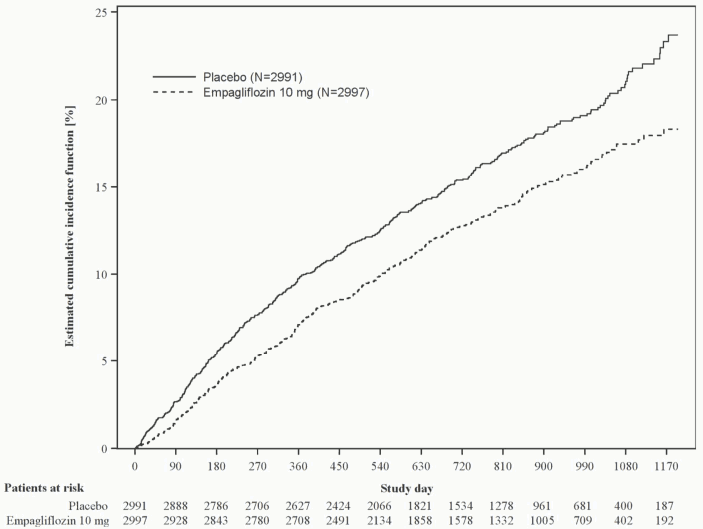
Empagliflozin was superior in reducing the risk of the primary composite endpoint of cardiovascular death or hospitalisation for heart failure compared with placebo. Additionally, empagliflozin significantly reduced the risk of occurrence of HHF (first and recurrent), and significantly reduced the rate of eGFR decline (Table 13; Figure 3).
Table 13. Treatment effect for the primary composite endpoint, its components and the two key secondary endpoints included in the pre-specified confirmatory testing:
| Placebo | Empagliflozin 10 mg | |
|---|---|---|
| N | 2 991 | 2 997 |
| Time to first event of CV death or HHF, N (%) | 511 (17.1) | 415 (13.8) |
| Hazard ratio vs. placebo (95% CI)* | 0.79 (0.69, 0.90) | |
| p−value for superiority | 0.0003 | |
| CV Death, N (%) | 244 (8.2) | 219 (7.3) |
| Hazard ratio vs. placebo (95% CI) | 0.91 (0.76, 1.09) | |
| HHF (first occurrence), N (%) | 352 (11.8) | 259 (8.6) |
| Hazard ratio vs. placebo (95% CI) | 0.71 (0.60, 0.83) | |
| HHF (first and recurrent), N of events | 541 | 407 |
| Hazard ratio vs. placebo (95% CI)* | 0.73 (0.61, 0.88) | |
| p−value | 0.0009 | |
| eGFR (CKD-EPI)cr slope**, Rate of decline (ml/min/1.73m²/year) | -2.62 | -1.25 |
| Treatment difference vs. placebo (95% CI) | 1.36 (1.06, 1.66) | |
| p-value | <0.0001 |
CV = cardiovascular, HHF = hospitalisation for heart failure, eGFR = Estimated glomerular filtration rate, CKD EPI = Chronic kidney disease epidemiology collaboration equation
* CV death and HHF events were adjudicated by an independent clinical event committee and analysed based on the randomised set.
** eGFR slope was analysed based on the treated set. Intercept is -0.18 ml/min/1.73 m² for placebo and -3.02 ml/min/1.73 m² for empagliflozin. The intercept represents the acute effect on eGFR while the slope represents the long-term effect.
Figure 3. Time to first event of adjudicated CV death or HHF:
The results of the primary composite endpoint were consistent across each of the pre-specified subgroups categorized by e.g., LVEF, diabetes status or renal function (down to an eGFR of 20 ml/min/1.73 m²).
Chronic kidney disease
A randomised, double-blind, placebo-controlled study of empagliflozin 10 mg once daily (EMPAKIDNEY) was conducted in 6 609 patients with chronic kidney disease (eGFR ≥20 - <45 ml/min/1.73 m²; or eGFR ≥45 - <90 ml/min/1.73 m² with urinary albumin to creatinine ratio (UACR) ≥200 mg/g) to assess cardio-renal outcomes as adjunct to standard of care therapy. The primary endpoint was the time to first occurrence of kidney disease progression (sustained ≥40% eGFR decline from randomisation, sustained eGFR <10 ml/min/1.73 m², end-stage kidney disease, or renal death) or CV death. First occurrence of hospitalisation for heart failure or CV death, all-cause hospitalisation (first and recurrent), and all-cause mortality were included in the confirmatory testing. Baseline therapy included an appropriate use of a RAS-inhibitor (85.2% ACE inhibitor or angiotensin receptor blocker).
A total of 3 304 patients were randomised to empagliflozin 10 mg (placebo: 3 305) and followed for a median of 24.3 months. The study population consisted of 66.8% men and 33.2% women with a mean age of 63.3 years (range: 18-94 years), 23.0% were 75 years of age or older. 58.4% of the study population were White, 36.2% Asian and 4.0% Black/African American.
At baseline, the mean eGFR was 37.3 ml/min/1.73 m², 21.2% patients had an eGFR of
≥45 ml/min/1.73 m², 44.3% of 30 to <45 ml/min/1.73 m² and 34.5% <30 ml/min/1.73 m² including 254 patients with an eGFR <20 ml/min /1.73 m². The median UACR was 329 mg/g, 20.1% patients had an UACR <30 mg/g, 28.2% had an UACR 30 to ≤300 mg/g and 51.7% had an UACR >300 mg/g; 41.1% of patients had an UACR <200 mg/g. Primary causes of CKD were diabetic nephropathy/diabetic kidney disease (31%), glomerular disease (25%), hypertensive/renovascular disease (22%) and other/unknown (22%).
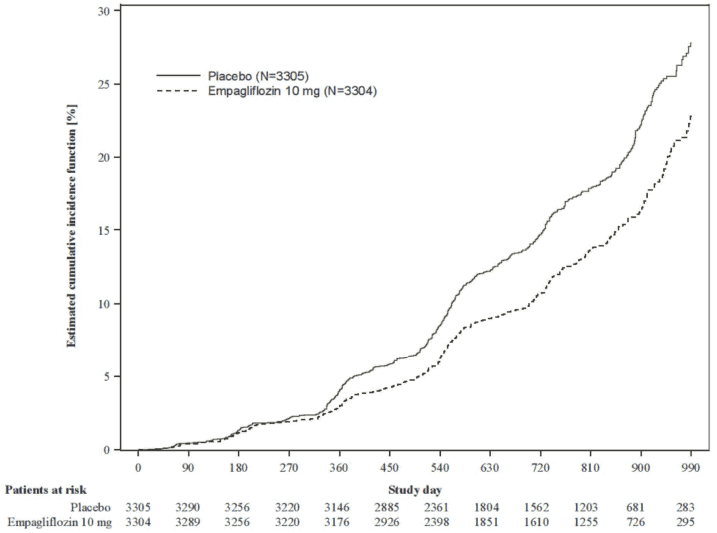
Empagliflozin was superior in reducing the risk of the primary composite endpoint of kidney disease progression or CV death compared with placebo (see Table 14). Additionally, empagliflozin significantly reduced the risk of all-cause hospitalisation (first and recurrent).
Table 14. Treatment effect for the primary composite and key secondary endpoints included in the prespecified confirmatory testing and its components:
| Placebo | Empagliflozin 10 mg | |
|---|---|---|
| N | 3 305 | 3 304 |
| Time to first occurrence of kidney disease progression (sustained ≥40% eGFR decline from randomisation, sustained eGFR <10 ml/min/1.73 m², end-stage kidney disease* (ESKD), or renal death) or CV death, N (%) | 558 (16.9) | 432 (13.1) |
| Hazard ratio vs. placebo (99.83% CI) | 0.72 (0.59, 0.89) | |
| p−value for superiority | <0.0001 | |
| Sustained ≥40% eGFR decline from randomisation, N (%) | 474 (14.3) | 359 (10.9) |
| Hazard ratio vs. placebo (95% CI) | 0.70 (0.61, 0.81) | |
| p-value | <0.0001 | |
| ESKD* or sustained eGFR <10 ml/min/1.73 m², N (%) | 221 (6.7) | 157 (4.8) |
| Hazard ratio vs. placebo (95% CI) | 0.69 (0.56, 0.84) | |
| p-value | 0.0003 | |
| Renal death, N (%)** | 4 (0.1) | 4 (0.1) |
| Hazard ratio vs. placebo (95% CI) | ||
| p-value | ||
| CV Death, N (%) | 69 (2.1) | 59 (1.8) |
| Hazard ratio vs. placebo (95% CI) | 0.84 (0.60, 1.19) | |
| p-value | 0.3366 | |
| ESKD or CV Death, N (%)# | 217 (6.6) | 163 (4.9) |
| Hazard ratio vs. placebo (95% CI) | 0.73 (0.59, 0.89) | |
| p-value | 0.0023 | |
| Occurrence of all-cause hospitalisation (first and recurrent), N of events | 1 895 | 1 611 |
| Hazard ratio vs. placebo (99.03% CI) | 0.86 (0.75, 0.98) | |
| p-value | 0.0025 |
CV = cardiovascular, HHF = hospitalisation for heart failure, eGFR = Estimated glomerular filtration rate
* End-stage kidney disease (ESKD) is defined as the initiation of maintenance dialysis or receipt of a kidney transplant.
** There were too few events of renal death to compute a reliable hazard ratio.
# Predefined as one of the two stopping criteria in the pre-planned interim analysis.
Figure 4. Time to first event of kidney disease progression or adjudicated CV death, estimated cumulative incidence function:
The results of the primary composite endpoint were generally consistent across the pre-specified subgroups, including eGFR categories, underlying cause of renal disease, diabetes status, or background use of RAS inhibitors. Treatment benefits were more clearly evident in patients with higher levels of albuminuria.
During treatment, eGFR decline over time was slower in the empagliflozin group compared to the placebo group (Figure 5). Empagliflozin slowed the annual rate of eGFR decline compared to placebo by 1.37 ml/min/1.73 m²/year (95% CI 1.16, 1.59), based on a pre-specified analysis of all eGFR measurements taken from the 2-month visit to the final follow-up visit. Patients treated with empagliflozin experienced an initial drop in eGFR which returned towards baseline after treatment discontinuation as demonstrated in several of the empagliflozin studies, supporting that haemodynamic changes play a role in the acute effects of empagliflozin on eGFR.
Figure 5. Change in eGFR over time*:
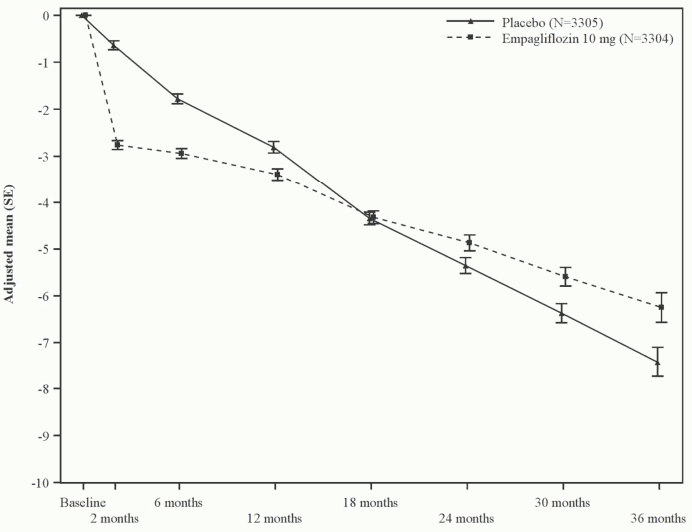
* eGFR (CKD-EPI) (ml/min/1.73 m²
Paediatric population
The European Medicines Agency has deferred the obligation to submit the results of studies with Jardiance in one or more subsets of the paediatric population in type 2 diabetes mellitus (see section 4.2 for information on paediatric use).
The European Medicines Agency has waived the obligation to submit the results of studies with Jardiance in all subsets of the paediatric population in heart failure (see section 4.2 for information on paediatric use).
The European Medicines Agency has waived the obligation to submit the results of studies with Jardiance in all subsets of the paediatric population in chronic kidney disease (see section 4.2 for information on paediatric use).
Pharmacokinetic properties
Absorption
The pharmacokinetics of empagliflozin have been extensively characterised in healthy volunteers and patients with type 2 diabetes. After oral administration, empagliflozin was rapidly absorbed with peak plasma concentrations occurring at a median tmax of 1.5 hours post-dose. Thereafter, plasma concentrations declined in a biphasic manner with a rapid distribution phase and a relatively slow terminal phase. The steady state mean plasma AUC and Cmax were 1870 nmol.h/l and 259 nmol/l with empagliflozin 10 mg and 4740 nmol.h/l and 687 nmol/l with empagliflozin 25 mg once daily. Systemic exposure of empagliflozin increased in a dose-proportional manner. The single-dose and steady-state pharmacokinetic parameters of empagliflozin were similar suggesting linear pharmacokinetics with respect to time. There were no clinically relevant differences in empagliflozin pharmacokinetics between healthy volunteers and patients with type 2 diabetes.
Administration of empagliflozin 25 mg after intake of a high-fat and high calorie meal resulted in slightly lower exposure; AUC decreased by approximately 16% and Cmax by approximately 37% compared to fasted condition. The observed effect of food on empagliflozin pharmacokinetics was not considered clinically relevant and empagliflozin may be administered with or without food.
Distribution
The apparent steady-state volume of distribution was estimated to be 73.8 l based on the population pharmacokinetic analysis. Following administration of an oral [14C]-empagliflozin solution to healthy volunteers, the red blood cell partitioning was approximately 37% and plasma protein binding was 86%.
Biotransformation
No major metabolites of empagliflozin were detected in human plasma and the most abundant metabolites were three glucuronide conjugates (2-, 3-, and 6-O glucuronide). Systemic exposure of each metabolite was less than 10% of total drug-related material. In vitro studies suggested that the primary route of metabolism of empagliflozin in humans is glucuronidation by the uridine 5'-diphospho-glucuronosyltransferases UGT2B7, UGT1A3, UGT1A8, and UGT1A9.
Elimination
Based on the population pharmacokinetic analysis, the apparent terminal elimination half-life of empagliflozin was estimated to be 12.4 hours and apparent oral clearance was 10.6 l/hour. The inter-subject and residual variabilities for empagliflozin oral clearance were 39.1% and 35.8%, respectively. With once-daily dosing, steady-state plasma concentrations of empagliflozin were reached by the fifth dose. Consistent with the half-life, up to 22% accumulation, with respect to plasma AUC, was observed at steady-state. Following administration of an oral [14C]-empagliflozin solution to healthy volunteers, approximately 96% of the drug-related radioactivity was eliminated in faeces (41%) or urine (54%). The majority of drug-related radioactivity recovered in faeces was unchanged parent drug and approximately half of drug related radioactivity excreted in urine was unchanged parent drug.
Special populations
Renal impairment
In patients with mild, moderate or severe renal impairment (eGFR <30 - <90 ml/min/1.73 m²) and patients with kidney failure/end stage renal disease (ESRD), AUC of empagliflozin increased by approximately 18%, 20%, 66%, and 48%, respectively compared to subjects with normal renal function. Peak plasma levels of empagliflozin were similar in subjects with moderate renal impairment and kidney failure/ESRD compared to patients with normal renal function. Peak plasma levels of empagliflozin were roughly 20% higher in subjects with mild and severe renal impairment as compared to subjects with normal renal function. The population pharmacokinetic analysis showed that the apparent oral clearance of empagliflozin decreased with a decrease in eGFR leading to an increase in drug exposure.
Hepatic impairment
In subjects with mild, moderate, and severe hepatic impairment according to the Child-Pugh classification, AUC of empagliflozin increased approximately by 23%, 47%, and 75% and Cmax by approximately 4%, 23%, and 48%, respectively, compared to subjects with normal hepatic function.
Body Mass Index
Body mass index had no clinically relevant effect on the pharmacokinetics of empagliflozin based on the population pharmacokinetic analysis. In this analysis, AUC was estimated to be 5.82%, 10.4%, and 17.3% lower in subjects with BMI of 30, 35, and 45 kg/m², respectively, compared to subjects with a body mass index of 25 kg/m².
Gender
Gender had no clinically relevant effect on the pharmacokinetics of empagliflozin based on the population pharmacokinetic analysis.
Race
In the population pharmacokinetic analysis, AUC was estimated to be 13.5% higher in Asians with a body mass index of 25 kg/m² compared to non-Asians with a body mass index of 25 kg/m².
Elderly
Age did not have a clinically meaningful impact on the pharmacokinetics of empagliflozin based on the population pharmacokinetic analysis.
Paediatric population
A paediatric Phase 1 study examined the pharmacokinetics and pharmacodynamics of empagliflozin (5 mg, 10 mg and 25 mg) in children and adolescents ≥10 to <18 years of age with type 2 diabetes mellitus. The observed pharmacokinetic and pharmacodynamic responses were consistent with those found in adult subjects.
Preclinical safety data
Non-clinical data reveal no special hazard for humans based on conventional studies of safety pharmacology, genotoxicity, fertility and early embryonic development.
In long term toxicity studies in rodents and dogs, signs of toxicity were observed at exposures greater than or equal to 10-times the clinical dose of empagliflozin. Most toxicity was consistent with secondary pharmacology related to urinary glucose loss and electrolyte imbalances including decreased body weight and body fat, increased food consumption, diarrhoea, dehydration, decreased serum glucose and increases in other serum parameters reflective of increased protein metabolism and gluconeogenesis, urinary changes such as polyuria and glucosuria, and microscopic changes including mineralisation in kidney and some soft and vascular tissues. Microscopic evidence of the effects of exaggerated pharmacology on the kidney observed in some species included tubular dilatation, and tubular and pelvic mineralisation at approximately 4-times the clinical AUC exposure of empagliflozin associated with the 25 mg dose.
Empagliflozin is not genotoxic.
In a 2 year carcinogenicity study, empagliflozin did not increase the incidence of tumours in female rats up to the highest dose of 700 mg/kg/day, which corresponds to approximately 72-times the maximal clinical AUC exposure to empagliflozin. In male rats, treatment-related benign vascular proliferative lesions (haemangiomas) of the mesenteric lymph node were observed at the highest dose, but not at 300 mg/kg/day, which corresponds to approximately 26-times the maximal clinical exposure to empagliflozin. Interstitial cell tumours in the testes were observed with a higher incidence in rats at 300 mg/kg/day and above, but not at 100 mg/kg/day which corresponds to approximately 18-times the maximal clinical exposure to empagliflozin. Both tumours are common in rats and are unlikely to be relevant to humans.
Empagliflozin did not increase the incidence of tumours in female mice at doses up to 1000 mg/kg/day, which corresponds to approximately 62-times the maximal clinical exposure to empagliflozin. Empagliflozin induced renal tumours in male mice at 1000 mg/kg/day, but not at 300 mg/kg/day, which corresponds to approximately 11-times the maximal clinical exposure to empagliflozin. The mode of action for these tumours is dependent on the natural predisposition of the male mouse to renal pathology and a metabolic pathway not reflective of humans. The male mouse renal tumours are considered not relevant to humans.
At exposures sufficiently in excess of exposure in humans after therapeutic doses, empagliflozin had no adverse effects on fertility or early embryonic development. Empagliflozin administered during the period of organogenesis was not teratogenic. Only at maternally toxic doses, empagliflozin also caused bent limb bones in the rat and increased embryofetal loss in the rabbit.
In pre- and postnatal toxicity studies in rats, reduced weight gain of offspring was observed at maternal exposures approximately 4-times the maximal clinical exposure to empagliflozin. No such effect was seen at systemic exposure equal to the maximal clinical exposure to empagliflozin. The relevance of this finding to humans is unclear.
In a juvenile toxicity study in the rat, when empagliflozin was administered from postnatal day 21 until postnatal day 90, non-adverse, minimal to mild renal tubular and pelvic dilation in juvenile rats was seen only at 100 mg/kg/day, which approximates 11-times the maximum clinical dose of 25 mg. These findings were absent after a 13 weeks drug-free recovery period.
© All content on this website, including data entry, data processing, decision support tools, "RxReasoner" logo and graphics, is the intellectual property of RxReasoner and is protected by copyright laws. Unauthorized reproduction or distribution of any part of this content without explicit written permission from RxReasoner is strictly prohibited. Any third-party content used on this site is acknowledged and utilized under fair use principles.