Source: FDA, National Drug Code (US) Revision Year: 2020
JUXTAPID directly binds and inhibits microsomal triglyceride transfer protein (MTP), which resides in the lumen of the endoplasmic reticulum, thereby preventing the assembly of apo B-containing lipoproteins in enterocytes and hepatocytes. This inhibits the synthesis of chylomicrons and VLDL. The inhibition of the synthesis of VLDL leads to reduced levels of plasma LDL-C.
At a concentration 23 times the Cmax of the maximum recommended dose, lomitapide does not prolong QTc to any clinically relevant extent.
Upon oral administration of a single 60-mg dose of JUXTAPID, the lomitapide tmax is around 6 hours in healthy volunteers. The absolute bioavailability of lomitapide is approximately 7%. Lomitapide pharmacokinetics is approximately dose-proportional for oral single doses from 10-100 mg.
The mean lomitapide volume of distribution at steady state is 985-1292 liters. Lomitapide is 99.8% plasma-protein bound.
Lomitapide is metabolized extensively by the liver. The metabolic pathways include oxidation, oxidative N-dealkylation, glucuronide conjugation, and piperidine ring opening. Cytochrome P450 (CYP) 3A4 metabolizes lomitapide to its major metabolites, M1 and M3, as detected in plasma. The oxidative N-dealkylation pathway breaks the lomitapide molecule into M1 and M3. M1 is the moiety that retains the piperidine ring, whereas M3 retains the rest of the lomitapide molecule in vitro. CYPs 1A2, 2B6, 2C8, and 2C19 may metabolize lomitapide to a small extent to M1. M1 and M3 do not inhibit activity of microsomal triglyceride transfer protein in vitro.
In a mass-balance study, a mean of 59.5% and 33.4% of the dose was excreted in the urine and feces, respectively. In another mass-balance study, a mean of 52.9% and 35.1% of the dose was excreted in the urine and feces, respectively. Lomitapide was not detectable in urine samples. M1 is the major urinary metabolite. Lomitapide is the major component in the feces. The mean lomitapide terminal half-life is 39.7 hours.
A single-dose, open-label study was conducted to evaluate the pharmacokinetics of 60 mg lomitapide in healthy volunteers with normal hepatic function compared with patients with mild (Child-Pugh A) and moderate (Child-Pugh B) hepatic impairment. In patients with moderate hepatic impairment, lomitapide AUC and Cmax were 164% and 361% higher, respectively, compared with healthy volunteers. In patients with mild hepatic impairment, lomitapide AUC and Cmax were 47% and 4% higher, respectively, compared with healthy volunteers. Lomitapide has not been studied in patients with severe hepatic impairment (Child-Pugh score 10-15) [see Dosage and Administration (2.6), Contraindications (4), Warnings and Precautions (5.1), and Use in Specific Populations (8.7)].
A single-dose, open-label study was conducted to evaluate the pharmacokinetics of 60 mg lomitapide in patients with end-stage renal disease receiving hemodialysis compared with healthy volunteers with normal renal function. Healthy volunteers had estimated creatinine clearance >80 mL/min by the Cockcroft-Gault equation. Compared with healthy volunteers, lomitapide AUC0-inf and Cmax were 40% and 50% higher, respectively, in patients with end-stage renal disease receiving hemodialysis. Effects of mild, moderate, and severe renal impairment as well as end-stage renal disease not yet on dialysis on lomitapide exposure have not been studied [see Dosage and Administration (2.5) and Use in Specific Populations (8.6)].
[see Dosage and Administration (2.3), Contraindications (4), Warnings and Precautions (5.6), (5.7), (5.8), and Drug Interactions (7)].
Lomitapide does not induce CYPs 1A2, 3A4, or 2B6. Lomitapide inhibits CYP3A4. Lomitapide does not inhibit CYPs 1A2, 2B6, 2C9, 2C19, 2D6, or 2E1. M1 and M3 do not induce CYPs 1A2, 3A4, or 2B6. M1 and M3 do not inhibit CYPs 1A2, 2A6, 2B6, 2C8, 2C9, 2C19, 2D6, 2E1, or 3A4. Lomitapide is not a P-gp substrate. Lomitapide inhibits P-gp but does not inhibit breast cancer resistance protein (BCRP).
Table 6 summarizes the effect of coadministered drugs on lomitapide AUC and Cmax.
Table 6. Effect of Coadministered Drugs on Lomitapide Systemic Exposure:
| COADMINISTERED DRUG | DOSING OF COADMINISTERED DRUG | DOSING OF LOMITAPIDE | RATIO OF LOMITAPIDE EXPOSURE WITH/WITHOUT COADMINISTERED DRUG NO EFFECT = 1 | |
|---|---|---|---|---|
| AUC | Cmax | |||
| Contraindicated with lomitapide [see Contraindications (4) and Warnings and Precautions (5.6)] | ||||
| Ketoconazole | 200 mg BID for 9 days | 60 mg single dose | ↑ 27 | ↑ 15 |
| Adjustment necessary when coadministered with lomitapide [see Dosage and Administration (2.3) and Warnings and Precautions (5.6)] | ||||
| Atorvastatin | 80 mg QD | 20 mg single dose | ↑2 | ↑2.1 |
| Ethinyl Estradiol (EE) / norgestimate | 0.035 mg EE/ 0.25 mg norgestimate QD | 20 mg single dose | ↑1.3 | ↑1.4 |
BID = twice daily; QD = once daily
↑ = increase
Table 7 summarizes the effects of lomitapide on the AUC and Cmax of coadministered drugs.
Table 7. Effect of Lomitapide on the Systemic Exposure of Coadministered Drugs:
| COADMINISTERED DRUG | DOSING OF COADMINISTERED DRUG | DOSING OF LOMITAPIDE | CHANGE OF COADMINISTERED DRUG EXPOSURE WITH / WITHOUT LOMITAPIDE | ||
|---|---|---|---|---|---|
| AUC | Cmax | ||||
| Dosage adjustment necessary when coadministered with lomitapide | |||||
| Simvastatin* | 40 mg single dose | 60 mg QD × 7 days | Simvastatin | ↑ 99% | ↑ 102% |
| Simvastatin acid | ↑ 71% | ↑ 57% | |||
| 20 mg single dose | 10 mg QD × 7 days | Simvastatin | ↑ 62% | ↑65% | |
| Simvastatin acid | ↑ 39% | ↑ 35% | |||
| Warfarin† | 10 mg single dose | 60 mg QD × 12 days | R(+) warfarin | ↑ 28% | ↑ 14% |
| S(-) warfarin | ↑ 30% | ↑ 15% | |||
| INR | ↑ 7% | ↑ 22% | |||
| No dosing adjustments required for the following: | |||||
| Atorvastatin | 20 mg single dose | 60 mg QD × 7 days | Atorvastatin acid | ↑ 52% | ↑63% |
| 20 mg single dose | 10 mg QD × 7 days | Atorvastatin acid | ↑ 11% | ↑19% | |
| Rosuvastatin | 20 mg single dose | 60 mg QD × 7 days | Rosuvastatin | ↑ 32% | ↑ 4% |
| 20 mg single dose | 10 mg QD × 7 days | Rosuvastatin | ↑ 2% | ↑ 6% | |
| Fenofibrate, micronized | 145 mg single dose | 10 mg QD × 7 days | Fenofibric acid | ↓ 10% | ↓29% |
| Ezetimibe | 10 mg single dose | 10 mg QD × 7 days | Total ezetimibe | ↑ 6% | ↑ 3% |
| Extended release niacin | 1000 mg single dose | 10 mg QD × 7 days | Nicotinic acid | ↑ 10% | ↑ 11% |
| Nicotinuric acid | ↓ 21% | ↓ 15% | |||
| Ethinyl estradiol | 0.035 mg QD × 28 days | 50 mg QD × 8 days | Ethinyl estradiol | ↓ 8% | ↓ 8% |
| Norgestimate | 0.25 mg QD × 28 days | 50 mg QD × 8 days | 17-Deacetyl norgestimate | ↑ 6% | ↑ 2% |
QD = once daily; INR = international normalized ratio; ↑ = increase; ↓ = decrease
* Limit simvastatin dosage to 20 mg daily (or 40 mg daily for patients who have previously tolerated simvastatin 80 mg daily for at least one year without evidence of muscle toxicity). Refer to the simvastatin prescribing information for additional dosing recommendations.
† Patients taking warfarin should undergo regular monitoring of the INR, especially after any changes in lomitapide dosage.
In a 2-year dietary carcinogenicity study in mice, lomitapide was administered at doses of 0.3, 1.5, 7.5, 15, or 45 mg/kg/day. There were statistically significant increases in the incidences of liver adenomas and carcinomas in males at doses ≥1.5 mg/kg/day (≥2-times the MRHD at 60 mg based on AUC) and in females at ≥7.5 mg/kg/day (≥10-times the human exposure at 60 mg based on AUC). Incidences of small intestinal carcinomas in males and combined adenomas and carcinomas in females were significantly increased at doses ≥15 mg/kg/day (≥23-times the human exposure at 60 mg based on AUC).
In a 2-year carcinogenicity study in rats, lomitapide was administered by oral gavage for up to 99 weeks at doses of 0.25, 1.7, or 7.5 mg/kg/day in males and 0.03, 0.35, or 2.0 mg/kg/day in females. While the design of the study was suboptimal, there were no statistically significant drug-related increases in tumor incidences at exposures up to 6-times (males) and 8-times (females) higher than human exposure at the MRHD based on AUC.
Lomitapide did not exhibit genotoxic potential in a battery of studies, including the in vitro Bacterial Reverse Mutation (Ames) assay, an in vitro cytogenetics assay using primary human lymphocytes, and an oral micronucleus study in rats.
Lomitapide had no effect on fertility in rats at doses up to 5 mg/kg/day at systemic exposures estimated to be 4-times (females) and 5-times (males) higher than in humans at 60 mg based on AUC.
The safety and effectiveness of JUXTAPID as an adjunct to a low-fat diet and other lipid-lowering treatments, including LDL apheresis where available, were evaluated in a multinational, single-arm, open-label, 78-week trial involving 29 adults with HoFH. A diagnosis of HoFH was defined by the presence of at least one of the following clinical criteria: (1) documented functional mutation(s) in both LDL receptor alleles or alleles known to affect LDL receptor functionality, or (2) skin fibroblast LDL receptor activity <20% normal, or (3) untreated TC >500 mg/dL and TG <300 mg/dL and both parents with documented untreated TC >250 mg/dL.
Among the 29 patients enrolled, the mean age was 30.7 years (range, 18 to 55 years), 16 (55%) were men, and the majority (86%) were Caucasian. The mean body mass index (BMI) was 25.8 kg/m 2, with four patients meeting BMI criteria for obesity; one patient had type 2 diabetes. Concomitant lipid-lowering treatments at baseline included one or more of the following: statins (93%), ezetimibe (76%), nicotinic acid (10%), bile acid sequestrant (3%), and fibrate (3%); 18 (62%) were receiving apheresis.
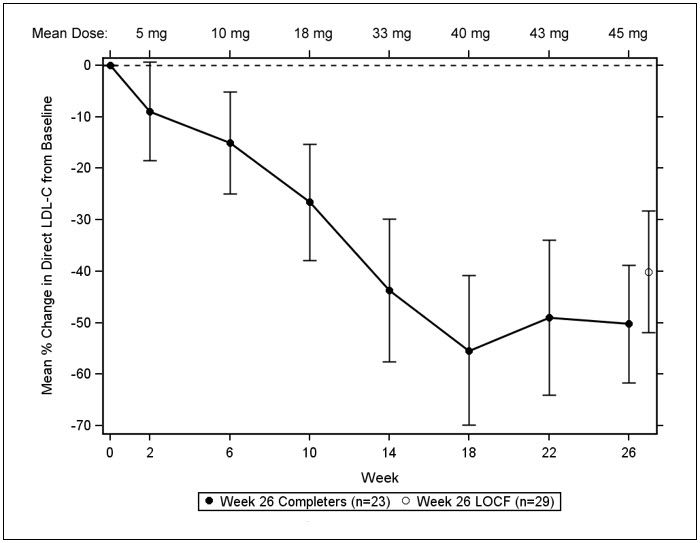
After a six-week run-in period to stabilize lipid-lowering treatments, including the establishment of an LDL apheresis schedule if applicable, JUXTAPID was initiated at 5 mg daily and titrated to daily doses of 10 mg, 20 mg, 40 mg, and 60 mg at weeks 2, 6, 10, and 14, respectively, based on tolerability and acceptable levels of transaminases. Patients were instructed to maintain a low-fat diet (<20% calories from fat) and to take dietary supplements that provided approximately 400 international units vitamin E, 210 mg alpha-linolenic acid (ALA), 200 mg linoleic acid, 110 mg eicosapentaenoic acid (EPA), and 80 mg docosahexaenoic acid (DHA) per day. After efficacy was assessed at Week 26, patients remained on JUXTAPID for an additional 52 weeks to assess long-term safety. During this safety phase, the dose of JUXTAPID was not increased above each patient’s maximum tolerated dose established during the efficacy phase, but changes to concomitant lipid-lowering treatments were allowed.
Twenty-three (79%) patients completed the efficacy endpoint at Week 26, all of whom went on to complete 78 weeks of treatment. Adverse events contributed to premature discontinuation for five patients [see Adverse Reactions (6.1)]. The maximum tolerated doses during the efficacy period were 5 mg (10%), 10 mg (7%), 20 mg (21%), 40 mg (24%), and 60 mg (34%).
The primary efficacy endpoint was percent change in LDL-C from baseline to Week 26. At Week 26, the mean and median percent changes in LDL-C from baseline were -40% (paired t-test p<0.001) and -50%, respectively, based on the intent-to-treat population with last observation carried forward (LOCF) for patients who discontinued prematurely. The mean percent change in LDL-C from baseline through Week 26 is shown in Figure 1 for the 23 patients who completed the efficacy period.
Figure 1. Mean Percent Change in LDL-C from Baseline (Week 26 Completers):
Error bars represent 95% confidence intervals of the mean.
Changes in lipids and lipoproteins through the efficacy endpoint at Week 26 are presented in Table 8.
Table 8. Absolute Values and Percent Changes from Baseline in Lipids and Lipoproteins:
| PARAMETER | BASELINE | WEEK 26/LOCF (N=29) | |
|---|---|---|---|
| Mean (SD) | Mean (SD) | Mean % Change | |
| LDL-C, direct (mg/dL) | 336 (114) | 190 (104) | -40* |
| TC (mg/dL) | 430 (135) | 258 (118) | -36* |
| apo B (mg/dL) | 259 (80) | 148 (74) | -39* |
| Non-HDL-C (mg/dL) | 386 (132) | 217 (113) | -40 |
| VLDL-C (mg/dL) | 21 (10) | 13 (9) | -29 |
| TG (mg/dL)† | 92 [72, 128] | 57 [36, 78] | -45* |
| HDL-C (mg/dL) | 44 (11) | 41 (13) | -7 |
* Statistically significant compared with baseline based on the pre-specified gatekeeping method for controlling Type I error among the primary and key secondary endpoints.
† Median values with interquartile range and median % change presented for TG.
After Week 26, during the safety phase of the study, adjustments to concomitant lipid-lowering treatments were allowed. For the study population overall, average reductions in LDL-C, TC, apo B, and non-HDL-C were sustained during chronic therapy.
© All content on this website, including data entry, data processing, decision support tools, "RxReasoner" logo and graphics, is the intellectual property of RxReasoner and is protected by copyright laws. Unauthorized reproduction or distribution of any part of this content without explicit written permission from RxReasoner is strictly prohibited. Any third-party content used on this site is acknowledged and utilized under fair use principles.