Source: European Medicines Agency (EU) Revision Year: 2022 Publisher: Galapagos NV, Generaal De Wittelaan L11 A3, 2800 Mechelen, Belgium
Pharmacotherapeutic group: Immunosuppressants, selective immunosuppressants
ATC code: L04AA45
Filgotinib is an adenosine triphosphate (ATP)-competitive and reversible inhibitor of the JAK family. JAKs are intracellular enzymes which transmit signals arising from cytokine or growth factor-receptor interactions on the cellular membrane. JAK1 is important in mediating inflammatory cytokine signals, JAK2 in mediating myelopoiesis and erythropoiesis and JAK3 plays critical roles in immune homeostasis and lymphopoiesis. Within the signalling pathway, JAKs phosphorylate and activate signal transducers and activators of transcription (STATs) which modulate intracellular activity including gene expression. Filgotinib modulates these signalling pathways by preventing the phosphorylation and activation of STATs.
Filgotinib administration resulted in a dose-dependent inhibition of IL-6 induced STAT1 phosphorylation in whole blood from healthy subjects. Filgotinib administration did not affect JAK2-associated GM-CSF induced STAT5 phosphorylation.
In FINCH 1, 2, and 3, the median and interquartile ranges for serum IgG, IgM, and IgA valuesremained largely within the normal reference ranges through 24 weeks oftreatment with filgotinib in patients with rheumatoid arthritis and through 58 weeks of treatment in patients with ulcerative colitis.
In FINCH 1, 2, and 3 in patients with rheumatoid arthritis, treatment with filgotinib was associated with a small, transient increase in mean ALC that remained within normal reference ranges and gradually returned to at or near baseline levels with continued treatment by week 12. In FINCH 1, 2, and 3, median haemoglobin values remained stable within the normal range through 24 weeks of filgotinib treatment. A slight decrease in median platelet counts occurred within the first 4 weeks of filgotinib treatment and remained stable thereafter through 24 weeks. Median platelet counts remained within the normal range.
In SELECTION, in patients with ulcerative colitis, median haemoglobin values remained stable through 58 weeks of filgotinib treatment.
Decreases in serum C-reactive protein (CRP) were observed as early as 2 weeks after starting treatment with filgotinib and were maintained through 24 weeks of treatment in patients with rheumatoid arthritis and through 58 weeks of treatment in patients with ulcerative colitis.
The efficacy and safety of filgotinib once daily were assessed in three Phase 3 studies (FINCH 1, 2, and 3). These were randomised, double-blind, multicentre studies in patients with moderate to severe active rheumatoid arthritis diagnosed according to American College of Rheumatology (ACR)/European League Against Rheumatism (EULAR) 2010 criteria.
FINCH 1 was a 52-week study in 1,755 patients with rheumatoid arthritis who had an inadequate response to MTX. Patients received filgotinib 200 mg once daily, filgotinib 100 mg once daily, adalimumab every 2 weeks, or placebo, all added to stable background MTX. At week 24, patients receiving placebo were re-randomised to filgotinib 100 mg or 200 mg once daily through week 52. The primary endpoint was the proportion of patients who achieved an ACR20 response at week 12.
FINCH 2 was a 24-week study in 448 patients with rheumatoid arthritis who had an inadequate response to bDMARDs. Patients received filgotinib 200 mg once daily, filgotinib 100 mg once daily, or placebo, all with a continued stable background dose of conventional synthetic DMARD (csDMARD[s]: MTX, hydroxychloroquine, sulfasalazine, or leflunomide). The primary endpoint was the proportion of patients who achieved an ACR20 response at week 12.
FINCH 3 was a 52-week study in 1,249 patients with rheumatoid arthritis who were naïve to MTX therapy. Patients received filgotinib 200 mg once daily plus MTX once weekly, filgotinib 100 mg once daily plus MTX once weekly, filgotinib 200 mg (monotherapy) once daily, or MTX (monotherapy) once weekly. The primary endpoint was the proportion of patients who achieved an ACR20 response at week 24.
Higher response rates versus placebo or MTX were seen at week 2 for ACR20, and responses were maintained through week 52.
Treatment with filgotinib 200 mg resulted in improvements in all individual ACR components, including tender and swollen joint counts, patient and physician global assessments, Health Assessment Questionnaire Disability Index (HAQ-DI), pain assessment and high sensitivity CRP, compared to placebo or MTX. In two of the Phase 3 studies (FINCH 1 and FINCH 2), the comparison (versus placebo) was carried out on top of MTX or csDMARD(s) (see above).
Across the Phase 3 studies, a significantly higher proportion of patients treated with filgotinib 200 mg plus MTX or other csDMARD achieved low disease activity and/or remission (DAS28-CRP ≤3.2 and DAS28-CRP <2.6) at weeks 12 and 24 as compared to placebo or MTX. Filgotinib 200 mg was non-inferior to adalimumab at week 12 for DAS28-CRP ≤3.2 in FINCH 1 (Table 3).
Table 3. Clinical response at weeks 12, 24 and 52 in FINCH 1, 2, and 3:
| FINCH 1 MTX-IR | FINCH 2 bDMARD-IR | FINCH 3 MTX-naïve | |||||||||
|---|---|---|---|---|---|---|---|---|---|---|---|
| Treatment | FIL 200 mg | FIL 100 mg | ADA | PBO | FIL 200 mg | FIL 100 mg | PBO | FIL 200 mg + MTX | FIL 100 mg + MTX | FIL 200 mg mono | MTX |
| + MTX | + csDMARD | ||||||||||
| N | 475 | 480 | 325 | 475 | 147 | 153 | 148 | 416 | 207 | 210 | 416 |
| Week | |||||||||||
| ACR20 (percent of patients) | |||||||||||
| 12 | 77***¶ | 70*** | 71 | 50 | 66*** | 58*** | 31 | 77††† | 72†† | 71†† | 59 |
| 24 | 78††† | 78††† | 74 | 59 | 69††† | 55††† | 34 | 81*** | 80* | 78 | 71 |
| 52 | 78 | 76 | 74 | − | − | − | − | 75††† | 73†† | 75††† | 62 |
| ACR50 (percent of patients) | |||||||||||
| 12 | 47†††¶¶¶ | 36††† | 35 | 20 | 43††† | 32††† | 15 | 53††† | 44††† | 46††† | 28 |
| 24 | 58††† | 53††† | 52 | 33 | 46††† | 35†† | 19 | 62††† | 57†† | 58†† | 46 |
| 52 | 62 | 59 | 59 | − | − | − | − | 62††† | 59†† | 61††† | 48 |
| ACR70 (percent of patients) | |||||||||||
| 12 | 26†††¶¶¶ | 19††† | 14 | 7 | 22††† | 14† | 7 | 33††† | 27††† | 29††† | 13 |
| 24 | 36†††¶ | 30††† | 30 | 15 | 32††† | 20†† | 8 | 44††† | 40††† | 40††† | 26 |
| 52 | 44 | 38 | 39 | − | − | − | − | 48††† | 40†† | 45††† | 30 |
| DAS28-CRP ≤3.2 (percent of patients) | |||||||||||
| 12 | 50***### | 39*** | 43 | 23 | 41*** | 37*** | 16 | 56††† | 50††† | 48††† | 29 |
| 24 | 61†††§§§¶¶ | 53†††§§§ | 50 | 34 | 48††† | 38††† | 21 | 69††† | 63††† | 60††† | 46 |
| 52 | 66¶ | 59 | 59 | − | − | − | − | 69††† | 60†† | 66††† | 48 |
| DAS28-CRP <2.6 (percent of patients) | |||||||||||
| 12 | 34†††§§§¶¶¶ | 24†††§§ | 24 | 9 | 22††† | 25††† | 8 | 40††† | 32††† | 30††† | 17 |
| 24 | 48***§§§¶¶¶ | 35***§§§ | 36 | 16 | 31††† | 26†† | 12 | 54*** | 43*** | 42††† | 29 |
| 52 | 54¶ | 43 | 46 | − | − | − | − | 53††† | 43†† | 46††† | 31 |
| CDAI, change from baseline (mean) | |||||||||||
| 12 | -26.0††† | -23.3††† | -23.5 | -20.3 | -26.2††† | -23.8††† | -17.3 | -27.8††† | -26.1††† | -27.5††† | -22.7 |
| 24 | -30.6††† | -28.6††† | -28.4 | -26.3 | -30.9††† | -27.8†† | -25.4 | -31.3††† | -30.0††† | -31.3††† | -28.2 |
| 52 | -32.9 | -30.9 | -31.6 | − | − | − | − | -33.8††† | -31.9† | -33.6††† | -31.2 |
ADA: adalimumab; bDMARD: biologic DMARD; csDMARD: conventional synthetic DMARD; DMARD: disease-modifying antirheumatic drug; FIL: filgotinib; IR: inadequate responder; mono: monotherapy; MTX: methotrexate; PBO: placebo.
* p≤0.05; ** p≤0.01; *** p≤0.001 versus placebo (versus MTX for FINCH 3) (statistically significant difference with multiplicity adjustment).
† p≤0.05; †† p≤0.01; ††† p≤0.001 versus placebo (versus MTX for FINCH 3) (nominal p-value).
# p≤0.05; ## p≤0.01; ### p≤0.001 versus adalimumab for FINCH 1 (non-inferiority test, statistically significant difference with multiplicity adjustment) (analysed for DAS28-CRP ≤3.2 and <2.6 pairwise comparisons only).
§ p≤0.05; §§ p≤0.01; §§§ p≤0.001 versus adalimumab for FINCH 1 (non-inferiority test, nominal p-value) (analysed for DAS28-CRP ≤3.2 and <2.6 pairwise comparisons only).
¶ p≤0.05; ¶¶ p≤0.01; ¶¶¶ p≤0.001 versus adalimumab for FINCH 1 (superiority test, nominal p-value) (analysed for ACR20/50/70, and DAS28-CRP ≤3.2 and <2.6 pairwise comparisons only).
Note: Comparisons were carried out on top of a stable background of MTX (FINCH 1) or csDMARD(s) (FINCH 2).
Inhibition of progression of structural joint damage was assessed using the modified Total Sharp Score (mTSS) and its components, the erosion score and joint space narrowing score, at weeks 24 and 52 in FINCH 1 and FINCH 3.
In patients who had an inadequate response to MTX, treatment with filgotinib plus MTX resulted in statistically significant inhibition of progression of structural joint damage compared to placebo plus MTX at week 24 (Table 4). Analyses of erosion and joint space narrowing scores were consistent with the overall scores.
Table 4. Radiographic response at weeks 24 and 52 in FINCH 1 and 3:
| FINCH 1 MTX-IR | FINCH 3 MTX-naïve | |||||||
|---|---|---|---|---|---|---|---|---|
| Treatment | FIL 200 mg | FIL 100 mg | ADA | PBO | FIL 200 mg + MTX | FIL 100 mg + MTX | FIL 200 mg mono | MTX |
| + MTX | ||||||||
| N | 475 | 480 | 325 | 475 | 416 | 207 | 210 | 416 |
| Week | ||||||||
| Modified Total Sharp Score (mTSS), mean (SD) change from baseline | ||||||||
| 24 | 0.13 (0.94)*** | 0.17 (0.91)*** | 0.16 (0.95) | 0.37 (1.42) | 0.21 (1.68) | 0.22 (1.53) | -0.04 (1.71)†† | 0.51 (2.89) |
| 52 | 0.21 (1.43) | 0.50 (2.10) | 0.58 (3.62) | − | 0.31 (1.81)††† | 0.23 (1.11)†† | 0.33 (1.90)†† | 0.81 (3.09) |
| Proportion of patients with no radiographic progressiona | ||||||||
| 24 | 88%** | 86% | 86% | 81% | 81%† | 77% | 83%† | 72% |
| 52 | 88% | 81% | 82% | − | 81%†† | 76% | 77% | 71% |
ADA: adalimumab; FIL: filgotinib; IR: inadequate responder; mono: monotherapy; MTX: methotrexate; PBO: placebo.
a No progression defined as mTSS change ≤0.
* p≤0.05; p≤0.01; *p≤0.001 versus placebo (statistically significant difference with multiplicity adjustment).
† p≤0.05; ††p≤0.01; †††p≤0.001 versus placebo (versus MTX for FINCH 3) (nominal p-value).
Treatment with filgotinib 200 mg resulted in a significant improvement in physical function, as measured by change from baseline in HAQ-DI (Table 5).
Table 5. Mean change from baseline in HAQ-DI at weeks 12, 24 and 52 in FINCH 1, 2, and 3:
| Mean change from baseline | |||||||||||
|---|---|---|---|---|---|---|---|---|---|---|---|
| FINCH 1 MTX-IR | FINCH 2 bDMARD-IR | FINCH 3 MTX-naïve | |||||||||
| Treatment | FIL 200 mg | FIL 100 mg | ADA | PBO | FIL 200 mg | FIL 100 mg | PBO | FIL 200 mg + MTX | FIL 100 mg + MTX | FIL 200 mg mono | MTX |
| + MTX | + csDMARD | ||||||||||
| N | 475 | 480 | 325 | 475 | 147 | 153 | 148 | 416 | 207 | 210 | 416 |
| Week | |||||||||||
| Health Assessment Questionnaire Disability Index (HAQ-DI) | |||||||||||
| Baseline score | 1.59 | 1.55 | 1.59 | 1.63 | 1.70 | 1.64 | 1.65 | 1.52 | 1.56 | 1.56 | 1.60 |
| 12 | -0.69*** | -0.56*** | -0.61 | -0.42 | -0.55*** | -0.48*** | -0.23 | -0.85††† | -0.77††† | -0.76††† | -0.61 |
| 24 | -0.82††† | -0.75††† | -0.78 | -0.62 | -0.75††† | -0.60†† | -0.42 | -0.94*** | -0.90** | -0.89† | -0.79 |
| 52 | -0.93 | -0.85 | -0.85 | − | − | − | − | -1.00††† | -0.97 | -0.95† | -0.88 |
ADA: adalimumab; bDMARD: biologic DMARD; csDMARD: conventional synthetic DMARD; DMARD: disease-modifying antirheumatic drug; FIL: filgotinib; IR: inadequate responder; mono: monotherapy; MTX: methotrexate; PBO: placebo.
* p≤0.05; p≤0.01; *p≤0.001 versus placebo (statistically significant difference with multiplicity adjustment).
† p≤0.05; ††p≤0.01; †††p≤0.001 versus placebo (versus MTX for FINCH 3) (nominal p-value).
Health status outcomes were assessed by the Short Form health survey (SF-36). Patients treated with filgotinib 200 mg plus MTX or other csDMARD demonstrated numerically greater improvement from baseline in the physical component summary score of SF-36 as well as in the Functional Assessment of Chronic Illness Therapy-Fatigue score (FACIT-F) at weeks 12 and 24 compared to placebo plus MTX/csDMARD or MTX.
In a long-term Phase 2 open-label extension study (DARWIN 3), continued and durable responses were observed, with ACR20/50/70 responses maintained for up to 3 years in patients who received filgotinib 200 mg as monotherapy or with MTX.
The efficacy and safety of filgotinib once daily were evaluated in a randomised, double-blind, placebo-controlled combined Phase 2b/3 study (SELECTION) in patients with moderately to severely active ulcerative colitis (Mayo Clinic Score 6 to 12; endoscopy subscore ≥2; rectal bleeding subscore ≥1; stool frequency subscore ≥ 1; and Physician’s Global Assessment subscore ≥2). SELECTION included two induction studies (UC-1 and UC-2) followed by a maintenance study (UC-3), with a total duration of 58 weeks of therapy. Patients were permitted to use stable doses of concomitant therapies for ulcerative colitis, including oral aminosalicylates, oral corticosteroids (prednisone equivalent dose up to 30 mg/day), and immunomodulators (azathioprine, 6-MP, or methotrexate).
UC-1 was an 11-week induction study in 659 patients with ulcerative colitis who were naïve to biologic therapy and had an inadequate response, loss of response, or intolerance to corticosteroids or immunomodulators. Patients received filgotinib 200 mg once daily (N=245), filgotinib 100 mg once daily (N=277), or placebo (N=137). At baseline, 56% of patients had an endoscopic subscore of 3; 24% were receiving oral corticosteroids only, 23% immunomodulators only, 7% corticosteroids and immunomodulators, and 47% neither corticosteroids nor immunomodulators.
UC-2 was an 11-week induction study in 689 patients with ulcerative colitis who were biologic-experienced and had an inadequate response, loss of response, or intolerance to a tumour necrosis factor (TNF) blocker or vedolizumab. Patients received filgotinib 200 mg once daily (N=262), filgotinib 100 mg once daily (N=285), or placebo (N=142). At baseline, 78% of patients had an endoscopic subscore of 3; 85% had failed at least 1 prior TNF blocker, 52% had failed vedolizumab, and 43% had failed at least 1 TNF blocker and vedolizumab; 36% were receiving oral corticosteroids only, 13% immunomodulators only, 10% corticosteroids and immunomodulators, and 41% neither corticosteroids nor immunomodulators.
The primary endpoint for UC-1 and UC-2 was the proportion of patients who achieved clinical remission at week 10. Clinical remission was defined as MCS endoscopy subscore of 0 or 1 (endoscopy subscore of 0 defined as normal or inactive disease and subscore of 1 defined as presence of erythema, decreased vascular pattern, and no friability), rectal bleeding subscore of 0 (no rectal bleeding), and at least a one point decrease in stool frequency subscore from baseline to achieve 0 or 1. Key secondary efficacy endpoints included MCS remission, endoscopic remission, and histologic remission at week 10.
UC-3 was a 47-week maintenance study in 558 patients with ulcerative colitis who achieved clinical response or remission at week 10 from filgotinib in UC-1 (N=320) or UC-2 (N=238). Clinical response was defined as a decrease in MCS of ≥3 points and ≥30% decrease from baseline, with an accompanying decrease in rectal bleeding subscore of ≥1 point or an absolute rectal bleeding subscore of 0 or 1. Patients were re-randomised at week 11 to receive their induction dose of filgotinib or placebo through week 58. As in UC-1 and UC-2, patients were permitted to use stable doses of oral aminosalicylates or immunomodulators; however, corticosteroid tapering was required three weeks after entering this study. The primary endpoint was the proportion of patients who achieved clinical remission at week 58. Key secondary efficacy endpoints were MCS remission, sustained clinical remission, 6-month corticosteroid-free clinical remission, endoscopic remission, and histologic remission at week 58.
Across the UC-1 and UC-2 studies, a significantly greater proportion of patients receiving filgotinib 200 mg achieved clinical remission at week 10 as compared to placebo (Table 6). A significantly greater proportion of biologic-naïve patients (UC-1) receiving filgotinib 200 mg achieved MCS remission, endoscopic remission, and histologic remission at week 10 as compared to placebo (Table 6).
Efficacy in the filgotinib 100 mg group as compared to placebo was not statistically significant at week 10 in either UC-1 or UC-2.
Table 6. Proportion of patients meeting efficacy endpoints at week 10 in induction studies UC-1 and UC-2:
| Endpoint n (%) | UC-1 Biologic naïve N=659 | UC-2 Biologic experienceda N=689 | ||||
|---|---|---|---|---|---|---|
| FIL 200 mg N=245 | Placebo N=137 | Treatment difference and 95% CI | FIL 200 mg N=262 | Placebo N=142 | Treatment difference and 95% CI | |
| Clinical remissionb | 64 (26.1%) | 21 (15.3%) | 10.8% (2.1%, 19.5%) p=0.0157 | 30 (11.5%) | 6 (4.2%) | 7.2% (1.6%, 12.8%) p=0.0103 |
| Failure to both TNF and vedolizumabc | - | - | - | 8/120 (6.7%) | 1/64 (1.6%) | - |
| MCS remissiond | 60 (24.5%) | 17 (12.4%) | 12.1% (3.8%, 20.4%) p=0.0053 | 25 (9.5%) | 6 (4.2%) | 5.3% (-0.1%, 10.7%) |
| Endoscopic remissione | 30 (12.2%) | 5 (3.6%) | 8.6% (2.9%, 14.3%) p=0.0047 | 9 (3.4%) | 3 (2.1%) | 1.3% (–2.5%, 5.1%) |
| Histologic remissionf | 86 (35.1%) | 22 (16.1%) | 19.0% (9.9%, 28.2%) p<0.0001 | 52 (19.8%) | 12 (8.5%) | 11.4% (4.2%, 18.6%) |
CI: Confidence interval; FIL: filgotinib; MCS: Mayo Clinic Score.
a Biologic experienced = Patients who previously demonstrated an inadequate response, loss of response to, or intolerance of a TNF blocker or vedolizumab.
b Primary endpoint. Clinical remission was defined as MCS endoscopy subscore of 0 or 1 (endoscopy subscore of 0 defined as normal or inactive disease and subscore of 1 defined as presence of erythema, decreased vascular pattern, and no friability), rectal bleeding subscore of 0 (no rectal bleeding), and at least a one point decrease in stool frequency subscore from baseline to achieve 0 or 1.
c Subgroup analysis based on patients with prior treatment failure to both a TNF blocker and vedolizumab.
d MCS remission was defined as MCS ≤2 with no individual subscore of >1.
e Endoscopic remission was defined as MCS endoscopic subscore of 0.
f Histologic remission was assessed using Geboes histologic scores and defined as Grade 0 of ≤0.3, Grade 1 of ≤1.1, Grade 2a of ≤2A.3, Grade 2b of 2B.0, Grade 3 of 3.0, Grade 4 of 4.0, and Grade 5 of 5.0.
The proportion of patients in UC-1 and UC-2 achieving a clinical response was 66.5% and 53.1%, respectively, for patients receiving filgotinib 200 mg compared with 46.7% and 17.6%, respectively, for patients receiving placebo at week 10.
In the maintenance study (UC-3), a significantly greater proportion of patients receiving filgotinib 200 mg or filgotinib 100 mg achieved clinical remission at week 58 as compared to placebo. The proportion of patients achieving clinical remission is shown in Table 7. A significantly greater proportion of patients receiving filgotinib 200 mg achieved MCS remission, sustained clinical remission, 6-month corticosteroid-free clinical remission, endoscopic remission, and histologic remission at week 58 as compared to placebo.
Key secondary efficacy outcomes for treatment with filgotinib 100 mg as compared to placebo were not statistically significant at week 58.
Table 7. Proportion of patients meeting efficacy endpoints at week 58 in maintenance study UC-3:
| Endpoint n (%) | Induction FIL 200 mg | ||
|---|---|---|---|
| FIL 200 mg N=199 | Placebo N=98 | Treatment difference and 95% CI | |
| Clinical remissiona,b | 74 (37.2%) | 11 (11.2%) | 26.0% (16.0%, 35.9%) p<0.0001 |
| Biologic naïve | 52/107 (48.6%) | 9/54 (16.7%) | - |
| Biologic experienced | 22/92 (23.9%) | 2/44 (4.5%) | - |
| MCS remissionc | 69 (34.7%) | 9 (9.2%) | 25.5% (16.0%, 35.0%) p<0.0001 |
| Sustained clinical remissiond,b | 36 (18.1%) | 5 (5.1%) | 13.0% (5.3%, 20.6%) p=0.0024 |
| Biologic naïve | 25/107 (23.4%) | 4/54 (7.4%) | - |
| Biologic experienced | 11/92 (12.0%) | 1/44 (2.3%) | - |
| 6-month corticosteroid-free clinical remissione,b | 25/92 (27.2%) | 3/47 (6.4%) | 20.8% (7.7%, 33.9%) p=0.0055 |
| Biologic naïve | 18/43 (41.9%) | 2/22 (9.1%) | - |
| Biologic experienced | 7/49 (14.3%) | 1/25 (4.0%) | - |
| Endoscopic remissionf | 31 (15.6%) | 6 (6.1%) | 9.5% (1.8%, 17.1%) p=0.0157 |
| Histologic remissiong | 76 (38.2%) | 13 (13.3%) | 24.9% (14.6%, 35.2%) p<0.0001 |
CI: Confidence interval; FIL: filgotinib; MCS: Mayo Clinic Score.
a Primary endpoint. Clinical remission was defined as MCS endoscopy subscore of 0 or 1 (endoscopy subscore of 0 defined as normal or inactive disease and subscore of 1 defined as presence of erythema, decreased vascular pattern, and no friability), rectal bleeding subscore of 0 (no rectal bleeding), and at least a one point decrease in stool frequency subscore from induction baseline to achieve 0 or 1.
b Subgroup analysis based on patient participation in UC-1 (biologic naïve) or UC-2 (biologic experienced; TNF blocker and/or vedolizumab).
c MCS remission was defined as MCS ≤2 with no individual subscore of >1.
d Sustained clinical remission was defined as clinical remission at both week 10 and week 58.
e 6-month corticosteroid-free clinical remission was defined as clinical remission at week 58 in patients who were on corticosteroid at UC-3 baseline and who were not receiving corticosteroids for at least 6 months prior to week 58.
f Endoscopic remission was defined as MCS endoscopic subscore of 0.
g Histologic remission was assessed using Geboes histologic scores and defined as Grade 0 of ≤0.3, Grade 1 of ≤1.1, Grade 2a of ≤2A.3, Grade 2b of 2B.0, Grade 3 of 3.0, Grade 4 of 4.0, and Grade 5 of 5.0.
Endoscopic response was defined as an endoscopic subscore of 0 or 1. The proportion of patients in UC-1 and UC-2 achieving an endoscopic response was 33.9% and 17.2%, respectively, for patients receiving filgotinib 200 mg compared with 20.4% and 7.7%, respectively, for patients receiving placebo, at week 10. In UC-3, 40.7% of patients receiving filgotinib 200 mg versus 15.3% of patients receiving placebo achieved endoscopic response at week 58.
Patients receiving filgotinib 200 mg reported increases (improvements) in the total and all four domain scores of the Inflammatory Bowel Disease Questionnaire ([IBDQ] bowel symptoms, systemic function, emotional function, and social function) at week 10 in UC-1 and UC-2, and at week 58 in UC-3.
Patients who did not achieve clinical response or remission at week 10 in UC-1 or UC-2 had the option to receive open-label filgotinib 200 mg in the SELECTION LTE study. After 12 weeks of additional treatment with filgotinib 200 mg in the SELECTION LTE study, the proportion of patients from UC-1 and UC-2 achieving partial MCS remission was 17.1% (12/70) and 16.7% (15/90), respectively and partial MCS response was achieved by 65.7% (46/70) and 62.2% (56/90), respectively. Partial MCS remission was defined as partial MCS ≤1 and partial MCS response was defined as a reduction of ≥2 in partial MCS and at least 30% reduction from the induction baseline score, with an accompanying decrease of ≥1 in the rectal bleeding subscore or an absolute rectal bleeding subscore of 0 or 1.
The European Medicines Agency has deferred the obligation to submit the results of studies with filgotinib in one or more subsets of the paediatric population in the treatment of chronic idiopathic arthritis (including rheumatoid arthritis, ankylosing spondylarthritis, psoriatic arthritis, and juvenile idiopathic arthritis) and in ulcerative colitis (see section 4.2 for information on paediatric use).
Following oral administration, filgotinib was absorbed quickly and its median peak plasma concentration was observed 2 to 3 hours postdose after multiple dosing; the median peak plasma concentrations of its primary metabolite GS-829845 were observed 5 hours postdose after multiple dosing. Filgotinib and GS-829845 exposures (AUC) and Cmax were similar in healthy adult subjects and patients with rheumatoid arthritis and ulcerative colitis. Filgotinib and GS-829845 exposures (AUC) and Cmax are dose-proportional over the therapeutic dose range. Steady-state concentrations of filgotinib are achieved in 2-3 days with negligible accumulation after once daily administration. Steady-state concentrations of GS-829845 are achieved in 4 days with approximately 2-fold accumulation after once daily dosing of filgotinib.
There were no clinically relevant differences in exposures when filgotinib was administered with a high-fat or low-fat meal as compared to a fasted state. Filgotinib can be administered with or without food.
Steady-state exposures of filgotinib and GS-829845 are provided in Table 8.
Table 8. Multiple dose pharmacokinetic parameters of filgotinib and GS-829845 following oral administration of filgotinib 200 mg with or without food in patient populations:
| Rheumatoid arthritisa | Ulcerative colitisb | |||
|---|---|---|---|---|
| Parameter Mean (%CV) | Filgotinibc | GS-829845d | Filgotinib | GS-829845 |
| Cmax (µg/mL) | 2.15 (48.1) | 4.43 (29.3) | 2.12 (50.3)e | 4.02 (30.5)e |
| AUCtau (µg•h/mL) | 6.77 (43.7) | 83.2 (27.3) | 6.15 (28.1)f | 72.1 (33.9)g |
CV: coefficient of variation.
a From intensive PK analyses of studies FINCH 1, FINCH 2, and FINCH 3 in rheumatoid arthritis patients receiving 200 mg filgotinib once daily.
b From intensive PK analysis of SELECTION study in ulcerative colitis patients receiving 200 mg filgotinib once daily.
c N=37
d N=33
e N=13
f N=12
g N=11
Filgotinib and GS-829845 binding to human plasma proteins is low (55-59% and 39-44% bound, respectively). The blood-to-plasma ratio of filgotinib ranged from 0.85 to 1.1 indicating no preferential distribution of filgotinib and GS-829845 into blood cells. Filgotinib and GS-829845 are substrates of the P-gp transporter.
Filgotinib is extensively metabolised with approximately 9.4% and 4.5% of an orally administered dose recovered as unchanged filgotinib in urine and faeces, respectively. Filgotinib is primarily metabolised by CES2, and to a lesser extent by CES1. Both CES2 and CES1 form GS-829845, an active circulating metabolite that is approximately 10-fold less potent than the parent compound. In a clinical pharmacology study, filgotinib and GS-829845 accounted for the majority of radioactivity circulating in plasma (2.9% and 92%, respectively). No other major metabolites were identified.
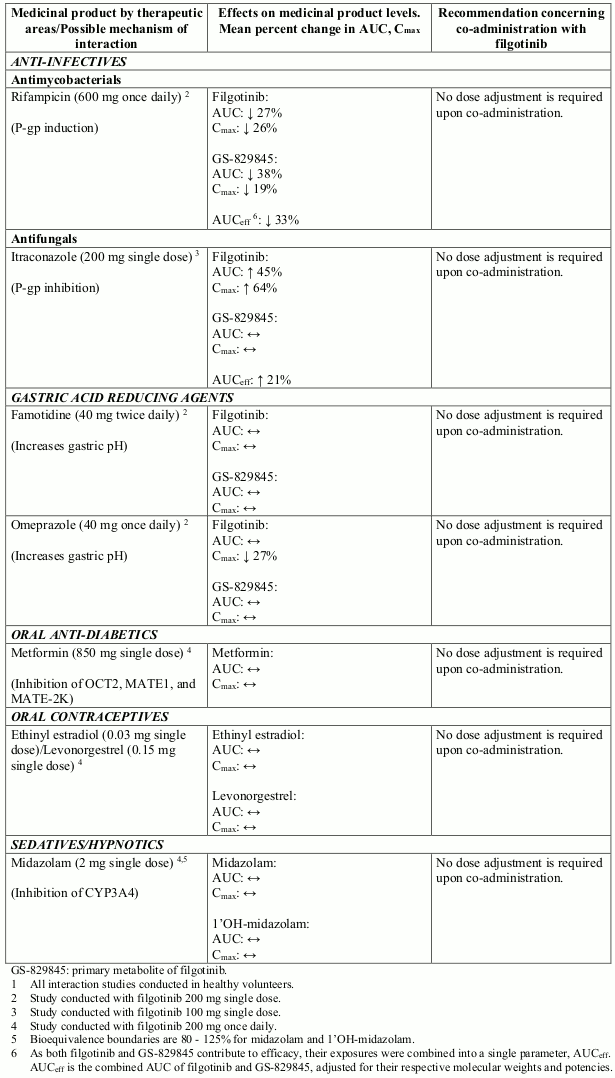
As both filgotinib and GS-829845 contribute to efficacy, their exposures were combined into a single parameter, AUCeff. AUCeff is the sum of the AUC of filgotinib and GS-829845, corrected for their respective molecular weights and potencies.
Approximately 87% of the administered dose was eliminated in the urine as filgotinib and its metabolites, while about 15% of the dose was eliminated in the faeces. GS-829845 accounted for approximately 54% and 8.9% of dose recovered in urine and faeces, respectively. The mean terminal half-lives of filgotinib and GS-829845 were approximately 7 and 19 hours, respectively.
Bodyweight, gender, race, and age did not have a clinically relevant effect on the pharmacokinetics (AUC) of filgotinib or GS-829845.
There were no clinically relevant differences in mean filgotinib and GS-829845 exposures (AUC and Cmax) between older patients aged ≥65 years relative to adult patients aged <65 years.
The pharmacokinetics of filgotinib and GS-829845 were unaffected in subjects with mild renal impairment (CrCl 60 to <90 mL/min). Increases in exposures (AUC) of filgotinib, GS-829845, and combined AUCeff (≤2-fold), were observed in subjects with moderate renal impairment (CrCl 30 to <60 mL/min). In subjects with severe renal impairment (CrCl 15 to <30 mL/min), filgotinib exposure (AUC) increased by 2.2-fold and GS-829845 exposure significantly increased by 3.5-fold leading to a 3-fold increase in AUCeff. The pharmacokinetics of filgotinib has not been studied in subjects with end stage renal disease (CrCl <15 mL/min).
No clinically relevant changes in the exposures (AUC) of filgotinib and GS-829845 individually, or their combined exposure (AUCeff), were observed in subjects with moderate hepatic impairment (Child-Pugh B). The pharmacokinetics of filgotinib has not been studied in subjects with severe hepatic impairment (Child-Pugh C).
Potential interactions between filgotinib and co-administered medicinal products are listed in Table 7 below (increase is indicated as “↑”, decrease as “↓”, and no change as “↔”; no effect boundaries are 70-143% unless otherwise indicated).
Table 7. Interaction studies with filgotinib1:
In vitro o data indicate that filgotinib and GS-829845 do not inhibit the activity of the following: CYP2B6, CYP2C8, CYP2C9, CYP2C19, CYP2D6, UGT1A1, UGT1A4, UGT1A6, UGT1A9, and UGT2B7 at clinically relevant concentrations. The potential for filgotinib to induce CYP2B6 constitutive androstane receptor (CAR) mediated metabolism in vivo is unknown. No conclusion can be drawn from the in vitro data regarding the potential of filgotinib to inhibit or induce CYP1A2. In vivo data demonstrated no inhibition or induction of CYP3A4 mediated metabolism.
In vitro studies indicate that filgotinib and GS-829845 are not inhibitors of P-gp, BCRP, OCT1, BSEP, OAT1, OAT3 or OAT4 at clinically relevant concentrations.
Non-clinical data reveal no special hazard for humans based on conventional studies of safety pharmacology.
The carcinogenic potential of filgotinib was evaluated in a 6-month rasH2 transgenic mouse study and a 2-year rat study. Filgotinib was not carcinogenic in mice at up to 150 mg/kg/day, which resulted in exposures of approximately 25 and 12 times the exposures in humans at the 100 mg and 200 mg once daily doses, respectively. In the 2-year rat study, filgotinib treatment resulted in an increase in incidence and decrease in latency of benign Leydig cell tumours at the highest dose of 45 mg/kg/day (exposures of approximately 4.2 times exposures in humans at the 200 mg once daily dose); the clinical relevance of this finding is low.
Filgotinib was not mutagenic or clastogenic in the in vitro bacterial reverse mutation assay, in vitro chromosome aberration assay, and in vivo rat micronucleus assay.
Adverse findings of degeneration/necrosis of incisor ameloblasts were observed in rats at exposures 21- to 28-fold greater than clinical exposures at the 200 mg filgotinib dose, with exposure margins at the NOAEL ranging from 3.5- to 8-fold. The human relevance of these dental findings is considered low since in contrast to adult patients, ameloblasts in rats persist into adulthood to support lifelong continuous incisor growth.
Impaired spermatogenesis and histopathological effects on male reproductive organs (testes and epididymis) were observed with filgotinib in rats and dogs. At the no-observed-adverse-effect-levels (NOAELs) in dogs (the most sensitive species), the exposure margin is 2.7-fold at the 200 mg once daily dose in humans. The severity of the histological effects was dose-dependent. Spermatogenic and histopathological effects were not fully reversible at lower exposures and were irreversible at exposure margins of approximately 7- to 9-fold the exposure at the 200 mg once daily dose in humans.
Embryo-foetal development studies in rats and rabbits demonstrated embryolethality and teratogenicity at exposures comparable to 200 mg filgotinib once daily dosing in humans. Visceral and skeletal malformations and/or variations were observed at all dose levels of filgotinib.
Filgotinib was administered to pregnant rats at doses of 25, 50, and 100 mg/kg/day. Dose-related increases in the incidence of internal hydrocephaly, dilated ureters, and multiple vertebral anomalies were seen at all dose levels. At 100 mg/kg/day, an increased number of early and late resorptions were noted together with a decreased number of viable foetuses. In addition, foetal body weights were decreased.
In rabbits, filgotinib caused visceral malformations mainly in the lungs and cardiovascular system, at a dose level of 60 mg/kg/day. Filgotinib caused skeletal malformations affecting the vertebral column region at dose levels of 25 and 60 mg/kg/day, mainly in vertebra, ribs and sternebrae. Fused sternebrae also occurred at 10 mg/kg/day filgotinib. Retarded skeletal ossification was evidenced at 60 mg/kg/day.
No adverse effects on pre-/postnatal development were observed in rats in a pre- and postnatal development study of filgotinib and GS-829845. Filgotinib and GS-829845 were detected in nursing rat pups after administration of filgotinib to lactating female rats from gestation day 6 through 10 days post-partum at dose levels of 2, 5, and 15 mg/kg/day, likely due to the presence of filgotinib in milk. At the highest tested dose, maternal systemic exposure (AUC) to filgotinib in rats was approximately 2 times the exposure in humans at the 200 mg once daily dose; exposures in nursing pups were less than 6% that of maternal exposure on day 10 post-partum. Due to the low exposure of the animals, the pre-/postnatal development study was considered inconclusive.
© All content on this website, including data entry, data processing, decision support tools, "RxReasoner" logo and graphics, is the intellectual property of RxReasoner and is protected by copyright laws. Unauthorized reproduction or distribution of any part of this content without explicit written permission from RxReasoner is strictly prohibited. Any third-party content used on this site is acknowledged and utilized under fair use principles.