KISPLYX Hard capsule Ref.[27667] Active ingredients: Lenvatinib
Source: European Medicines Agency (EU) Revision Year: 2025 Publisher: Eisai GmbH, Edmund-Rumpler-Straße 3, 60549 Frankfurt am Main, Germany, E-mail: medinfo_de@eisai.net
5.1. Pharmacodynamic properties
Pharmacotherapeutic group: antineoplastic agents, protein kinase inhibitors
ATC code: L01EX08
Mechanism of action
Lenvatinib is a receptor tyrosine kinase (RTK) inhibitor that selectively inhibits the kinase activities of vascular endothelial growth factor (VEGF) receptors VEGFR1 (FLT1), VEGFR2 (KDR), and VEGFR3 (FLT4), in addition to other proangiogenic and oncogenic pathway-related RTKs including fibroblast growth factor (FGF) receptors FGFR1, 2, 3, and 4, the platelet derived growth factor (PDGF) receptor PDGFRα, KIT, and RET. In syngeneic mouse tumour models, lenvatinib decreased tumour-associated macrophages, increased activated cytotoxic T cells, and demonstrated greater antitumour activity in combination with an anti-PD-1 monoclonal antibody compared to either treatment alone.
The combination of lenvatinib and everolimus showed increased antiangiogenic and antitumour activity as demonstrated by decreased human endothelial cell proliferation, tube formation, and VEGF signalling in vitro and tumour volume in mouse xenograft models of human renal cell cancer greater than each substance alone.
Although not studied directly with lenvatinib, the mechanism of action (MOA) for hypertension is postulated to be mediated by the inhibition of VEGFR2 in vascular endothelial cells. Similarly, although not studied directly, the MOA for proteinuria is postulated to be mediated by downregulation of VEGFR1 and VEGFR2 in the podocytes of the glomerulus.
The mechanism of action for hypothyroidism is not fully elucidated.
The mechanism of action for the worsening of hypercholesterolaemia with the combination of lenvatinib and everolimus has not been studied directly and is not fully elucidated.
Although not studied directly, the MOA for the worsening of diarrhoea with the combination of lenvatinib and everolimus is postulated to be mediated by the impairment of intestinal function related to the MOAs for the individual agents – VEGF/VEGFR and c-KIT inhibition by lenvatinib coupled with mTOR/NHE3 inhibition by everolimus.
Clinical efficacy and safety
First-line treatment of patients with RCC (in combination with pembrolizumab)
The efficacy of lenvatinib in combination with pembrolizumab was investigated in Study 307 (CLEAR), a multicentre, open-label, randomized trial that enrolled 1069 patients with advanced RCC with clear cell component including other histological features such as sarcomatoid and papillary in the first-line setting. Patients were enrolled regardless of PD-L1 tumour expression status. Patients with active autoimmune disease or a medical condition that required immunosuppression were ineligible. Randomisation was stratified by geographic region. (North America and Western Europe versus "Rest of the World") and Memorial Sloan Kettering Cancer Center (MSKCC) prognostic groups (favourable, intermediate and poor risk).
Patients were randomized to lenvatinib 20 mg orally once daily in combination with pembrolizumab 200 mg intravenously every 3 weeks (n=355), or lenvatinib 18 mg orally once daily in combination with everolimus 5 mg orally once daily (n=357), or sunitinib 50 mg orally once daily for 4 weeks then off treatment for 2 weeks (n=357). All patients on the lenvatinib plus pembrolizumab arm were started on lenvatinib 20 mg orally once daily. The median time to first dose reduction for lenvatinib was 1.9 months. The median average daily dose for lenvatinib was 14 mg. Treatment continued until unacceptable toxicity or disease progression as determined by the investigator and confirmed by independent radiologic review committee (IRC) using Response Evaluation Criteria in Solid Tumours Version 1.1 (RECIST 1.1). Administration of lenvatinib with pembrolizumab was permitted beyond RECIST-defined disease progression if the patient was clinically stable and considered by the investigator to be deriving clinical benefit. Pembrolizumab was continued for a maximum of 24 months; however, treatment with lenvatinib could be continued beyond 24 months. Assessment of tumour status was performed at baseline and then every 8 weeks.
The study population (355 patients in the lenvatinib with pembrolizumab arm and 357 in the sunitinib arm) characteristics were: median age of 62 years (range: 29 to 88 years); 41% age 65 or older, 74% male; 75% White, 21% Asian, 1% Black, and 2% other races; 17% and 83% of patients had a baseline KPS of 70 to 80 and 90 to 100, respectively; patient distribution by IMDC (International Metastatic RCC Database Consortium) risk categories was 33% favourable, 56% intermediate and 10% poor, and MSKCC prognostic groups was 27% favourable, 64% intermediate and 9% poor. Metastatic disease was present in 99% of the patients and locally advanced disease was present in 1%. Common sites of metastases in patients were lung (69%), lymph node (46%), and bone (26%).
The primary efficacy outcome measure was progression free survival (PFS) based on RECIST 1.1 per IRC. Key secondary efficacy outcome measures included overall survival (OS) and objective response rate (ORR). Lenvatinib in combination with pembrolizumab demonstrated statistically significant improvements in PFS, OS and ORR compared with sunitinib at the prespecified interim analysis (final analysis for PFS). The median PFS for lenvatinib in combination with pembrolizumab was 23.9 months (95% CI: 20.8, 27.7) compared with 9.2 months (95% CI: 6.0, 11.0) for sunitinib, with HR 0.39 (95% CI: 0.32, 0.49; P value <0.0001). For OS, HR was 0.66 (95% CI: 0.49, 0.88; P value 0.0049) with the median OS follow-up time of 26.5 months and the median duration of treatment for lenvatinib plus pembrolizumab of 17.0 months. The ORR for lenvatinib in combination with pembrolizumab was 71% (95% CI: 66, 76) vs 36% (95% CI: 31, 41) P value <0.0001 for sunitinib. Efficacy results for PFS, OS and ORR at the protocol-specified final analysis (median follow-up time of 49.4 months) are summarised in Table 5, Figure 1 and Figure 2. PFS results were consistent across pre-specified subgroups, MSKCC prognostic groups and PD-L1 tumour expression status. Efficacy results by MSKCC prognostic group are summarised in Table 6.
The final OS analysis was not adjusted to account for subsequent therapies, with 195/357 (54.6%) patients in the sunitinib arm and 56/355 (15.8%) patients in the lenvatinib plus pembrolizumab arm receiving subsequent anti-PD-1/PD-L1 therapy.
Table 5. Efficacy Results in Renal Cell Carcinoma Per IRC in CLEAR:
| Lenvatinib 20 mg with Pembrolizumab 200 mg N=355 | Sunitinib 50 mg N=357 | |
|---|---|---|
| Progression-Free Survival (PFS)* | ||
| Number of events, n (%) | 207 (58%) | 214 (60%) |
| Median PFS in months (95% CI)a | 23.9 (20.8, 27.7) | 9.2 (6.0, 11.0) |
| Hazard Ratio (95% CI)b,c | 0.47 (0.38, 0.57) | |
| P valuec | <0.0001 | |
| Overall Survival (OS) | ||
| Number of deaths, n (%) | 149 (42%) | 159 (45%) |
| Median OS in months (95% CI)a | 53.7 (48.7, NE) | 54.3 (40.9, NE) |
| Hazard Ratio (95% CI)b,c | 0.79 (0.63, 0.99) | |
| P valuec | 0.0424 | |
| Objective Response Rate (Confirmed) | ||
| Objective response rate, n (%) | 253 (71.3%) | 131 (36.7%) |
| (95% CI) | (66.6, 76.0) | (31.7, 41.7) |
| Number of complete responses (CR), n (%) | 65 (18.3%) | 17 (4.8%) |
| Number of partial responses (PR), n (%) | 188 (53.0%) | 114 (32%) |
| P valued | <0.0001 | |
| Duration of Responsea | ||
Median in months (range) 26.7 (1.64+, 55.92+) 14.7 (1.64+, 54.08+)
Tumour assessments were based on RECIST 1.1; only confirmed responses are included for ORR.
Data cutoff date (DCO) = 31 July 2022
CI = confidence interval; NE = Not estimable
* The primary analysis of PFS included censoring for new anti-cancer treatment. Results for PFS with and without censoring for new anti-cancer treatment were consistent.
a Quartiles are estimated by Kaplan-Meier method.
b Hazard ratio is based on a Cox Proportional Hazards Model including treatment group as a factor; Efron method is used for ties.
c Stratified by geographic region (Region 1: Western Europe and North America, Region 2: Rest of the World) and MSKCC prognostic groups (favourable, intermediate and poor risk) in IxRS. Nominal two-sided P value based on stratified log-rank test.
d Nominal two-sided P value based on the stratified Cochran-Mantel-Haenszel (CMH) test. At the earlier pre-specified final analysis of ORR (median follow-up time of 17.3 months), statistically significant superiority was achieved for ORR comparing lenvatinib plus pembrolizumab with sunitinib, (odds ratio: 3.84 (95% CI: 2.81, 5.26), P value <0.0001).
Figure 1. Kaplan-Meier Curves for Progression-Free Survival in CLEAR*:
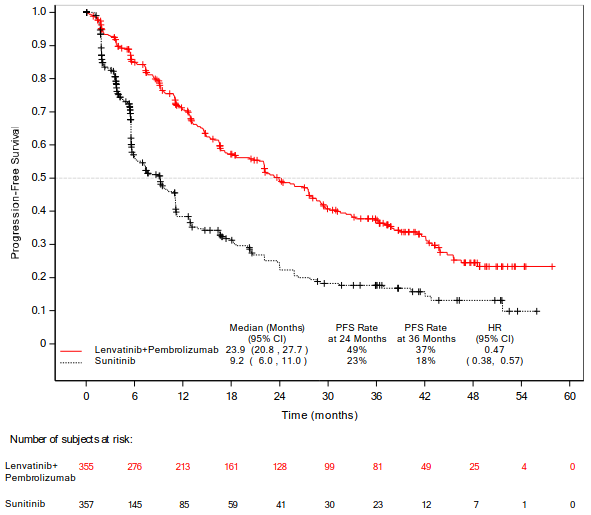
DCO: 31 July 2022
* Based on updated PFS analysis conducted at the time of the protocol-specified final OS analysis.
Figure 2. Kaplan-Meier Curves for Overall Survival in CLEAR*:
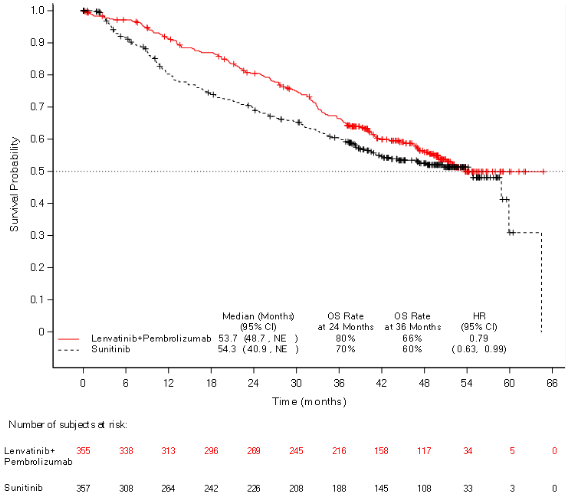
NE = Not estimable.
DCO: 31 July 2022 * Based on the protocol-specified final OS analysis
The CLEAR study was not powered to evaluate efficacy of individual subgroups. Table 6 summarises the efficacy measures by MSKCC prognostic group based on the final OS analysis at a median follow-up of 49.4 months.
Table 6. Efficacy Results in CLEAR by MSKCC Prognostic Group:
| Lenvatinib + Pembrolizumab (N=355) | Sunitinib (N=357) | Lenvatinib + Pembrolizumab vs. Sunitinib | |||
|---|---|---|---|---|---|
| Number of Patients | Number of Events | Number of Patients | Number of Events | ||
| Progression-Free Survival (PFS) by IRCa | PFS HR (95% CI) | ||||
| Favourable | 96 | 56 | 97 | 65 | 0.46 (0.32, 0.67) |
| Intermediate | 227 | 129 | 228 | 130 | 0.51 (0.40, 0.65) |
| Poor | 32 | 22 | 32 | 19 | 0.18 (0.08, 0.42) |
| Overall Survival (OS)a | OS HR (95% CI) | ||||
| Favourable | 96 | 27 | 97 | 31 | 0.89 (0.53, 1.50) |
| Intermediate | 227 | 104 | 228 | 108 | 0.81 (0.62, 1.06) |
| Poor | 32 | 18 | 32 | 20 | 0.59 (0.31, 1.12) |
a Median follow up 49.4 months (DCO - 31 July 2022)
Open-label, single arm Phase 2 study
Additional data are available from the open-label, single-arm, Phase 2 study KEYNOTE-B61 of lenvatinib (20 mg OD) in combination with pembrolizumab (400 mg every 6 weeks) for the first-line treatment of patients with advanced or metastatic RCC with non-clear cell histology (n=158), including 59% papillary, 18% chromophobe, 4% translocation, 1% medullary, 13% unclassified, and 6% other. The ORR was 50.6% (95% CI (42.6, 58.7)), and the median duration of response was 19.5 months (95% CI 15.3, NR).
Second-line treatment of patients with RCC (in combination with everolimus)
Study 205, a multicentre, randomised, open-label, trial was conducted to determine the safety and efficacy of lenvatinib administered alone or in combination with everolimus in patients with unresectable advanced or metastatic RCC. The study consisted of a Phase 1b dose finding and a Phase 2 portion. The Phase 1b portion included 11 patients who received the combination of 18 mg of lenvatinib plus 5 mg of everolimus. The Phase 2 portion enrolled a total of 153 patients with unresectable advanced or metastatic RCC following 1 prior VEGF-targeted treatment. A total of 62 patients received the combination of lenvatinib and everolimus at the recommended dose. Patients were required, among others, to have histological confirmation of predominant clear cell RCC, radiographic evidence of disease progression according to RECIST 1.1, one prior VEGF-targeted therapy and Eastern Cooperative Oncology Group (ECOG) Performance Status (PS) of 0 or 1.
Patients were randomly allocated to one of 3 arms: 18 mg of lenvatinib plus 5 mg of everolimus, 24 mg of lenvatinib or 10 mg of everolimus using a 1:1:1 ratio. Patients were stratified by haemoglobin level (≤13 g/dL vs. >13 g/dL for males and ≤11.5 g/dL vs >11.5 g/dL for females) and corrected serum calcium (≥10 mg/dL vs. <10 mg/dL). The median of average daily dose in the combination arm per patient was 13.5 mg of lenvatinib (75.0% of the intended dose of 18 mg) and 4.7 mg of everolimus (93.6% of the intended dose of 5 mg). The final dose level in the combination arm was 18 mg for 29% of patients, 14 mg for 31% of patients, 10 mg for 23% of patients, 8 mg for 16% of patients and 4 mg for 2% of patients.
Of the 153 patients randomly allocated, 73% were male, the median age was 61 years, 37% were 65 years or older, 7% were 75 years or older, and 97% were Caucasian. Metastases were present in 95% of the patients and unresectable advanced disease was present in 5%. All patients had a baseline ECOG PS of either 0 (55%) or 1 (45%) with similar distribution across the 3 treatment arms. Memorial Sloan Kettering Cancer Centre (MSKCC) poor risk was observed in 39% of patients in the lenvatinib plus everolimus arm, 44% in the lenvatinib arm and 38% in the everolimus arm. International mRCC Database Consortium (IMDC) poor risk was observed in 20% of patients in the lenvatinib plus everolimus arm, 23% in the lenvatinib arm, and 24% in the everolimus arm. The median time from diagnosis to first dose was 32 months in the lenvatinib plus everolimus-treatment arm, 33 months in the lenvatinib arm and 26 months in the everolimus arm. All patients had been treated with 1 prior VEGF-inhibitor; 65% with sunitinib, 23% with pazopanib, 4% with tivozanib, 3% with bevacizumab, and 2% each with sorafenib or axitinib.
The primary efficacy outcome measure, based on investigator assessed tumour response, was PFS of the lenvatinib plus everolimus arm vs the everolimus arm and of the lenvatinib arm vs the everolimus arm. Other efficacy outcome measures included OS and investigator-assessed ORR. Tumour assessments were evaluated according to RECIST 1.1.
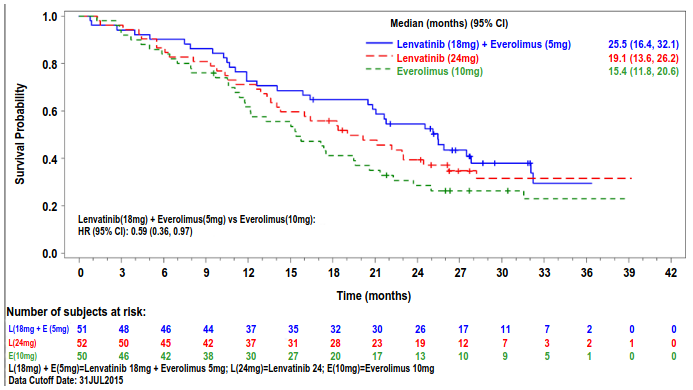
The lenvatinib plus everolimus arm showed a statistically significant and clinically meaningful improvement in PFS compared with the everolimus arm (see Table 7 and Figure 3). Based on the results of a post-hoc exploratory analysis in a limited number of patients per subgroup, the positive effect on PFS was seen regardless of which prior VEGF-targeted therapy was used: sunitinib (Hazard ratio [HR] = 0.356 [95% CI: 0.188, 0.674] or other therapies (HR = 0.350 [95% CI: 0.148, 0.828]). The lenvatinib arm also showed an improvement in PFS compared with the everolimus arm. Overall survival was longer in the lenvatinib plus everolimus arm (see Table 7 and Figure 4). The study was not powered for the OS analysis.
The treatment effect of the combination on PFS and ORR was also supported by a post-hoc retrospective independent blinded review of scans. The lenvatinib plus everolimus arm showed a statistically significant and clinically meaningful improvement in PFS compared with the everolimus arm. Results for ORR were consistent with that of the investigators' assessments, 35.3% in the lenvatinib plus everolimus arm, with one complete response and 17 partial responses; no patient had an objective response in the everolimus arm (P < 0.0001) in favour of the lenvatinib plus everolimus arm.
Table 7. Efficacy results following one prior VEGF targeted therapy in RCC Study 205:
| lenvatinib 18 mg + everolimus 5 mg (N=51) | lenvatinib 24 mg (N=52) | everolimus 10 mg (N=50) | |
|---|---|---|---|
| Progression-free survival (PFS)a by investigator assessment | |||
| Median PFS in months (95% CI) | 14.6 (5.9, 20.1) | 7.4 (5.6, 10.2) | 5.5 (3.5, 7.1) |
| Hazard Ratio (95% CI)b lenvatinib + everolimus vs everolimus | 0.40 (0.24, 0.67) | - | - |
| P value lenvatinib + everolimus vs everolimus | 0.0005 | - | - |
| Progression-free survival (PFS)a by post-hoc retrospective independent review | |||
| Median PFS in months (95% CI) | 12.8 (7.4, 17.5) | 9.0 (5.6, 10.2) | 5.6 (3.6, 9.3) |
| Hazard Ratio (95% CI)b lenvatinib + everolimus vs everolimus | 0.45 (0.26, 0.79) | - | - |
| P value lenvatinib + everolimus vs everolimus | 0.003 | - | - |
| Overall Survivalc | |||
| Number of deaths, n (%) | 32 (63) | 34 (65) | 37 (74) |
| Median OS in months (95% CI) | 25.5 (16.4, 32.1) | 19.1 (13.6, 26.2) | 15.4 (11.8, 20.6) |
| Hazard Ratio (95% CI)b lenvatinib + everolimus vs everolimus | 0.59 (0.36, 0.97) | - | - |
| Objective Response Rate n (%) by investigator assessment | |||
| Complete responses | 1 (2) | 0 | 0 |
| Partial responses | 21 (41) | 14 (27) | 3 (6) |
| Objective Response Rate | 22 (43) | 14 (27) | 3 (6) |
| Stable disease | 21 (41) | 27 (52) | 31 (62) |
| Duration of response, months, median (95% CI) | 13.0 (3.7, NE) | 7.5 (3.8, NE) | 8.5 (7.5, 9.4) |
Tumour assessment was based on RECIST 1.1 criteria. Data cut-off date = 13 Jun 2014
Percentages are based on the total number of patients in the Full Analysis Set within relevant treatment group.
CI = confidence interval, NE = not estimable
a Point estimates are based on Kaplan-Meier method and 95% CIs are based on the Greenwood formula using log-log transformation.
b Stratified hazard ratio is based on a stratified Cox regression model including treatment as a covariate factor and haemoglobin and corrected serum calcium as strata. The Efron method was used for correction for tied events.
c Data cut-off date = 31 Jul 2015
Figure 3. Kaplan-Meier Plot of Progression-Free Survival (Investigator Assessment):
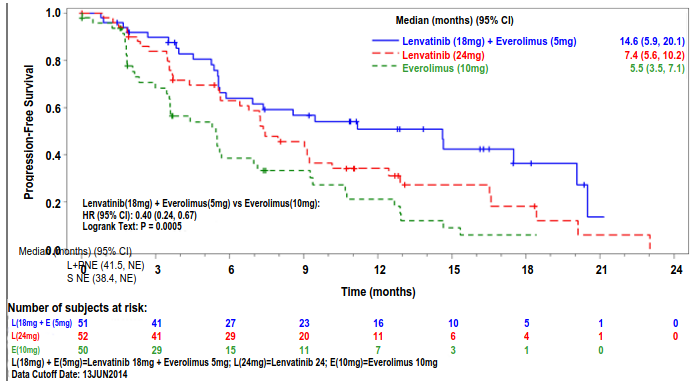
Figure 4. Kaplan-Meier Plot of Overall Survival:
Paediatric population
The European Medicines Agency has deferred the obligation to submit the results of studies with lenvatinib in one or more subsets of the paediatric population in the treatment of renal cell carcinoma (RCC) (see section 4.2 for information on paediatric use).
Paediatric studies
The efficacy of lenvatinib was assessed but not established in two open-label studies (for additional paediatric information see also Lenvima SmPC section 5.1):
Study 216 was a multicentre, open-label, single-arm, Phase ½ study to determine the safety, tolerability, and antitumour activity of lenvatinib administered in combination with everolimus in paediatric patients (and young adults aged ≤21 years) with relapsed or refractory solid malignancies, including CNS tumours. A total of 64 patients were enrolled and treated. In Phase 1 (combination dose-finding), 23 patients were enrolled and treated: 5 at Dose Level –1 (lenvatinib 8 mg/m² and everolimus 3 mg/m²) and 18 at Dose Level 1 (lenvatinib 11 mg/m² and everolimus 3 mg/m²). The recommended dose (RD) of the combination was lenvatinib 11 mg/m² and everolimus 3 mg/m², taken once daily. In Phase 2 (combination expansion), 41 patients were enrolled and treated at the RD in the following cohorts: Ewing Sarcoma (EWS, n=10), Rhabdomyosarcoma (RMS, n=20), and High-grade glioma (HGG, n=11). The primary efficacy outcome measure was objective response rate (ORR) at Week 16 in evaluable patients based on investigator assessment using RECIST v1.1 or RANO (for patients with HGG). There were no objective responses observed in the EWS and HGG cohorts; 2 partial responses (PRs) were observed in the RMS cohort for an ORR at Week 16 of 10% (95% CI: 1.2, 31.7).
Study 231 is a multicentre, open-label, Phase 2 basket study to evaluate the antitumour activity and safety of lenvatinib in children, adolescents, and young adults between 2 to ≤21 years of age with relapsed or refractory solid malignancies, including EWS, RMS, and HGG. A total of 127 patients were enrolled and treated at the lenvatinib RD (14 mg/m²) in the following cohorts: EWS (n=9), RMS (n=17), HGG (n=8), and other solid tumours (n=9 each for diffuse midline glioma, medulloblastoma, and ependymoma; all other solid tumours n=66). The primary efficacy outcome measure was ORR at Week 16 in evaluable patients based on investigator assessment using RECIST v1.1 or RANO (for patients with HGG). There were no objective responses observed in patients with HGG, diffuse midline glioma, medulloblastoma, or ependymoma. Two PRs were observed in both the EWS and RMS cohorts for an ORR at Week 16 of 22.2% (95% CI: 2.8, 60.0) and 11.8% (95% CI: 1.5, 36.4), respectively. Five PRs (in patients with synovial sarcoma [n=2], kaposiform hemangioendothelioma [n=1], Wilms tumour nephroblastoma [n=1], and clear cell carcinoma [n=1]) were observed among all other solid tumours for an ORR at Week 16 of 7.7% (95% CI: 2.5, 17.0).
5.2. Pharmacokinetic properties
Pharmacokinetic parameters of lenvatinib have been studied in healthy adult subjects, adult subjects with hepatic impairment, renal impairment, and solid tumours.
Absorption
Lenvatinib is rapidly absorbed after oral administration with tmax typically observed from 1 to 4 hours postdose. Food does not affect the extent of absorption, but slows the rate of absorption. When administered with food to healthy subjects, peak plasma concentrations are delayed by 2 hours. Absolute bioavailability has not been determined in humans; however, data from a mass-balance study suggests that it is in the order of 85%.
Distribution
In vitro binding of lenvatinib to human plasma proteins is high and ranged from 98% to 99% (0.3-30 μg/mL, mesilate). This binding was mainly to albumin with minor binding to α1-acid glycoprotein and γ-globulin. A similar plasma protein binding (97% to 99%) with no dependencies on lenvatinib concentrations (0.2 to 1.2 μg/mL) was observed in plasma from hepatically impaired, renally impaired, and matching healthy subjects.
In vitro, the lenvatinib blood-to-plasma concentration ratio ranged from 0.589 to 0.608 (0.1–10 μg/mL, mesilate).
In vitro studies indicate that lenvatinib is a substrate for P-gp and BCRP. Lenvatinib shows minimal or no inhibitory activities toward P-gp mediated and BCRP mediated transport activities. Similarly, no induction of P-gp mRNA expression was observed. Lenvatinib is not a substrate for OAT1, OAT3, OATP1B1, OATP1B3, OCT1, OCT2, or the BSEP. In human liver cytosol, lenvatinib did not inhibit aldehyde oxidase activity.
In patients, the median apparent volume of distribution (Vz/F) of the first dose ranged from 50.5 L to 92 L and was generally consistent across the dose groups from 3.2 mg to 32 mg. The analogous median apparent volume of distribution at steady-state (Vz/Fss) was also generally consistent and ranged from 43.2 L to 121 L.
Biotransformation
In vitro, cytochrome P450 3A4 was demonstrated as the predominant (>80%) isoform involved in the P450-mediated metabolism of lenvatinib. However, in vivo data indicated that non-P450-mediated pathways contributed to a significant portion of the overall metabolism of lenvatinib. Consequently, in vivo, inducers and inhibitors of CYP 3A4 had a minimal effect on lenvatinib exposure (see section 4.5).
In human liver microsomes, the demethylated form of lenvatinib (M2) was identified as the main metabolite. M2' and M3', the major metabolites in human faeces, were formed from M2 and lenvatinib, respectively, by aldehyde oxidase.
In plasma samples collected up to 24 hours after administration, lenvatinib constituted 97% of the radioactivity in plasma radiochromatograms while the M2 metabolite accounted for an additional 2.5%. Based on AUC(0–inf), lenvatinib accounted for 60% and 64% of the total radioactivity in plasma and blood, respectively.
Data from a human mass balance/excretion study indicate lenvatinib is extensively metabolised in humans. The main metabolic pathways in humans were identified as oxidation by aldehyde oxidase, demethylation via CYP3A4, glutathione conjugation with elimination of the O-aryl group (chlorophenyl moiety), and combinations of these pathways followed by further biotransformations (e.g., glucuronidation, hydrolysis of the glutathione moiety, degradation of the cysteine moiety, and intramolecular rearrangement of the cysteinylglycine and cysteine conjugates with subsequent dimerisation). These in vivo metabolic routes align with the data provided in the in vitro studies using human biomaterials.
In vitro transporter studies
Please see distribution section.
Elimination
Plasma concentrations decline bi-exponentially following Cmax. The mean terminal exponential half-life of lenvatinib is approximately 28 hours.
Following administration of radiolabelled lenvatinib to 6 patients with solid tumours, approximately two-thirds and one-fourth of the radiolabel were eliminated in the faeces and urine, respectively. The M3 metabolite was the predominant analyte in excreta (~17% of the dose), followed by M2' (~11% of the dose) and M2 (~4.4 of the dose).
Linearity/non-linearity
Dose proportionality and accumulation
In patients with solid tumours administered single and multiple doses of lenvatinib once daily, exposure to lenvatinib (Cmax and AUC) increased in direct proportion to the administered dose over the range of 3.2 to 32 mg once-daily.
Lenvatinib displays minimimal accumulation at steady state. Over this range, the median accumulation index (Rac) ranged from 0.96 (20 mg) to 1.54 (6.4 mg).
Special populations
Hepatic impairment
The pharmacokinetics of lenvatinib following a single 10-mg dose were evaluated in 6 subjects each with mild and moderate hepatic impairment (Child-Pugh A and Child-Pugh B, respectively). A 5-mg dose was evaluated in 6 subjects with severe hepatic impairment (Child-Pugh C). Eight healthy, demographically matched subjects served as controls and received a 10-mg dose. The median half-life was comparable in subjects with mild, moderate, and severe hepatic impairment as well as those with normal hepatic function and ranged from 26 hours to 31 hours. The percentage of the dose of lenvatinib excreted in urine was low in all cohorts (<2.16% across treatment cohorts).
Lenvatinib exposure, based on dose-adjusted AUC(0-t) and AUC(0-inf) data, was 119%, 107%, and 180% of normal for subjects with mild, moderate, and severe hepatic impairment, respectively. It has been determined that plasma protein binding in plasma from hepatically impaired subjects was similar to the respective matched healthy subjects and no concentration dependency was observed. See section 4.2 for dosing recommendation.
Renal impairment
The pharmacokinetics of lenvatinib following a single 24-mg dose were evaluated in 6 subjects each with mild, moderate, and severe renal impairment, and compared with 8 healthy, demographically matched subjects. Subjects with end-stage renal disease were not studied.
Lenvatinib exposure, based on AUC(0-inf) data, was 101%, 90%, and 122% of normal for subjects with mild, moderate, and severe renal impairment, respectively. It has been determined that plasma protein binding in plasma from renally impaired subjects was similar to the respective matched healthy subjects and no concentration dependency was observed. See section 4.2 for dosing recommendation.
Age, sex, weight, ethnic origin
Based on a population pharmacokinetic analysis of patients receiving up to 24 mg lenvatinib once daily, age, sex, weight, and race (Japanese vs. other, Caucasian vs. other) had no significant effects on clearance (see section 4.2).
Paediatric population
Based on a population pharmacokinetics analysis in paediatric patients of 2 to 12 years old, which included data from 3 paediatric patients aged 2 to <3 years, 28 paediatric patients aged ≥3 to <6 years and 89 paediatric patients aged 6 to ≤12 years across the lenvatinib paediatric program, lenvatinib oral clearance (CL/F) was affected by body weight but not age. Predicted exposure levels in terms of area under the curve at steady-state (AUCss) in paediatric patients receiving 14 mg/m² were comparable to those in adult patients receiving a fixed dose of 24 mg. In these studies, there were no apparent differences in the pharmacokinetics of active substance lenvatinib among children (2–12 years), adolescents, and young adult patients with studied tumour types, but data in children are relatively limited to draw definite conclusions (see section 4.2).
5.3. Preclinical safety data
In the repeated-dose toxicity studies (up to 39 weeks), lenvatinib caused toxicologic changes in various organs and tissues related to the expected pharmacologic effects of lenvatinib including glomerulopathy, testicular hypocellularity, ovarian follicular atresia, gastrointestinal changes, bone changes, changes to the adrenals (rats and dogs), and arterial (arterial fibrinoid necrosis, medial degeneration, or haemorrhage) lesions in rats, dogs, and cynomolgus monkeys. Elevated transaminase levels asociated with signs of hepatotoxicity, were also observed in rats, dogs and monkeys. Reversibility of the toxicologic changes was observed at the end of a 4-week recovery period in all animal species investigated.
Genotoxicity
Lenvatinib was not genotoxic.
Carcinogenicity studies have not been conducted with lenvatinib.
Reproductive and developmental toxicity
No specific studies with lenvatinib have been conducted in animals to evaluate the effect on fertility. However, testicular (hypocellularity of the seminiferous epithelium) and ovarian changes (follicular atresia) were observed in repeated-dose toxicity studies in animals at exposures 11 to 15 times (rat) or 0.6 to 7 times (monkey) the anticipated clinical exposure (based on AUC) at the maximum tolerated human dose. These findings were reversible at the end of a 4-week recovery period.
Administration of lenvatinib during organogenesis resulted in embryolethality and teratogenicity in rats (foetal external and skeletal anomalies) at exposures below the clinical exposure (based on AUC) at the maximum tolerated human dose, and rabbits (foetal external, visceral or skeletal anomalies) based on body surface area; mg/m² at the maximum tolerated human dose. These findings indicate that lenvatinib has a teratogenic potential, likely related to the pharmacologic activity of lenvatinib as an antiangiogenic agent.
Lenvatinib and its metabolites are excreted in rat milk.
Juvenile animal toxicity studies
Mortality was the dose-limiting toxicity in juvenile rats in which dosing was initiated on postnatal day (PND) 7 or PND21 and was observed at exposures that were respectively 125- or 12-fold lower compared with the exposure at which mortality was observed in adult rats, suggesting an increasing sensitivity to toxicity with decreasing age. Therefore mortality may be attributed to complications related to primary duodenal lesions with possible contribution from additional toxicities in immature target organs.
The toxicity of lenvatinib was more prominent in younger rats (dosing initiated on PND7) compared with those with dosing initiated on PND21 and mortality and some toxicities were observed earlier in the juvenile rats at 10 mg/kg compared with adult rats administered the same dose level. Growth retardation, secondary delay of physical development, and lesions attributable to pharmacologic effects (incisors, femur [epiphyseal growth plate], kidneys, adrenals, and duodenum) were also observed in juvenile rats.
© All content on this website, including data entry, data processing, decision support tools, "RxReasoner" logo and graphics, is the intellectual property of RxReasoner and is protected by copyright laws. Unauthorized reproduction or distribution of any part of this content without explicit written permission from RxReasoner is strictly prohibited. Any third-party content used on this site is acknowledged and utilized under fair use principles.