LEROCHOL Solution for injection Ref.[116114] Active ingredients: Lerodalcibep
Source: FDA, National Drug Code (US) Revision Year: 2025
12.1. Mechanism of Action
Lerodalcibep-liga is a recombinant fusion protein that binds PCSK9 with picomolar affinity. PCSK9 binds to low-density lipoprotein receptor (LDLR) on the surface of hepatocytes to promote LDLR degradation within the liver. By inhibiting the binding of PCSK9 to LDLR, lerodalcibep-liga increases the number of LDLRs available to clear LDL-C from the blood, thereby lowering LDL-C levels [see Clinical Pharmacology (12.3)].
12.2. Pharmacodynamics
After subcutaneous administration of 300 mg lerodalcibep-liga every month, greater than 90% suppression of PCSK9 occurs within 24 hours after dosing and is maintained throughout the dosing interval, returning toward baseline during the last 7 to 10 days of the monthly dosing period.
12.3. Pharmacokinetics
Following a single subcutaneous administration, exposure to lerodalcibep-liga increased in a dose proportional manner over the dose range 75 to 300 mg of lerodalcibep-liga.
Lerodalcibep-liga pharmacokinetics were observed at steady state in patients at the approved recommended dosage and are presented as mean (SD), unless otherwise specified. Lerodalcibep-liga maximum concentration (Cmax) is 31.4 (10.2) mcg/mL, and total systemic exposure (AUC0-tau) is 12,600 (5,190) (hrs*mcg/mL) following subcutaneous dose of lerodalcibep-liga 300 mg once every four weeks. Lerodalcibep-liga steady-state is reached following 2 to 3 doses. Lerodalcibep-liga accumulation is approximately 30% at the approved recommended dosage.
Absorption
The median (min, max) estimated subcutaneous bioavailability of lerodalcibep-liga is 83% (66%, 89%). The median (min, max) time to maximum plasma concentration (Tmax) is 6 days (2, 9 days) at steady state.
Distribution
Lerodalcibep-liga does not extensively distribute into tissues; the apparent volume of distribution is 5.3 L.
Elimination
As a protein, lerodalcibep-liga is expected to degrade to small peptides and amino acids. Clearance of free lerodalcibep-liga (CV%) is 0.36 L/day (30%) with an estimated half-life of approximately 10 days. The estimated elimination rate of lerodalcibep-liga (CV%) bound to PCSK9 is 0.47 L/day (22%) which corresponds to a half-life of approximately 1.5 days.
Specific Populations
No clinically significant differences in the pharmacokinetics of LEROCHOL were observed based on age (21 to 78 years), body weight, sex, race, mild (eGFR 60 to 89 mL/min) or moderate (eGFR 30 to 59 mL/min) renal impairment, or mild (total bilirubin 1.0 to 1.5 upper limit of normal or aspartate aminotransaminase greater than the upper limit of normal) or moderate (total bilirubin 1.5 to 3.0 upper limit of normal) hepatic impairment. The effect of severe renal impairment (eGFR less than 30 mL/min) or severe hepatic impairment on LEROCHOL pharmacokinetics is unknown.
Drug Interaction Studies
No formal clinical drug interaction studies have been performed.
13.1. Carcinogenesis, Mutagenesis, Impairment of Fertility
Carcinogenicity studies have not been performed with lerodalcibep-liga.
The mutagenic potential of lerodalcibep-liga has not been evaluated; however, proteins are not expected to directly interact with DNA or chromosomes.
Fertility studies were not performed. However, in a chronic 6-month toxicology study in sexually mature cynomolgus monkeys, no adverse lerodalcibep-liga-related effects on surrogate markers of fertility (reproductive organ histopathology, menstrual cycling, or sperm parameters) were observed when lerodalcibep-liga was administered subcutaneously at 30 and 100 mg/kg once weekly. The highest dose tested corresponds to 138-fold the recommended human dose of 300 mg every month based on serum AUC.
14. Clinical Studies
The efficacy of LEROCHOL was evaluated in three randomized, double-blind, placebo- controlled trials that enrolled 2,017 adults with HeFH, clinical ASCVD, or increased risk for ASCVD, who were on a stable low-fat, low-cholesterol diet and maximally tolerated statin therapy and who required additional LDL-C lowering.
Primary Hypercholesterolemia
Trial 1 (NCT04797247) and Trial 2 (NCT04806893) were both multicenter, double-blind, randomized, placebo-controlled 52-week trials in which 1,844 adults with ASCVD or at increased risk for ASCVD events were randomized 2:1 to receive subcutaneous injections of either LEROCHOL 300 mg (n=1,229) or placebo (n=615) every 4 weeks. Patients were stable on a low-fat, low-cholesterol diet, maximally tolerated dose of statin with or without other oral lipid modifying therapy, and required additional LDL-C reduction.
Baseline Disease and Demographic Characteristics
The mean age in Trial 1 at baseline was 64 years (range: 25 to 90 years), 49% were 65 years or older, 30% were female, 80% were White, 17% were Black or African American, and 3% were Asian; 1.1% identified as Hispanic or Latino ethnicity. Thirty four percent (34%) of patients had diabetes at baseline, 86% established ASCVD, and 14% at increased risk for CVD events. The mean baseline LDL-C was 102 mg/dL. At the time of randomization, 87% of patients were receiving statin therapy and of these 53% were receiving high-intensity statin therapy; 18% were receiving ezetimibe either in combination with a statin or alone.
The mean age in Trial 2 at baseline was 65 years (range: 27 to 87 years), 54% were 65 years or older, 45% were female, 78% were White, 18% were Black or African American, and 4% were Asian; 13% identified as Hispanic or Latino ethnicity. Forty-three percent (43%) of patients had diabetes at baseline, 48% established ASCVD, and 52% at increased risk for CVD events. The mean baseline LDL-C was 116 mg/dL. At the time of randomization, 83% of patients were receiving statin therapy and of these, 39% were on high-intensity doses; 17% were receiving ezetimibe either in combination with a statin or alone.
Endpoint Results
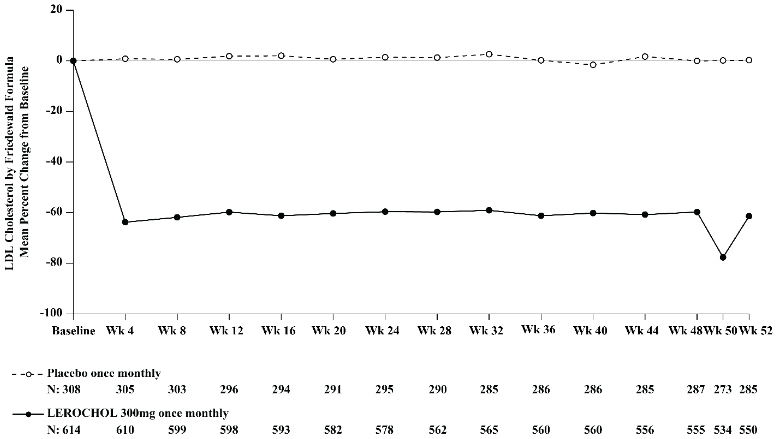
The primary efficacy outcome measure in Trial 1 was the placebo adjusted intent to treat (ITT) analysis of percent change in LDL-C from baseline to Week 52. The difference between the LEROCHOL and placebo group in mean percentage change in LDL-C from baseline to Week 52 was -55% (95% CI: -59.2%, -50.8%; p<0.0001). For additional results, see Table 3 and Figure 1.
Table 3. Changes in Lipid Parameters in Patients with Hypercholesterolemia and ASCVD or Increased Risk for ASCVD Events on Maximally Tolerated Statin Therapy (Percent Change from Baseline to Week 52 in Trial 1):
| Treatment Group | LDL-Ca | Total Cholesterola | Non-HDL-Ca | ApoBa |
| Placebo (n=308) | -0.1 | -0.2 | -0.7 | +1 |
| LEROCHOL 300 mg (n=614) | -55 | -31 | -46 | -39 |
| Difference from placebo (LS Mean) (95% CI) | -55b,c (-59, -51) | -31b,d (-33, -28) | -45b,d (-48, -41) | -40b,d (-44, -37) |
Abbreviation: ApoB = apolipoprotein B; CI = confidence interval; HDL-C = high-density lipoprotein cholesterol; LDL-C = low-density lipoprotein cholesterol; n = number of patients randomly assigned to each treatment group; LS Mean = least-squares mean
a LDL-C, Total Cholesterol, non-HDL-C and ApoB at Week 52 were missing for 7.5% and 10.4% of patients assigned to placebo and LEROCHOL, respectively. Multiple imputation washout model was implemented for imputing missing values at Week 52.
b Least-squares mean from an Analysis of Covariance (ANCOVA) model including treatment as a factor and baseline value as a covariate, assuming unequal variances between groups.
c p-value <0.001 for superiority, controlled for Type I error rate.
d Not controlled for Type I error rate.
Figure 1. Mean Percent Change from Baseline in LDL-C Over 52 Weeks in Patients with Hypercholesterolemia and ASCVD or Increased Risk for ASCVD Events on Maximally Tolerated Statin Therapy (Trial 1):
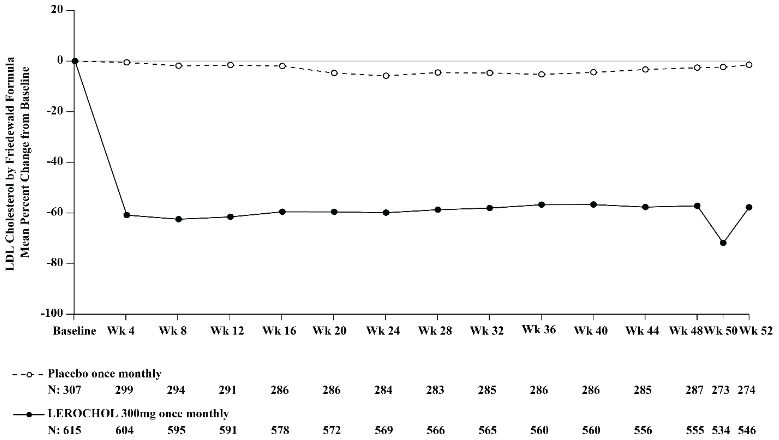
The primary efficacy outcome measure in Trial 2 was the percent change in LDL-C from baseline compared to placebo to Week 52. The difference between the LEROCHOL and placebo groups by ITT analysis in mean percentage change in LDL-C from baseline to Week 52 was -50% (95% CI: -54.2%, -45.2%; p<0.0001). For additional results, see Table 4 and Figure 2.
Table 4. Changes in Lipid Parameters in Patients with Hypercholesterolemia and ASCVD or Increased Risk for ASCVD Events on Maximally Tolerated Statin Therapy (Percent Change from Baseline to Week 52 in Trial 2):
| Treatment Group | LDL-Ca | Total Cholesterola | Non-HDL-Ca | ApoBa |
| Placebo (n=307) | +0.3 | +1 | +1 | +2 |
| LEROCHOL 300 mg (n=615) | -49 | -28 | -41 | -36 |
| Difference from placebo (LS Mean) (95% CI) l | -50b,c (-54, -45) | -29b,d (-32, -26) | -42b,d (-46, -38) | -38b,d (-42, -35) |
Abbreviation: ApoB = apolipoprotein B; CI = confidence interval; HDL-C = high-density lipoprotein cholesterol; LDL-C = low-density lipoprotein cholesterol; n = number of patients randomly assigned to each treatment group; LS Mean = least-squares mean
a LDL-C and non-HDL-C at Week 52 were missing for 10.7% and 11.2% of patients assigned to placebo and LEROCHOL, respectively. Total Cholesterol and ApoB at Week 52 were missing for 10.4% and 11.2% of patients assigned to placebo and LEROCHOL, respectively. Multiple imputation washout model was implemented for imputing missing values at Week 52.
b Least-squares mean from an Analysis of Covariance (ANCOVA) model including treatment and CVD status as factors and baseline value as a covariate, assuming unequal variances between groups.
c p-value < 0.001 for superiority, controlled for Type I error rate.
d Not controlled for Type I error rate.
Figure 2. Mean Percent Change from Baseline in LDL-C Over 52 Weeks in Patients with Hypercholesterolemia and ASCVD or Increased Risk for ASCVD Events on Maximally Tolerated Statin Therapy (Trial 2):
Heterozygous Familial Hypercholesterolemia in Adults
Trial 3 (NCT04797104) was a multicenter, double-blind, randomized, placebo-controlled 24-week trial in which 478 patients with HeFH were randomized 2:1 to receive subcutaneous injections of either LEROHOL 300 mg (n=319) or placebo (n=159) every 4 weeks. Patients were stable on diet, maximally tolerated dose of statin, with or without other oral lipid modifying therapy, and required additional LDL-C reduction.
Baseline Disease and Demographic Characteristics
The mean age at baseline was 53 years (range: 18 to 80 years), 19% were aged 65 years or older, 52% were female, 87% were White, 8% were Black or African American, and 5% were Asian; 1% identified as Hispanic or Latino ethnicity. Forty-five percent of patients had diabetes at baseline. The mean baseline LDL-C was 150 mg/dL. At the time of randomization, 89% of patients were receiving statin therapy with 67% receiving high-intensity doses, and 49% also on ezetimibe.
Endpoint Results
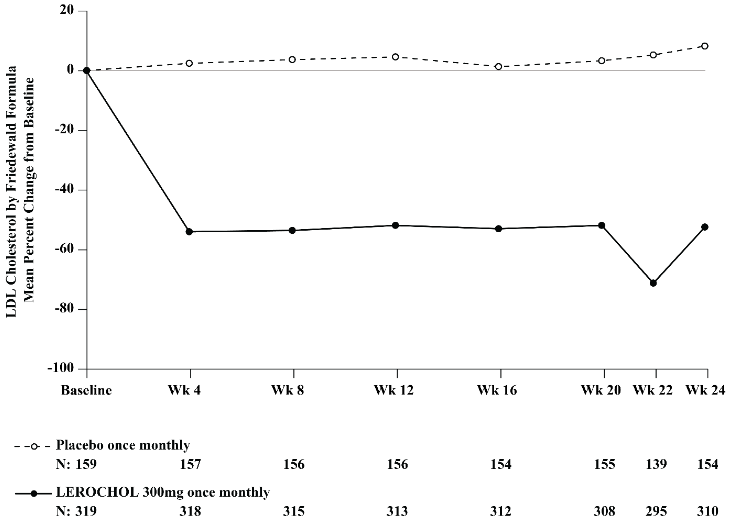
The primary efficacy outcome measure in Trial 3 was the percent change in LDL-C from baseline to Week 24. The difference between the LEROCHOL and placebo groups in mean percentage change in LDL-C from baseline to Week 24 was -59% (95% CI: -65.7%, -51.7%; p<0.0001). For additional results, see Table 5 and Figure 3.
Table 5. Changes in Lipid Parameters in Patients with HeFH, on Maximally Tolerated Statin Therapy (Percent Change from Baseline to Week 24 in Trial 3):
| Treatment Group | LDL-Ca | Total Cholesterola | Non-HDL-Ca | ApoBa |
| Placebo (n=159) | +8 | +5 | +7 | +7 |
| LEROCHOL 300 mg (n=319) | -51 | -32 | -44 | -37 |
| Difference from placebo (LS Mean) (95% CI) | -59b,c (-66, -52) | -37b,d (-41, -32) | -51b,d (-57, -45) | -44b,d (-49, -39) |
Abbreviation: ApoB = apolipoprotein B; CI = confidence interval; HDL-C = high-density lipoprotein cholesterol; LDL-C = low-density lipoprotein cholesterol; n = number of patients randomly assigned to each treatment group; LS Mean = least-squares mean
a LDL-C, Total Cholesterol and non-HDL-C at Week 24 were missing for 3.1% and 2.8% of patients assigned to placebo and LEROCHOL, respectively. ApoB at Week 24 was missing for 3.1% and 3.1% of patients assigned to placebo and LEROCHOL, respectively. Multiple imputation washout model was implemented for imputing missing values at Week 24.
b Least-squares mean from an Analysis of Covariance (ANCOVA) model including treatment and CVD status as factors and baseline value as a covariate, assuming unequal variances between groups.
c p-value < 0.001 for superiority, controlled for Type I error rate.
d Not controlled for Type I error rate.
Figure 3. Mean Percent Change from Baseline in LDL-C Over 24 Weeks in Patients with HeFH on Maximally Tolerated Statin Therapy (Trial 3):
© All content on this website, including data entry, data processing, decision support tools, "RxReasoner" logo and graphics, is the intellectual property of RxReasoner and is protected by copyright laws. Unauthorized reproduction or distribution of any part of this content without explicit written permission from RxReasoner is strictly prohibited. Any third-party content used on this site is acknowledged and utilized under fair use principles.