MOUNJARO Solution for injection Ref.[50478] Active ingredients: Tirzepatide
Source: European Medicines Agency (EU) Revision Year: 2026 Publisher: Eli Lilly Nederland B.V., Papendorpseweg 83, 3528 BJ Utrecht, The Netherlands
5.1. Pharmacodynamic properties
Pharmacotherapeutic group: Drugs used in diabetes, blood glucose lowering drugs, excl. insulins
ATC code: A10BX16
Mechanism of action
Tirzepatide is a long acting GIP and GLP-1 receptor agonist, highly selective to human GIP and GLP-1 receptors. Tirzepatide has high affinity to both the GIP and GLP-1 receptors. The activity of tirzepatide on the GIP receptor is similar to native GIP hormone. The activity of tirzepatide on the GLP-1 receptor is lower compared to native GLP-1 hormone. Both receptors are present on the pancreatic α and β endocrine cells, heart, vasculature, immune cells (leukocytes), gut and kidney. GIP receptors are also present on adipocytes.
In addition, both GIP and GLP-1 receptors are expressed in the areas of the brain important to appetite regulation. Animal studies show that tirzepatide distributes to and activates neurons in brain regions involved in regulation of appetite and food intake. Animal studies show that tirzepatide can modulate fat utilization through the GIP receptor. In human adipocytes cultured in vitro, tirzepatide acts on GIP receptors to regulate glucose uptake and modulate lipid uptake and lipolysis.
Glycaemic control
Tirzepatide improves glycaemic control by lowering fasting and postprandial glucose concentrations in patients with type 2 diabetes through several mechanisms.
Appetite regulation and energy metabolism
Tirzepatide lowers body weight and body fat mass. The body weight reduction is mostly due to reduced fat mass. The mechanisms associated with body weight and body fat mass reduction involve decreased food intake through the regulation of appetite. Clinical studies show that tirzepatide reduces energy intake and appetite by increasing feelings of satiety and fullness, and decreasing feelings of hunger. Tirzepatide also reduces the intensity of food cravings and preferences for high sugar and high fat foods. Tirzepatide modulates fat utilisation.
Pharmacodynamic effects
Insulin secretion
Tirzepatide increases pancreatic β-cell glucose sensitivity. It enhances first- and second-phase insulin secretion in a glucose dependent manner.
In a hyperglycaemic clamp study in patients with type 2 diabetes, tirzepatide was compared to placebo and the selective GLP-1 receptor agonist semaglutide 1 mg for insulin secretion. Tirzepatide 15 mg enhanced the first and second-phase insulin secretion rate by 466% and 302% from baseline, respectively. There was no change in first- and second-phase insulin secretion rate for placebo.
Insulin sensitivity
Tirzepatide improves insulin sensitivity.
Tirzepatide 15 mg improved whole body insulin sensitivity by 63%, as measured by M-value, a measure of glucose tissue uptake using hyperinsulinemic euglycaemic clamp. The M-value was unchanged for placebo.
Tirzepatide lowers body weight in patients with obesity and overweight, and in patients with type 2 diabetes (irrespective of body weight), which may contribute to improvement in insulin sensitivity.
Glucagon concentration
Tirzepatide reduced the fasting and postprandial glucagon concentrations in a glucose dependent manner. Tirzepatide 15 mg reduced fasting glucagon concentration by 28% and glucagon AUC after a mixed meal by 43%, compared with no change for placebo.
Gastric emptying
Tirzepatide delays gastric emptying which may slow post meal glucose absorption and can lead to a beneficial effect on postprandial glycaemia. Tirzepatide induced delay in gastric emptying diminishes over time.
Clinical efficacy and safety
Type 2 diabetes mellitus
The safety and efficacy of tirzepatide were evaluated in five global randomised, controlled, phase 3 studies (SURPASS 1-5) assessing glycaemic control as the primary objective. The studies involved 6 263 treated patients with type 2 diabetes (4 199 treated with tirzepatide). The secondary objectives included body weight, fasting serum glucose (FSG) and proportion of patients reaching target HbA1c. All five phase 3 studies assessed tirzepatide 5 mg, 10 mg and 15 mg. All patients treated with tirzepatide started with 2.5 mg for 4 weeks. Then the dose of tirzepatide was increased by 2.5 mg every 4 weeks until they reached their assigned dose.
Across all studies, treatment with tirzepatide demonstrated sustained, statistically significant and clinically meaningful reductions from baseline in HbA1c as the primary objective compared to either placebo or active control treatment (semaglutide, insulin degludec and insulin glargine) for up to 1 year. In 1 study these effects were sustained for up to 2 years. Statistically significant and clinically meaningful reductions from baseline in body weight were also demonstrated. Results from the phase 3 studies are presented below based on the on-treatment data without rescue therapy in the modified intent-to-treat (mITT) population consisting of all randomly assigned patients who were exposed to at least 1 dose of study treatment, excluding patients discontinuing study treatment due to inadvertent enrolment.
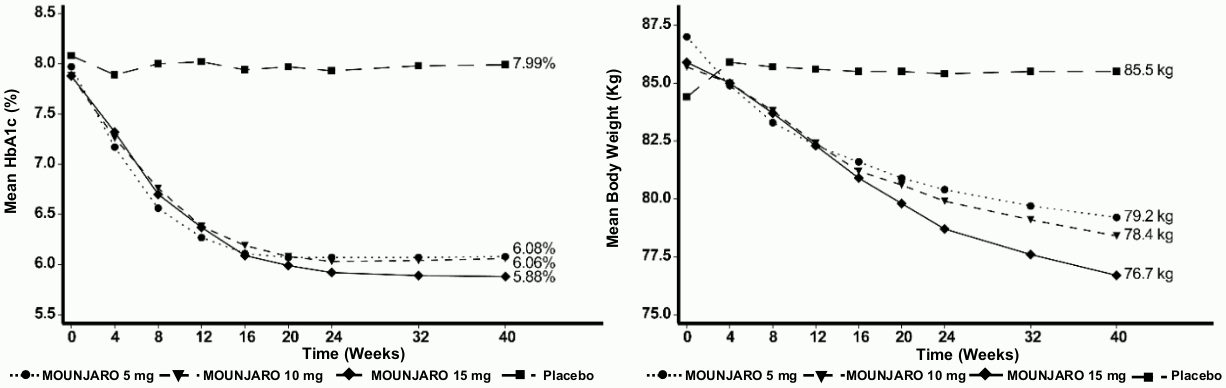
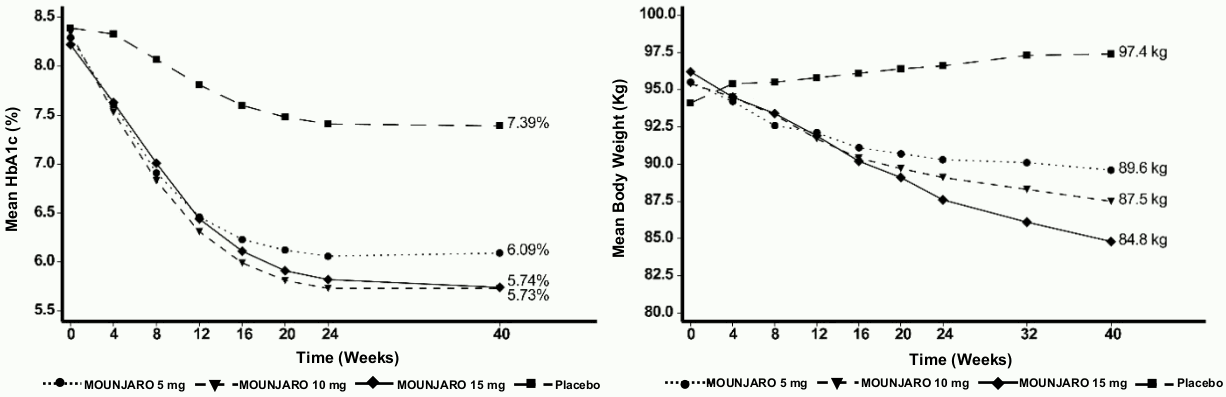
SURPASS-1 – Monotherapy
In a 40 week double blind placebo-controlled study, 478 patients with inadequate glycaemic control with diet and exercise, were randomised to tirzepatide 5 mg, 10 mg or 15 mg once weekly or placebo. Patients had a mean age of 54 years and 52% were men. At baseline the patients had a mean duration of diabetes of 5 years and the mean BMI was 32 kg/m².
Table 2. SURPASS-1: Results at week 40:
| Tirzepatide 5 mg | Tirzepatide 10 mg | Tirzepatide 15 mg | Placebo | ||
|---|---|---|---|---|---|
| mITT population (n) | 121 | 121 | 120 | 113 | |
| HbA1c (%) | Baseline (mean) | 7.97 | 7.88 | 7.88 | 8.08 |
| Change from baseline | -1.87## | -1.89## | -2.07## | +0.04 | |
| Difference from placebo [95% CI] | -1.91** [-2.18, -1.63] | -1.93** [-2.21, -1.65] | -2.11** [-2.39, -1.83] | - | |
| HbA1c (mmol/mol) | Baseline (mean) | 63.6 | 62.6 | 62.6 | 64.8 |
| Change from baseline | -20.4## | -20.7## | -22.7## | +0.4 | |
| Difference from placebo [95% CI] | -20.8** [-23.9, -17.8] | -21.1** [-24.1, -18.0] | -23.1** [-26.2, -20.0] | - | |
| Patients (%) achieving HbA1c | <7% | 86.8** | 91.5** | 87.9** | 19.6 |
| ≤6.5% | 81.8†† | 81.4†† | 86.2†† | 9.8 | |
| <5.7% | 33.9** | 30.5** | 51.7** | 0.9 | |
| FSG (mmol/L) | Baseline (mean) | 8.5 | 8.5 | 8.6 | 8.6 |
| Change from baseline | -2.4## | -2.6## | -2.7## | +0.7# | |
| Difference from placebo [95% CI] | -3.13** [-3.71, -2.56] | -3.26** [-3.84, -2.69] | -3.45** [-4.04, -2.86] | - | |
| FSG (mg/dL) | Baseline (mean) | 153.7 | 152.6 | 154.6 | 155.2 |
| Change from baseline | -43.6## | -45.9## | -49.3## | +12.9# | |
| Difference from placebo [95% CI] | -56.5** [-66.8, -46.1] | -58.8** [-69.2, -48.4] | -62.1** [-72.7, -51.5] | - | |
| Body weight (kg) | Baseline (mean) | 87.0 | 85.7 | 85.9 | 84.4 |
| Change from baseline | -7.0## | -7.8## | -9.5## | -0.7 | |
| Difference from placebo [95% CI] | -6.3** [-7.8, -4.7] | -7.1** [-8.6, -5.5] | -8.8** [-10.3, -7.2] | - | |
| Patients (%) achieving weight loss | ≥5% | 66.9†† | 78.0†† | 76.7†† | 14.3 |
| ≥10% | 30.6†† | 39.8†† | 47.4†† | 0.9 | |
| ≥15% | 13.2† | 17.0† | 26.7† | 0.0 | |
* p<0.05, **p<0.001 for superiority, adjusted for multiplicity.
† p<0.05, ††p<0.001 compared to placebo, not adjusted for multiplicity.
# p<0.05, ##p<0.001 compared to baseline, not adjusted for multiplicity.
Figure 1. Mean HbA1c (%) and mean body weight (kg) from baseline to week 40:
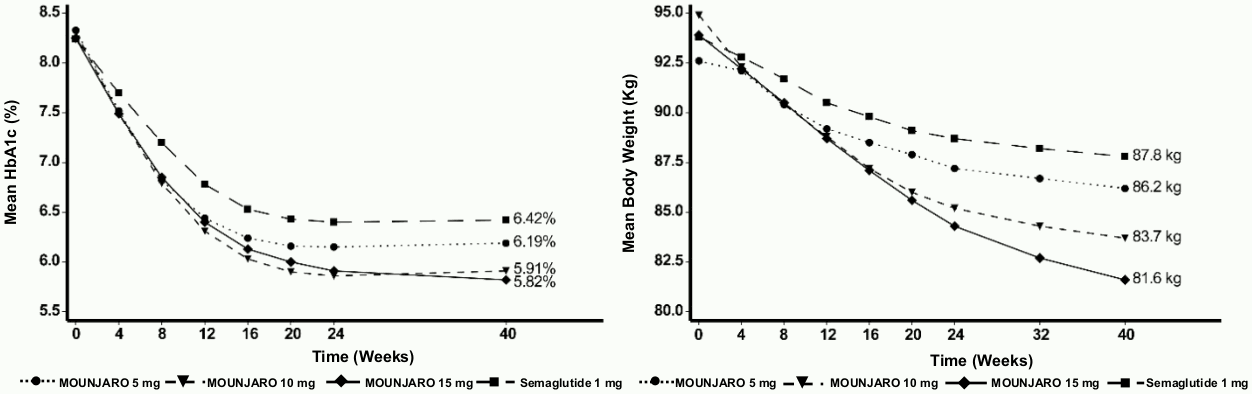
SURPASS-2 - Combination therapy with metformin
In a 40 week active-controlled open-label study, (double-blind with respect to tirzepatide dose assignment) 1 879 patients were randomised to tirzepatide 5 mg, 10 mg or 15 mg once weekly or semaglutide 1 mg once weekly, all in combination with metformin. Patients had a mean age of 57 years and 47% were men. At baseline the patients had a mean duration of diabetes of 9 years and the mean BMI was 34 kg/m².
Table 3. SURPASS-2: Results at week 40:
| Tirzepatide 5 mg | Tirzepatide 10 mg | Tirzepatide 15 mg | Semaglutide 1 mg | ||
|---|---|---|---|---|---|
| mITT population (n) | 470 | 469 | 469 | 468 | |
| HbA1c (%) | Baseline (mean) | 8.33 | 8.31 | 8.25 | 8.24 |
| Change from baseline | -2.09## | -2.37## | -2.46## | -1.86## | |
| Difference from semaglutide [95% CI] | -0.23** [-0.36, -0.10] | -0.51** [-0.64, -0.38] | -0.60** [-0.73, -0.47] | - | |
| HbA1c (mmol/mol) | Baseline (mean) | 67.5 | 67.3 | 66.7 | 66.6 |
| Change from baseline | -22.8## | -25.9## | -26.9## | -20.3## | |
| Difference from semaglutide [95% CI] | -2.5** [-3.9, -1.1] | -5.6** [-7.0, -4.1] | -6.6** [-8.0, -5.1] | N/A | |
| Patients (%) achieving HbA1c | <7% | 85.5* | 88.9** | 92.2** | 81.1 |
| ≤6.5% | 74.0† | 82.1†† | 87.1†† | 66.2 | |
| <5.7% | 29.3†† | 44.7** | 50.9** | 19.7 | |
| FSG (mmol/L) | Baseline (mean) | 9.67 | 9.69 | 9.56 | 9.49 |
| Change from baseline | -3.11## | -3.42## | -3.52## | -2.70## | |
| Difference from semaglutide [95% CI] | -0.41† [-0.65, -0.16] | -0.72†† [-0.97, -0.48] | -0.82†† [-1.06, -0.57] | - | |
| FSG (mg/dL) | Baseline (mean) | 174.2 | 174.6 | 172.3 | 170.9 |
| Change from baseline | -56.0## | -61.6## | -63.4## | -48.6## | |
| Difference from semaglutide [95% CI] | -7.3† [-11.7, -3.0] | -13.0†† [-17.4, -8.6] | -14.7†† [-19.1, -10.3] | - | |
| Body weight (kg) | Baseline (mean) | 92.6 | 94.9 | 93.9 | 93.8 |
| Change from baseline | -7.8## | -10.3## | -12.4## | -6.2## | |
| Difference from semaglutide [95% CI] | -1.7** [-2.6, -0.7] | -4.1** [-5.0, -3.2] | -6.2** [-7.1, -5.3] | - | |
| Patients (%) achieving weight loss | ≥5% | 68.6† | 82.4†† | 86.2†† | 58.4 |
| ≥10% | 35.8†† | 52.9†† | 64.9†† | 25.3 | |
| ≥15% | 15.2† | 27.7†† | 39.9†† | 8.7 | |
* p<0.05, **p<0.001 for superiority, adjusted for multiplicity.
† p<0.05, ††p<0.001 compared to semaglutide 1 mg, not adjusted for multiplicity.
# p<0.05, ##p<0.001 compared to baseline, not adjusted for multiplicity
Figure 2. Mean HbA1c (%) and mean body weight (kg) from baseline to week 40:
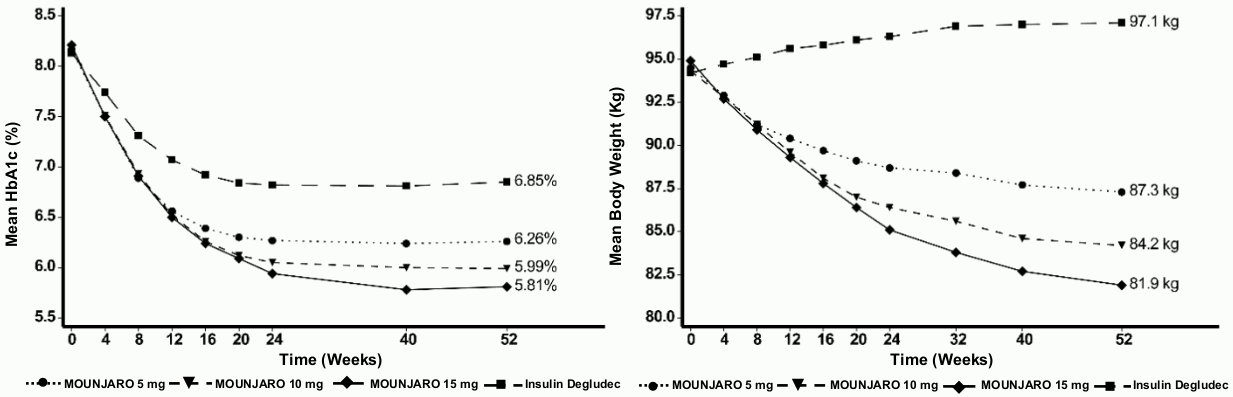
SURPASS-3 - Combination therapy with metformin, with or without SGLT2i
In a 52 week active-controlled open-label study, 1 444 patients were randomised to tirzepatide 5 mg, 10 mg or 15 mg once weekly or insulin degludec, all in combination with metformin with or without a SGLT2i. 32% of patients were using SGLT2i at baseline. At baseline the patients had a mean duration of diabetes of 8 years, a mean BMI of 34 kg/m², a mean age of 57 years and 56% were men.
Patients treated with insulin degludec started at a dose of 10 U/day which was adjusted using an algorithm for a target fasting blood glucose of <5 mmol/L. The mean dose of insulin degludec at week 52 was 49 units/day.
Table 4. SURPASS-3: Results at week 52:
| Tirzepatide 5 mg | Tirzepatide 10 mg | Tirzepatide 15 mg | Titrated insulin degludec | ||
|---|---|---|---|---|---|
| mITT population (n) | 358 | 360 | 358 | 359 | |
| HbA1c (%) | Baseline (mean) | 8.17 | 8.19 | 8.21 | 8.13 |
| Change from baseline | -1.93## | -2.20## | -2.37## | -1.34## | |
| Difference from insulin degludec [95% CI] | -0.59** [-0.73, -0.45] | -0.86** [-1.00, -0.72] | -1.04** [-1.17, -0.90] | - | |
| HbA1c (mmol/mol) | Baseline (mean) | 65.8 | 66.0 | 66.3 | 65.4 |
| Change from baseline | -21.1## | -24.0## | -26.0## | -14.6## | |
| Difference from insulin degludec [95% CI] | -6.4** [-7.9, -4.9] | -9.4** [-10.9, -7.9] | -11.3** [-12.8, -9.8] | - | |
| Patients (%) achieving HbA1c | <7% | 82.4** | 89.7** | 92.6** | 61.3 |
| ≤6.5% | 71.4†† | 80.3†† | 85.3†† | 44.4 | |
| <5.7% | 25.8†† | 38.6†† | 48.4†† | 5.4 | |
| FSG (mmol/L) | Baseline (mean) | 9.54 | 9.48 | 9.35 | 9.24 |
| Change from baseline | -2.68## | -3.04## | -3.29## | -3.09## | |
| Difference from insulin degludec [95% CI] | 0.41† [0.14, 0.69] | 0.05 [-0.24, 0.33] | -0.20 [-0.48, 0.08] | - | |
| FSG (mg/dL) | Baseline (mean) | 171.8 | 170.7 | 168.4 | 166.4 |
| Change from baseline | -48.2## | -54.8## | -59.2## | -55.7## | |
| Difference from insulin degludec [95% CI] | 7.5† [2.4, 12.5] | 0.8 [-4.3, 5.9] | -3.6 [-8.7, 1.5] | - | |
| Body weight (kg) | Baseline (mean) | 94.5 | 94.3 | 94.9 | 94.2 |
| Change from baseline | -7.5## | -10.7## | -12.9## | +2.3## | |
| Difference from insulin degludec [95% CI] | -9.8** [-10.8, -8.8] | -13.0** [-14.0, -11.9] | -15.2** [-16.2, -14.2] | - | |
| Patients (%) achieving weight loss | ≥5% | 66.0†† | 83.7†† | 87.8†† | 6.3 |
| ≥10% | 37.4†† | 55.7†† | 69.4†† | 2.9 | |
| ≥15% | 12.5†† | 28.3†† | 42.5†† | 0.0 | |
* p<0.05, **p<0.001 for superiority, adjusted for multiplicity.
† p<0.05, ††p<0.001 compared to insulin degludec, not adjusted for multiplicity.
# p<0.05, ##p<0.001 compared to baseline, not adjusted for multiplicity
Figure 3. Mean HbA1c (%) and mean body weight (kg) from baseline to week 52:
Continuous glucose monitoring (CGM):
A subset of patients (N=243) participated in an evaluation of the 24 hour glucose profiles captured with blinded CGM. At 52 weeks, patients treated with tirzepatide (10 mg and 15 mg pooled) spent significantly more time with glucose values in the euglycaemic range defined as 71 to 140 mg/dL (3.9 to 7.8 mmol/L) compared to patients treated with insulin degludec, with 73% and 48% of the 24 hour period in range, respectively.
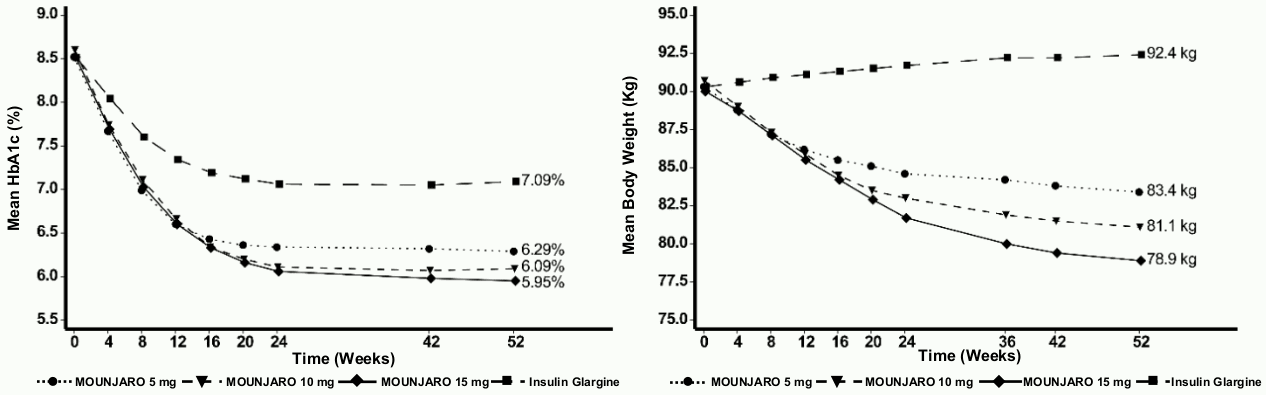
SURPASS-4 – Combination therapy with 1-3 oral antidiabetic medicinal products: metformin, sulphonylureas or SGLT2i
In an active-controlled open-label study of up to 104 weeks (primary endpoint at 52 weeks), 2 002 patients with type 2 diabetes and increased cardiovascular risk were randomised to tirzepatide 5 mg, 10 mg or 15 mg once weekly or insulin glargine once daily on a background of metformin (95%) and/or sulphonylureas (54%) and/or SGLT2i (25%). At baseline the patients had a mean duration of diabetes of 12 years, a mean BMI of 33 kg/m², a mean age of 64 years and 63% were men. Patient treated with insulin glargine started at a dose of 10 U/day which was adjusted using an algorithm with a fasting blood glucose target of <5.6 mmol/L. The mean dose of insulin glargine at week 52 was 44 units/day.
Table 5. SURPASS-4: Results at week 52:
| Tirzepatide 5 mg | Tirzepatide 10 mg | Tirzepatide 15 mg | Titrated insulin glargine | ||
|---|---|---|---|---|---|
| mITT population (n) | 328 | 326 | 337 | 998 | |
| 52 weeks | |||||
| HbA1c (%) | Baseline (mean) | 8.52 | 8.60 | 8.52 | 8.51 |
| Change from baseline | -2.24## | -2.43## | -2.58## | -1.44## | |
| Difference from insulin glargine [95% CI] | -0.80** [-0.92, -0.68] | -0.99** [-1.11, -0.87] | -1.14** [-1.26, -1.02] | - | |
| HbA1c (mmol/mol) | Baseline (mean) | 69.6 | 70.5 | 69.6 | 69.5 |
| Change from baseline | -24.5## | -26.6## | -28.2## | -15.7## | |
| Difference from insulin glargine [95% CI] | -8.8** [-10.1, -7.4] | -10.9** [-12.3, -9.6] | -12.5** [-13.8, -11.2] | - | |
| Patients (%) achieving HbA1c | <7% | 81.0** | 88.2** | 90.7** | 50.7 |
| ≤6.5% | 66.0†† | 76.0†† | 81.1†† | 31.7 | |
| <5.7% | 23.0†† | 32.7†† | 43.1†† | 3.4 | |
| FSG (mmol/L) | Baseline (mean) | 9.57 | 9.75 | 9.67 | 9.37 |
| Change from baseline | -2.80## | -3.06## | -3.29## | -2.84## | |
| Difference from insulin glargine [95% CI] | 0.04 [-0.22, 0.30] | -0.21 [-0.48, 0.05] | -0.44†† [-0.71, -0.18] | - | |
| FSG (mg/dL) | Baseline (mean) | 172.3 | 175.7 | 174.2 | 168.7 |
| Change from baseline | -50.4## | -54.9## | -59.3## | -51.4## | |
| Difference from insulin glargine [95% CI] | 1.0 [-3.7, 5.7] | -3.6 [-8.2, 1.1] | -8.0†† [-12.6, -3.4] | - | |
| Body weight (kg) | Baseline (mean) | 90.3 | 90.7 | 90.0 | 90.3 |
| Change from baseline | -7.1## | -9.5## | -11.7## | +1.9## | |
| Difference from insulin glargine [95% CI] | -9.0** [-9.8, -8.3] | -11.4** [-12.1, -10.6] | -13.5** [-14.3, -12.8] | - | |
| Patients (%) achieving weight loss | ≥5% | 62.9†† | 77.6†† | 85.3†† | 8.0 |
| ≥10% | 35.9†† | 53.0†† | 65.6†† | 1.5 | |
| ≥15% | 13.8†† | 24.0†† | 36.5†† | 0.5 | |
* p<0.05, **p<0.001 for superiority, adjusted for multiplicity.
† p<0.05, ††p<0.001 compared to insulin glargine, not adjusted for multiplicity.
# p<0.05, ##p<0.001 compared to baseline, not adjusted for multiplicity.
Figure 4. Mean HbA1c (%) and mean body weight (kg) from baseline to week 52:
SURPASS-5 - Combination therapy with titrated basal insulin, with or without metformin
In a 40 week double-blind placebo-controlled study, 475 patients with inadequate glycaemic control using insulin glargine with or without metformin were randomised to tirzepatide 5 mg, 10 mg or 15 mg once weekly or placebo. Insulin glargine doses were adjusted utilizing an algorithm with a fasting blood glucose target of <5.6 mmol/L. At baseline the patients had a mean duration of diabetes of 13 years, a mean BMI of 33 kg/m², a mean age of 61 years and 56% were men. The overall estimated median dose of insulin glargine at baseline was 34 units/day. The median dose of insulin glargine at week 40 was 38, 36, 29 and 59 units/day for tirzepatide 5 mg, 10 mg, 15 mg and placebo respectively.
Table 6. SURPASS-5: Results at week 40:
| Tirzepatide 5 mg | Tirzepatide 10 mg | Tirzepatide 15 mg | Placebo | ||
|---|---|---|---|---|---|
| mITT population (n) | 116 | 118 | 118 | 119 | |
| HbA1c (%) | Baseline (mean) | 8.29 | 8.34 | 8.22 | 8.39 |
| Change from baseline | -2.23## | -2.59## | -2.59## | -0.93## | |
| Difference from placebo [95% CI] | -1.30** [-1.52, -1.07] | -1.66** [-1.88, -1.43] | -1.65** [-1.88, -1.43] | - | |
| HbA1c (mmol/mol) | Baseline (mean) | 67.1 | 67.7 | 66.4 | 68.2 |
| Change from baseline | -24.4## | -28.3## | -28.3## | -10.2## | |
| Difference from placebo [95% CI] | -14.2** [-16.6, -11.7] | -18.1** [-20.6, -15.7] | -18.1** [-20.5, -15.6] | - | |
| Patients (%) achieving HbA1c | <7% | 93.0** | 97.4** | 94.0** | 33.9 |
| ≤6.5% | 80.0†† | 94.7†† | 92.3†† | 17.0 | |
| <5.7% | 26.1†† | 47.8†† | 62.4†† | 2.5 | |
| FSG (mmol/L) | Baseline (mean) | 9.00 | 9.04 | 8.91 | 9.13 |
| Change from baseline | -3.41## | -3.77## | -3.76## | -2.16## | |
| Difference from placebo [95% CI] | -1.25** [-1.64, -0.86] | -1.61** [-2.00, -1.22] | -1.60** [-1.99, -1.20] | - | |
| FSG (mg/dL) | Baseline (mean) | 162.2 | 162.9 | 160.4 | 164.4 |
| Change from baseline | -61.4## | -67.9## | -67.7## | -38.9## | |
| Difference from placebo [95% CI] | -22.5** [-29.5, -15.4] | -29.0** [-36.0, -22.0] | -28.8** [-35.9, -21.6] | - | |
| Body weight (kg) | Baseline (mean) | 95.5 | 95.4 | 96.2 | 94.1 |
| Change from baseline | -6.2## | -8.2## | -10.9## | +1.7# | |
| Difference from placebo [95% CI] | -7.8** [-9.4, -6.3] | -9.9** [-11.5, -8.3] | -12.6** [-14.2, -11.0] | - | |
| Patients (%) achieving weight loss | ≥5% | 53.9†† | 64.6†† | 84.6†† | 5.9 |
| ≥10% | 22.6†† | 46.9†† | 51.3†† | 0.9 | |
| ≥15% | 7.0† | 26.6^† | 31.6†† | 0.0 | |
* p<0.05, **p<0.001 for superiority, adjusted for multiplicity.
† p<0.05, ††p<0.001 compared to placebo, not adjusted for multiplicity.
# p<0.05, ##p<0.001 compared to baseline, not adjusted for multiplicity.
Figure 5. Mean HbA1c (%) and mean body weight (kg) from baseline to week 40:
Weight management
The efficacy and safety of tirzepatide for weight management, in combination with a reduced calorie intake and increased physical activity, in patients with obesity (BMI ≥30 kg/m²), or overweight (BMI ≥27 kg/m² to <30 kg/m²) and at least one weight-related comorbidity (such as treated or untreated dyslipidaemia, hypertension, obstructive sleep apnoea, or cardiovascular disease), and with prediabetes or normoglycemia, but without type 2 diabetes mellitus, were evaluated in three randomised double-blinded, placebo-controlled phase 3 studies (SURMOUNT-1, SURMOUNT-3, SURMOUNT-4). A total of 3 900 adult patients (2 518 randomised to tirzepatide) were included in these studies.
Treatment with tirzepatide demonstrated clinically meaningful and sustained weight reduction compared with placebo. Furthermore, a higher percentage of patients achieved ≥5%, ≥10%, ≥15% and ≥20% weight loss with tirzepatide compared with placebo.
The efficacy and safety of tirzepatide for weight management in patients with type 2 diabetes were evaluated in a randomised double-blinded, placebo-controlled phase 3 study (SURMOUNT-2), and in a subpopulation of patients with BMI ≥27 kg/m² in five randomised phase 3 studies (SURPASS-1 to -5). A total of 6 330 patients with BMI ≥27 kg/m² (4 249 randomised to treatment with tirzepatide) were included in these studies. In SURMOUNT-2 treatment with tirzepatide demonstrated clinically meaningful and sustained weight reduction compared with placebo. Furthermore, a higher percentage of patients achieved ≥5%, ≥10%, ≥15% and ≥20% weight loss with tirzepatide compared with placebo. Subgroup analyses of patients with obesity or overweight in the SURPASS studies (amounting to 86% of the overall SURPASS-1 to -5 population) showed sustained weight reduction, and a higher percentage of patients achieving weight reduction targets compared to active comparator/placebo.
In all SURMOUNT studies, the same tirzepatide dose escalation scheme was used as in the SURPASS programme (starting with 2.5 mg for 4 weeks, followed by increases in 2.5 mg increments every 4 weeks until the assigned dose was reached).
SURMOUNT-1
In a 72 week double-blind placebo-controlled study, 2 539 adult patients with obesity (BMI ≥30 kg/m²) or with overweight (BMI ≥27 kg/m² to <30 kg/m²) and at least one weight-related comorbid condition, were randomised to tirzepatide 5 mg, 10 mg or 15 mg once weekly or placebo. All patients were counselled on a reduced-calorie diet and increased physical activity throughout the trial. At baseline, patients had a mean age of 45 years, 67.5% were women and 40.6% of patients had prediabetes. Mean BMI at baseline was 38 kg/m².
Table 7. SURMOUNT-1: Results at week 72:
| Tirzepatide 5 mg | Tirzepatide 10 mg | Tirzepatide 15 mg | Placebo | |
|---|---|---|---|---|
| mITT population (n) | 630 | 636 | 630 | 643 |
| Body weight | ||||
| Baseline (kg) | 102.9 | 105.9 | 105.5 | 104.8 |
| Change (%) from baseline | -16.0†† | -21.4†† | -22.5†† | -2.4 |
| Difference (%) from placebo [95% CI] | -13.5** [-14.6, -12.5] | -18.9** [-20.0, -17.8] | -20.1** [-21.2, -19.0] | - |
| Change (kg) from baseline | -16.1†† | -22.2†† | -23.6†† | -2.4†† |
| Difference (kg) from placebo [95% CI] | -13.8## [-15.0, -12.6] | -19.8## [-21.0, -18.6] | -21.2## [-22.4, -20.0] | - |
| Patients (%) achieving body weight reduction | ||||
| ≥5% | 89.4** | 96.2** | 96.3** | 27.9 |
| ≥10% | 73.4## | 85.9** | 90.1** | 13.5 |
| ≥15% | 50.2## | 73.6** | 78.2** | 6.0 |
| ≥20% | 31.6## | 55.5** | 62.9** | 1.3 |
| Waist circumference (cm) | ||||
| Baseline | 113.2 | 114.9 | 114.4 | 114.0 |
| Change from baseline | -14.6†† | -19.4†† | -19.9†† | -3.4†† |
| Difference from placebo [95% CI] | -11.2## [-12.3, -10.0] | -16.0** [-17.2, -14.9] | -16.5** [-17.7, -15.4] | - |
†† p<0.001 versus baseline.
** p<0.001 versus placebo, adjusted for multiplicity.
## p<0.001 versus placebo, not adjusted for multiplicity.
Figure 6. Mean change in body weight (%) from baseline to week 72:

In SURMOUNT-1, pooled doses of tirzepatide 5 mg, 10 mg, and 15 mg led to a significant improvement compared to placebo in systolic blood pressure (-8.1 mmHg vs. -1.3 mmHg), triglycerides (-27.6% vs. -6.3%), non-HDL-C (-11.3% vs. -1.8%), HDL-C (7.9% vs. 0.3%), and fasting insulin (-46.9% vs. -9.7%).
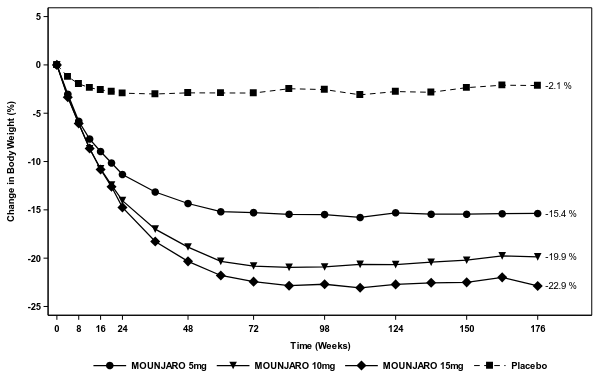
Patients with prediabetes at baseline continued for up to 176 weeks of treatment to evaluate long term effects on body weight and onset of adjudication-confirmed type 2 diabetes mellitus.
Table 8. SURMOUNT-1: Results at week 176 (patients with prediabetes at baseline):
| Tirzepatide 5 mg | Tirzepatide 10 mg | Tirzepatide 15 mg | Placebo | |
| mITT population (n) | 247 | 262 | 253 | 270 |
| Body weight | ||||
| Baseline (kg) | 104.6 | 108.9 | 108.5 | 107.4 |
| Change (%) from baseline | -15.4†† | -19.9†† | -22.9†† | -2.1† |
| Difference (%) from placebo [95% CI] | -13.2## [-15.3, -11.1] | -17.7** [-19.8, -15.7] | -20.7** [-22.8, -18.6] | - |
| Change (kg) from baseline | -15.7†† | -21.4†† | -24.6†† | -2.3† |
| Difference (kg) from placebo [95% CI] | -13.4## [-15.9, -11.0] | -19.1## [-21.5, -16.7] | -22.3## [-24.7, -19.9] | - |
† p<0.05, ††p<0.001 versus baseline.
** p<0.001 versus placebo, adjusted for multiplicity.
## p<0.001 versus placebo, not adjusted for multiplicity.
Figure 7. Mean change in body weight (%) from baseline to week 176 (patients with prediabetes at baseline):
Among the patients in SURMOUNT-1 with prediabetes at baseline (N=1032), 95.3% of patients treated with tirzepatide reverted to normoglycemia at week 72, as compared with 61.9% of patients in the placebo group. At the end of 176 weeks, 94.5% of patients treated with tirzepatide reverted to normoglycemia, as compared with 60.4% of patients in the placebo group, and 1.2% of patients treated with tirzepatide progressed to type 2 diabetes mellitus, as compared with 12.6% of patients in the placebo group.
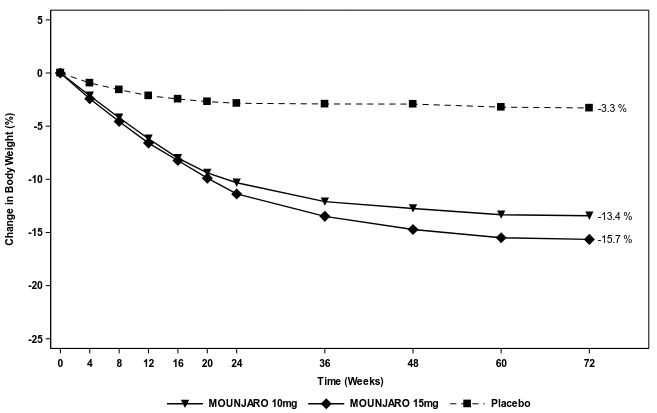
SURMOUNT-2
In a 72 week double-blind placebo-controlled study, 938 adult patients with obesity (BMI ≥30 kg/m²) or with overweight (BMI ≥27 kg/m² to <30 kg/m²) and type 2 diabetes, were randomised to tirzepatide 10 mg or 15 mg once weekly or placebo. Patients included in the trial had HbA1c 7-10% and were treated with either diet and exercise alone, or with one or more oral anti-hyperglycemic agent. All patients were counselled on a reduced calorie diet and increased physical activity throughout the trial. Patients had a mean age of 54 years and 51% were women.Mean BMI at baseline was 36.1 kg/m².
Table 9. SURMOUNT-2: Results at week 72:
| Tirzepatidebr>10 mg | Tirzepatidebr>15 mg | Placebo | |
| mITT population (n) | 312 | 311 | 315 |
| Body weight | |||
| Baseline (kg) | 101.1 | 99.5 | 101.7 |
| Change (%) from baseline | -13.4†† | -15.7†† | -3.3†† |
| Difference (%) from placebo [95% CI] | -10.1** [-11.5, -8.8] | -12.4** [-13.7, -11.0] | - |
| Change (kg) from baseline | -13.5†† | -15.6†† | -3.2 |
| Difference (kg) from placebo [95% CI] | -10.3## [-11.7, -8.8] | -12.4## [-13.8,-11.0] | - |
| Patients (%) achieving body weight reduction | |||
| ≥5% | 81.6** | 86.4** | 30.5 |
| ≥10% | 63.4** | 69.6** | 8.7 |
| ≥15% | 41.4** | 51.8** | 2.6 |
| ≥20% | 23.0** | 34.0** | 1.0 |
| Waist circumference (cm) | |||
| Baseline | 114.3 | 114.6 | 116.1 |
| Change from baseline | -11.2†† | -13.8†† | -3.4†† |
| Difference from placebo [95% CI] | -7.8** [-9.2, -6.4] | -10.4** [-11.8, -8.9] | - |
| HbA1c (mmol/mol) | |||
| Baseline | 64.1 | 64.7 | 63.4 |
| Change from baseline | -23.4†† | -24.3†† | -1.8† |
| Difference from placebo [95% CI] | -21.6** [-23.5, -19.6] | -22.5** [-24.4, -20.6] | - |
| HbA1c (%) | |||
| Baseline | 8.0 | 8.1 | 8.0 |
| Change from baseline | -2.1†† | -2.2†† | -0.2† |
| Difference from placebo [95% CI] | -2.0** [-2.2, -1.8] | -2.1** [-2.2, -1.9] | - |
| Patients (%) achieving HbA1c | |||
| <7% | 90.0** | 90.7** | 29.3 |
| ≤6.5% | 84.1** | 86.7** | 15.5 |
| <5.7% | 50.2** | 55.3** | 2.8 |
| FSG (mmol/L) | |||
| Baseline | 8.8 | 9.0 | 8.7 |
| Change from baseline | -2.7†† | -2.9†† | -0.1 |
| Difference from placebo [95% CI] | -2.6** [-2.9, -2.3] | -2.7** [-3.1, -2.4] | - |
| FSG (mg/dL) | |||
| Baseline | 157.8 | 161.5 | 156.7 |
| Change from baseline | -49.2†† | -51.7†† | -2.4 |
| Difference from placebo [95% CI] | -46.8** [-52.7, -40.9] | -49.3** [-55.2, -43.3] | - |
† p<0.05 versus baseline
†† p<0.001 versus baseline.
** p<0.001 versus placebo, adjusted for multiplicity.
## p<0.001 versus placebo, not adjusted for multiplicity.
Figure 8. Mean change in body weight (%) from baseline to week 72:
In SURMOUNT-2, pooled doses of tirzepatide 10 mg and 15 mg led to a significant improvement compared to placebo in systolic blood pressure (-7.2 mmHg vs. -1.0 mmHg), triglycerides (-28.6% vs. -5.8%), non-HDL-C (-6.6% vs. 2.3 %), and HDL-C (8.2% vs. 1.1%).
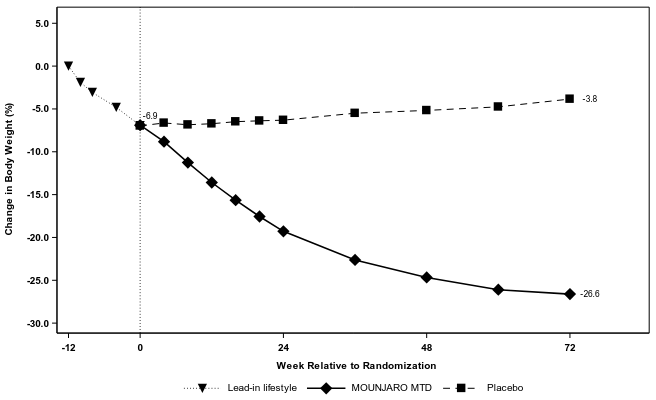
SURMOUNT-3
In an 84 week study, 806 adult patients with obesity (BMI ≥30 kg/m²) or with overweight (BMI ≥27 kg/m² to <30 kg/m²) and at least one weight related comorbid condition, entered a 12 week intensive lifestyle intervention lead-in period consisting of a low calorie diet (1 200-1 500 kcal/day), increased physical activity and frequent behavioural counselling. At the end of the 12 week lead-in period, 579 patients who achieved ≥5.0% weight reduction were randomised to tirzepatide maximum tolerated dose (MTD) of 10 mg or 15 mg once weekly or to placebo, for 72 weeks (double-blind phase). Patients were on a reduced-calorie diet and increased physical activity throughout the double-blind phase of the study. At randomisation patients had a mean age of 46 years and 63% were women. Mean BMI at randomisation was 35.9 kg/m².
Table 10. SURMOUNT-3: Results at week 72:
| Tirzepatide MTD | Placebo | |
| mITT population (n) | 287 | 292 |
| Body weight | ||
| Baseline1 (kg) | 102.3 | 101.3 |
| Change (%) from baseline1 | -21.1†† | 3.3†† |
| Difference (%) from placebo [95% CI] | -24.5** [-26.1, -22.8] | - |
| Change (kg) from baseline1 | -21.5†† | 3.5†† |
| Difference (kg) from placebo [95% CI] | -25.0## [-26.9, -23.2] | - |
| Patients (%) achieving body weight reduction | ||
| ≥5% | 94.4** | 10.7 |
| ≥10% | 88.0** | 4.8 |
| ≥15% | 73.9** | 2.1 |
| ≥20% | 54.9** | 1.0 |
| Patients (%) who maintain ≥80% of the body weight lost during the 12-week lead-in period | 98.6** | 37.8 |
| Waist circumference (cm) | ||
| Baseline1 | 109.2 | 109.6 |
| Change from baseline1 | -16.8†† | 1.1 |
| Difference from placebo [95% CI] | -17.9** [-19.5, -16.3] | - |
1 Randomisation (Week 0)
†† p<0.001 versus baseline 1.
** p<0.001 versus placebo, adjusted for multiplicity.
## p<0.001 versus placebo, not adjusted for multiplicity.
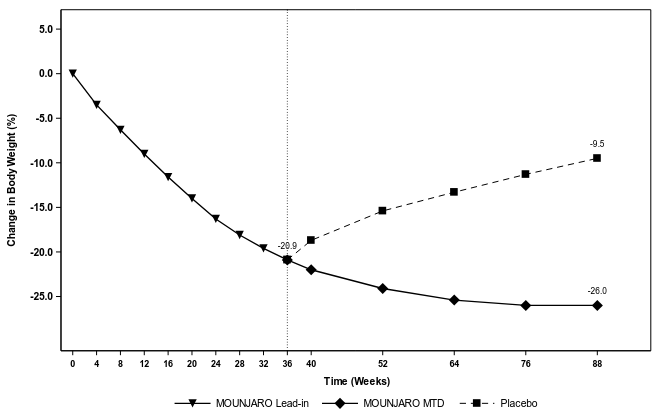
Figure 9. Mean change in body weight (%) from Week -12 to week 72:
SURMOUNT-4
In an 88 week study, 783 adult patients with obesity (BMI ≥30 kg/m²) or with overweight (BMI ≥27 kg/m² to <30 kg/m²) and at least one weight related comorbid condition, were enrolled in a 36 week open label tirzepatide lead-in phase. At the start of lead-in period, the enrolled patients had a mean body weight of 107.0 kg and a mean BMI of 38.3 kg/m². At the end of the lead-in period, 670 patients who achieved tirzepatide MTD of 10 mg or 15 mg dose were randomised to continue treatment with tirzepatide once weekly or to switch to placebo for 52 weeks (double-blind phase). Patients were counselled on a reduced calorie diet and increased physical activity throughout the trial. At randomisation (week 36), patients had a mean age of 49 years and 71% were women. Mean body weight at randomisation was 85.2 kg and mean BMI was 30.5 kg/m².
Patients who continued treatment with tirzepatide for an additional 52 weeks (up to 88 weeks in total) maintained and experienced further weigh loss after the initial weight reduction achieved during the 36 week lead-in phase. The weight reduction was superior and clinically meaningful compared to the placebo group, in which a substantial regain of body weight lost during the lead-in phase was observed (see Table 11 and Figure 10). Nevertheless, the observed mean body weight for placebo-treated patients was lower at week 88 than at the start of the lead-in phase (see Figure 10).
Table 11. SURMOUNT-4: Results at week 88:
| Tirzepatide MTD | Placebo | |
| mITT population (n) only patients at Week 36 | 335 | 335 |
| Body weight | ||
| Weight (kg) at Week 0 (baseline) | 106.7 | 107.8 |
| Weight (kg) at Week 36 (randomisation) | 84.5 | 85.9 |
| Change (%) from Week 36 at Week 88 | -6.7†† | 14.8†† |
| Difference (%) from placebo at Week 88 [95% CI] | -21.4** [-22.9, -20.0] | - |
| Change (kg) from Week 36 at Week 88 | -5.7†† | 11.9†† |
| Difference (kg) from placebo at Week 88 [95% CI] | -17.6## [-18.8, -16.4] | - |
| Patients (%) achieving body weight reduction from Week 0 to Week 88 | ||
| ≥5% | 98.5** | 69.0 |
| ≥10% | 94.0** | 44.4 |
| ≥15% | 87.1** | 24.0 |
| ≥20% | 72.6** | 11.6 |
| Patients (%) who maintain ≥80% of the body weight lost during the 36-week lead-in period at Week 88 | 93.4** | 13.5 |
| Waist circumference (cm) | ||
| Baseline (Week 0) | 114.9 | 115.6 |
| Randomisation (Week 36) | 96.7 | 98.2 |
| Change from randomisation (Week 36) | -4.6†† | 8.3†† |
| Difference from placebo [95% CI] | -12.9** [-14.1, -11.7] | - |
†† p<0.001 versus baseline.
** p<0.001 versus placebo, adjusted for multiplicity.
## p<0.001 versus placebo, not adjusted for multiplicity.
Risk of weight regain to >95% of study baseline (Week 0) weight at week 88:
Time to event analysis showed that continued tirzepatide treatment during the double-blind period reduced the risk of returning to greater than 95% body weight observed at Week 0, for those who had already lost at least 5% since week 0 by approximately 99% compared with placebo (hazard ratio, 0.013 [95% CI, 0.004 to 0.046]; p<0.001).
SURMOUNT-5
In a 72-week study, 751 adult patients with obesity (BMI ≥30 kg/m²) or overweight (BMI ≥27 kg/m² to <30 kg/m²) with at least 1 weight-related comorbid condition were randomised to tirzepatide 15 mg or semaglutide 2.4 mg once weekly. When patients did not tolerate this dose, the dose was reduced to tirzepatide 10 mg or semaglutide 1.7 mg once weekly. Patients were counselled on a reduced calorie diet and increased physical activity throughout the trial. Participants had a mean age of 44.7 years and a mean BMI of 39.4 kg/m². Overall, 64.7% were female.
Treatment with tirzepatide for 72 weeks resulted in a superior and clinically meaningful reduction in body weight compared to semaglutide. The percent change from baseline at week 72 (primary endpoint) was -21.6% for tirzepatide and -15.4% for semaglutide (difference from semaglutide: -6.2%; 95% CI [-7.8, -4.6]; p<0.001). Tirzepatide also achieved superiority compared with semaglutide for the key secondary endpoints, i.e. proportion of patients achieving ≥10%, ≥15%, ≥20 %, and ≥25% body weight reduction at week 72 as well as reduction of waist circumference at week 72.
Effect on body composition
Changes in body composition were evaluated in a sub-study in SURMOUNT-1 using dual energy X-ray absorptiometry (DEXA). The results of the DEXA assessment showed that treatment with tirzepatide was accompanied by greater reduction in fat mass than in lean body mass leading to an improvement in body composition compared to placebo after 72 weeks. Furthermore, this reduction in total fat mass was accompanied by a reduction in visceral fat. These results suggest that most of the total weight loss was attributable to a reduction in fat tissue, including visceral fat.
Improvement in physical functioning
Patients with obesity or overweight without diabetes who received tirzepatide showed small improvements in health-related quality of life, including physical functioning. The improvements were greater in the tirzepatide-treated patients than in those who received placebo. Health-related quality of life was assessed using the generic questionnaire Short Form-36v2 Health Survey Acute, Version (SF-36v2).
Obstructive sleep apnoea
The efficacy and safety of tirzepatide for the treatment of moderate to severe (AHI>15) obstructive sleep apnoea (OSA), in combination with diet and exercise, in patients with obesity were evaluated in two randomized double-blinded, placebo-controlled phase 3 studies (SURMOUNT-OSA Study 1 and Study 2). A total of 469 adult patients with moderate to severe OSA and obesity (234 randomised to treatment with tirzepatide) were included in these studies. Patients with T2DM were excluded. Study 1 enrolled patients unable or unwilling to use Positive Airway Pressure (PAP) therapy. Study 2 enrolled patients on PAP therapy. Study 2 does not allow any conclusion about a potentially added benefit of tirzepatide on top of PAP therapy, since PAP use was suspended 7 days prior to endpoint measurement. All patients were treated with the maximum tolerated dose (MTD; 10 mg or 15 mg) of tirzepatide or placebo, once weekly for 52 weeks.
In both studies, treatment with tirzepatide demonstrated statistically significant and clinically meaningful reduction in the apnoea-hypopnoea index (AHI) compared with placebo (see Table 12). Among tirzepatide treated patients, greater proportion of patients achieved at least 50% AHI reduction compared to placebo.
SURMOUNT-OSA, Study 1 and Study 2
In two 52 week double-blind placebo-controlled studies, 469 adult patients with moderate to severe OSA and obesity, were randomised to tirzepatide MTD of 10 mg or 15 mg once weekly, or to placebo, once weekly. In Study 1 patients had a mean age of 48 years, 33% were female, 35% had moderate OSA, 63% had severe OSA, 65% had pre-diabetes, 76% had hypertension, 10% had cardiac disorders, and 81% had dyslipidemia. Patients had a mean Epworth Sleepiness Scale (ESS) of 10.5. In Study 2 patients had a mean age of 52 years, 28% were female, 31% had moderate OSA, 68% had severe OSA, 57% had pre-diabetes, 77% had hypertension, 11% had cardiac disorders, and 84% had dyslipidemia. Patients had a mean ESS of 10.0.
Table 12. SURMOUNT-OSA, Study 1 and Study 2: Results at week 52:
| OSA Study 1 | OSA Study 2 | |||
| Tirzepatide MTD | Placebo | Tirzepatide MTD | Placebo | |
| mITT population (n) | 114 | 120 | 119 | 114 |
| AHI (events/hr) | ||||
| Baseline mean | 54.3 | 50.9 | 45.8 | 53.1 |
| Change from baseline | -27.4†† | -4.8† | -30.4†† | -6.0† |
| Difference from placebo [95% CI] | -22.5** [-28.7, -16.4] | - | -24.4** [-30.3, -18.6] | - |
| % Change in AHI | ||||
| % Change from baseline | -55.0†† | -5.0 | -62.8†† | -6.4 |
| % Difference from placebo [95% CI] | -49.9** [-62.8, -37.0] | - | -56.4** [-70.7, -42.2] | - |
| Patients (%) achieving reduction in AHI | ||||
| ≥50% | 62.3 | 19.2 | 74.3 | 22.9 |
| % Difference from placebo [95% CI] | 43.6** [31.1, 56.2] | - | 50.8** [38.6, 62.9] | - |
| Sleep apnoea-specific hypoxic burden (% min/h)a | ||||
| Baseline geometric mean | 156.6 | 148.2 | 129.9 | 139.1 |
| Change from baseline | -103.1†† | -21.1 | -103.0†† | -40.7† |
| Difference from placebo [95% CI] | -82.0** [-107.0, -57.1] | - | -62.4** [-87.1, -37.6] | - |
| Body weight (kg) | ||||
| Baseline mean | 117.0 | 112.7 | 115.8 | 115.0 |
| % Change from baseline | -18.1†† | -1.3 | -20.1†† | -2.3† |
| % Difference from placebo [95% CI] | -16.8** [-18.8, -14.7] | - | -17.8** [-19.9, -15.7] | - |
| Systolic Blood Pressure (mmHg)b | ||||
| Baseline mean | 128.2 | 130.3 | 130.7 | 130.5 |
| Change from baseline | -9.6†† | -1.7 | -7.6†† | -3.3† |
| Difference from placebo [95% CI] | -7.9** [-11.0, -4.9] | - | -4.3* [-7.3, -1.2] | - |
| hsCRP (mg/L)a | ||||
| Baseline geometric mean | 3.6 | 3.8 | 3.0 | 2.7 |
| Change from baseline | -1.6†† | -0.8† | -1.4†† | -0.3 |
| Difference from placebo [95% CI] | -0.8* [-1.4, -0.3] | - | -1.1** [-1.7, -0.5] | - |
† p<0.05, ††p<0.001 versus baseline.
* p<0.05, **p<0.001 versus placebo, adjusted for multiplicity.
a Analysed using log transformed data.
b Blood pressure was assessed at Week 48 because PAP withdrawal at Week 52 may confound blood pressure assessment.
Cardiovascular evaluation
Cardiovascular (CV) risk was assessed via a meta-analysis of patients with at least one adjudication confirmed major adverse cardiovascular event (MACE). The composite endpoint of MACE-4 included CV death, non-fatal myocardial infarction, non-fatal stroke, or hospitalisation for unstable angina.
In a primary meta-analysis of phase 2 and 3 registration studies in patients with type 2 diabetes, a total of 116 patients (tirzepatide: 60 [n=4 410]; all comparators: 56 [n=2 169]) experienced at least one adjudication confirmed MACE-4: The results showed that tirzepatide was not associated with excess risk for CV events compared with pooled comparators (HR: 0.81; CI: 0.52 to 1.26).
An additional analysis was conducted specifically for the SURPASS-4 study that enrolled patients with established CV disease. A total of 109 patients (tirzepatide: 47 [n=995]; insulin glargine: 62 [n=1 000]) experienced at least one adjudication confirmed MACE-4: The results showed that tirzepatide was not associated with excess risk for CV events compared with insulin glargine (HR: 0.74; CI: 0.51 to 1.08).
In 3 placebo-controlled weight management phase 3 studies (SURMOUNT 1-3), a total of 27 participants experienced at least one adjudication confirmed MACE (TZP: 17 (n=2 806); placebo: 10 (n=1 250)); the event rate was similar across placebo and tirzepatide.
Blood pressure
In the placebo-controlled phase 3 studies in patients with T2DM, treatment with tirzepatide resulted in a mean decrease in systolic and diastolic blood pressure of 6 to 9 mmHg and 3 to 4 mmHg, respectively. There was a mean decrease in systolic and diastolic blood pressure of 2 mmHg each in placebo treated patients.
In 3 placebo-controlled weight management phase 3 studies (SURMOUNT 1-3), treatment with tirzepatide resulted in a mean decrease in systolic and diastolic blood pressure of 7 mmHg and 4 mmHg, respectively. There was a mean decrease in systolic and diastolic blood pressure of <1 mmHg each in placebo treated patients.
In two placebo-controlled OSA phase 3 studies with pooled safety analysis, treatment with tirzepatide resulted in a mean decrease in systolic and diastolic blood pressure of 9.0 mmHg and 3.8 mmHg, respectively, at Week 52. There was a mean decrease in systolic and diastolic blood pressure of 2.5 mmHg and 1.0 mmHg, respectively, in placebo treated patients at Week 52.
Other information
Fasting serum glucose
Across SURPASS-1 to -5 trials, treatment with tirzepatide resulted in significant reductions from baseline in FSG (changes from baseline to primary end point were -2.4 mmol/L to -3.8 mmol/L). Significant reductions from baseline in FSG could be observed as early as 2 weeks. Further improvement in FSG was seen through to 42 weeks then was sustained through the longest study duration of 104 weeks.
Postprandial glucose
Across SURPASS-1 to -5 trials, treatment with tirzepatide resulted in significant reductions in mean 2 hour post prandial glucose (mean of 3 main meals of the day) from baseline (changes from baseline to primary end point were -3.35 mmol/L to -4.85 mmol/L).
Triglycerides
Across SURPASS-1 to -5 trials, tirzepatide 5 mg, 10 mg and 15 mg resulted in reduction in serum triglyceride of 15-19%, 18-27% and 21-25% respectively.
In the 40 week trial versus semaglutide 1 mg, tirzepatide 5 mg, 10 mg and 15 mg resulted in 19%, 24% and 25% reduction in serum triglycerides levels respectively compared to 12% reduction with semaglutide 1 mg.
In the 72 week placebo-controlled phase 3 study in patients with obesity or overweight without T2DM (SURMOUNT-1), treatment with tirzepatide 5 mg, 10 mg, and 15 mg resulted in 24%, 27% and 31% reduction in serum triglyceride levels respectively compared to 6% reduction with placebo.
In the 72 week placebo-controlled phase 3 study in patients with obesity or overweight with T2DM (SURMOUNT-2), treatment with tirzepatide 10 mg and 15 mg resulted in 27% and 31% reduction in serum triglyceride levels respectively compared to 6% reduction with placebo.
Proportion of patients reaching HbA1c <5.7% without clinically significant hypoglycaemia
In the 4 studies where tirzepatide was not combined with basal insulin (SURPASS-1 to -4), 93.6% to 100% of patients who achieved a normal glycaemia of HbA1c <5.7% (≤39 mmol/mol), at the primary endpoint visit with tirzepatide treatment did so without clinically significant hypoglycaemia. In Study SURPASS-5, 85.9% of patients treated with tirzepatide who reached HbA1c <5.7% (≤39 mmol/mol) did so without clinically significant hypoglycaemia.
Special populations
The efficacy of tirzepatide for the treatment of T2DM was not impacted by age, gender, race, ethnicity, region, or by baseline BMI, HbA1c, diabetes duration and level of renal function impairment.
The efficacy of tirzepatide for weight management was not impacted by age, gender, race, ethnicity, region, baseline BMI, and presence or absence of prediabetes.
The efficacy of tirzepatide for the treatment of moderate to severe OSA in patients with obesity was not impacted by age, sex, ethnicity, baseline BMI, or baseline OSA severity.
Paediatric population
The European Medicines Agency has deferred the obligation to submit the results of studies with Mounjaro in one or more subsets of the paediatric population for the treatment of type 2 diabetes mellitus and for weight management (see section 4.2 for information on paediatric use).
5.2. Pharmacokinetic properties
Tirzepatide consists of 39-amino acids and has a C20 fatty diacid moiety attached, which enables albumin binding and prolongs half-life.
Absorption
Maximum concentration of tirzepatide is reached 8 to 72 hours post dose. Steady state exposure is achieved following 4 weeks of once weekly administration. Tirzepatide exposure increases in a dose proportional manner.
Similar exposure was achieved with subcutaneous administration of tirzepatide in the abdomen, thigh, or upper arm.
Absolute bioavailability of subcutaneous tirzepatide was 80%.
Distribution
The mean apparent steady-state volume of distribution of tirzepatide following subcutaneous administration in patients with type 2 diabetes is approximately 10.3 L, and 9.7 L in patients with obesity.
Tirzepatide is highly bound to plasma albumin (99%).
Biotransformation
Tirzepatide is metabolised by proteolytic cleavage of the peptide backbone, beta-oxidation of the C20 fatty diacid moiety and amide hydrolysis.
Elimination
The apparent population mean clearance of tirzepatide is approximately 0.06 L/h with an elimination half-life of approximately 5 days, enabling once weekly administration.
Tirzepatide is eliminated by metabolism. The primary excretion routes of tirzepatide metabolites are via urine and faeces. Intact tirzepatide is not observed in urine or faeces.
Special populations
Age, gender, race, ethnicity, body weight
Age, gender, race, ethnicity, or body weight do not have a clinically relevant effect on the pharmacokinetics (PK) of tirzepatide. Based on a population PK analysis, the exposure of tirzepatide increases with decreasing body weight; however, the effect of body weight on the PK of tirzepatide does not appear to be clinically relevant.
Renal impairment
Renal impairment does not impact the PK of tirzepatide. The PK of tirzepatide after a single 5 mg dose was evaluated in patients with different degrees of renal impairment (mild, moderate, severe, ESRD) compared with subjects with normal renal function and no clinically relevant differences were observed. This was also shown for patients with both type 2 diabetes mellitus and renal impairment based on data from clinical studies.
Hepatic impairment
Hepatic impairment does not impact the PK of tirzepatide. The PK of tirzepatide after a single 5 mg dose was evaluated in patients with different degrees of hepatic impairment (mild, moderate, severe) compared with subjects with normal hepatic function and no clinically relevant differences were observed.
Paediatric population
Tirzepatide has not been studied in paediatric patients.
5.3. Preclinical safety data
Non-clinical data reveal no special hazards for humans based on conventional studies of safety pharmacology or repeat-dose toxicity or genotoxicity.
A 2-year carcinogenicity study was conducted with tirzepatide in male and female rats at doses of 0.15, 0.50, and 1.5 mg/kg (0.12, 0.36, and 1.02-fold the maximum recommended human dose (MRHD) based on AUC) administered by subcutaneous injection twice weekly. Tirzepatide caused an increase in thyroid C-cell tumours (adenomas and carcinomas) at all doses compared to controls. The human relevance of these findings is unknown.
In a 6-month carcinogenicity study in rasH2 transgenic mice, tirzepatide at doses of 1, 3, and 10 mg/kg administered by subcutaneous injection twice weekly did not produce increased incidences of thyroid C-cell hyperplasia or neoplasia at any dose.
Animal studies with tirzepatide did not indicate direct harmful effects with respect to fertility.
In animal reproduction studies, tirzepatide caused foetal growth reductions and foetal abnormalities at exposures below the MRHD based on AUC. An increased incidence of external, visceral, and skeletal malformations and visceral and skeletal developmental variations were observed in rats. Foetal growth reductions were observed in rats and rabbits. All developmental effects occurred at maternally toxic doses.
© All content on this website, including data entry, data processing, decision support tools, "RxReasoner" logo and graphics, is the intellectual property of RxReasoner and is protected by copyright laws. Unauthorized reproduction or distribution of any part of this content without explicit written permission from RxReasoner is strictly prohibited. Any third-party content used on this site is acknowledged and utilized under fair use principles.