PALSONIFY Film-coated tablet Ref.[116552] Active ingredients: Paltusotine
Source: European Medicines Agency (EU) Revision Year: 2026 Publisher: Crinetics Pharmaceuticals Europe GmbH, Barbara Strozzilaan 201, 1083HN Amsterdam, Netherlands
5.1. Pharmacodynamic properties
Pharmacotherapeutic group: Pituitary and hypothalamic hormones and analogues
ATC code: H01CB06
Mechanism of action
Similar to the natural hormone somatostatin (SST), paltusotine demonstrates potent suppression of GH and IGF-1 secretion. Paltusotine exerts its pharmacological activity via highly selective binding (>4 000-fold) to somatostatin receptor 2 (SST2) and exhibits little or no affinity for other SST receptor subtypes. Paltusotine inhibits cyclic adenosine monophosphate (cAMP) accumulation via human SST2 activation with an average drug (agonist) concentration that results in half-maximal response (EC50) of 0.25 nM.
Pharmacodynamic effects
Paltusotine substantially reduces, and in many cases, normalises IGF-1 and GH levels in patients with acromegaly.
Cardiac electrophysiology
At 4.6 times the exposure of the paltusotine 60 mg therapeutic dose, clinically significant QTc interval prolongation was not observed.
Clinical efficacy and safety
The efficacy and safety of paltusotine for the medical treatment of adults with acromegaly was established in two phase 3 randomised, double-blind, parallel group, placebo-controlled clinical studies (PATHFNDR-2 and PATHFNDR-1).
Study PATHFNDR-2
This 24-week study (PATHFNDR-2) enrolled 111 adult patients with acromegaly who were not receiving medical treatment and were biochemically uncontrolled at randomisation. Patients were either not previously medically treated or had no treatment within the previous 4 months prior to screening (not medically treated) or were receiving, and washed out of, somatostatin receptor ligand monotherapy with octreotide or lanreotide during screening (washout). IGF-1 levels were required to be ≥1.3×ULN for those not medically treated and ≥1.1×ULN with at least a 30% rise in IGF-1 during the screening period for the washout patients. Patients were randomised to receive either paltusotine (N=54) or placebo (N=57) for the 24-week treatment period. The starting dose was 20 mg/day during 2 weeks and the dose could be increased to 40 mg/day at the week 2 visit after confirming tolerability. At week 6, the dose could be increased to 60 mg once daily, if the 40 mg dose was acceptably tolerated and based on biochemical control and the week 4 IGF-1 was >0.9×ULN. Dose down-titration was allowed at any time during the randomised control phase of the study if the dose was not tolerated. After week 12, the dose was maintained until the end of the randomised controlled period of the study (week 24).
Fifty-three per cent (53%) of patients were female; 52% were White, 31% Asian, 3% Black or African American, 9% Other and 5% Unknown race. The mean age at time of enrolment was 47 years (9% were ≥65 years). The mean duration since diagnosis of acromegaly was 87 months with 89% of patients receiving pituitary surgery within a mean duration of 75 months prior to study participation. The overall baseline mean IGF-1 was 2.3×ULN in the not medically treated patients and 1.5×ULN in the washout patients.
The primary endpoint was met, with 55.6% of paltusotine patients achieving biochemical control (IGF-1 level ≤1.0×ULN) at week 24 compared to 5.3% of placebo-treated patients (p-value <0.0001).
In addition to achieving the primary endpoint, paltusotine produced statistically significant (p-value <0.0001) reductions of IGF-1 to normal levels in both not medically treated (42.5%) and washout (92.9%) patients compared to placebo-treated patients regardless of prior treatment history (Table 2).
An analysis of change from baseline in IGF-1 to week 24 showed that, while baseline mean IGF- 1×ULN levels was consistent between the paltusotine and placebo groups (2.0 and 2.2, respectively), paltusotine resulted in a statistically significant difference (p-value <0.0001) compared to placebo-treated patients among all patients as well as in both the not medically treated and washout groups (Table 2).
Table 2. Study PATHFNDR-2 overall efficacy results based on IGF-1 levels:
| IGF-1 normalisation | paltusotine (N=54) | placebo (N=57) | p-value |
| Proportion of patients who achieved IGF-1 level ≤1.0×ULN at week 24, n (%) | 30 (55.6%) | 3 (5.3%) | <0.0001 |
| Not medically treated or previously treated, n/N (%) | 17/40 (42.5%) | 1/42 (2%) | <0.0001 |
| Medically naïve, n/N (%) | 5/22 (22.7%) | 1/24 (4.2%) | 0.1509 |
| Previously treated, n/N (%) | 12/18 (66.7%) | 0/18 (0) | <0.0001 |
| Washout, n/N (%) | 13/14 (92.9%) | 2/15 (13.3%) | <0.0001 |
| Change from baseline in IGF-1 | paltusotine (N=54) | placebo (N=57) | p-value |
| Change from baseline in IGF-1 at week 24 (xULN), LS mean (SE) | -0.819 (0.0789) | 0.087 (0.0751) | <0.0001 |
| Not medically treated or previously treated, LS mean (SE) | -0.887 (0.0903) | 0.070 (0.0881) | <0.0001 |
| Medically naïve, LS mean (SE) | -0.829 (0.1357) | 0.046 (0.1299) | <0.0001 |
Previously treated, LS mean
(SE) |<> -0.964 (0.1151) |<>0.108 (0.1151) |<> <0.0001 |
|Washout, LS mean (SE) |<> -0.600 (0.1044) |<>0.152 (0.1008) |<> <0.0001|
IGF-1 at week 24 is based on the average of the last 2 measurements of IGF-1 collected at weeks 22 and 24. When one of the two last IGF-1 measurements was missing a single value was used. Week 24 is the end of the randomised controlled portion of the study; if a patient received rescue therapy, the last assessment prior to rescue is used.
IGF-1=insulin-like growth factor-1, LS=least squares, SE=standard error, ULN=upper limit of normal.
Treatment with paltusotine resulted in an approximately 37% reduction in IGF-1 by 4 weeks following initiation of treatment and was sustained through the end of the treatment period (Figure 1).
Figure 1. Study PATHFNDR-2 LS mean (±SE) IGF-1 (×ULN) change from baseline by visit for all patients:
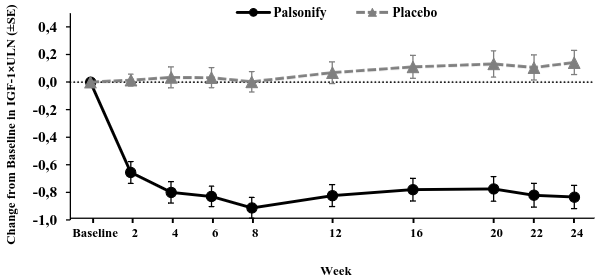
The population includes all randomised patients based on multiple imputation methods.
IGF-1=insulin-like growth factor-1, LS=least squares, SE=standard error, ULN=upper limit of normal.
An analysis of time to response from randomisation demonstrated 59% of paltusotine-treated patients achieved IGF-1 normalisation compared to 9% in the placebo-treated group during the study. The majority of IGF-1 normalisation events occurred during the first 4 weeks of treatment. These results are consistent with the primary endpoint analysis which demonstrated continued response in a majority of paltusotine-treated patients through the end of week 24.
Table 3. Study PATHFNDR-2 proportion of patients with IGF-1 <1.3×ULN:
| IGF-1 <1.3×ULN | paltusotine (N=54) | placebo (N=57) | p-value |
| Proportion of patients who achieved IGF-1 level <1.3×ULN at week 24, n (%) | 36 (66.7%) | 8 (14%) | <0.0001 |
| Not medically treated or previously treated, n/N (%) | 22/40 (55%) | 4/42 (9.5%) | <0.0001 |
| Medically naïve, n/N (%) | 8/22 (36.4%) | 2/24 (8.3%) | 0.0495 |
| Previously treated, n/N (%) | 14/18 (77.8%) | 2/18 (11.1%) | 0.0001 |
| Washout, n/N (%) | 14/14 (100%) | 4/15 (26.7%) | <0.0001 |
IGF-1 at week 24 is based on the average of the last 2 measurements of IGF-1 collected at weeks 22 and 24. When one of the two last IGF-1 measurements was missing a single value was used. Week 24 is the end of the randomised controlled portion of the study; if a patient received rescue therapy, the last assessment prior to rescue is used.
IGF-1=insulin-like growth factor-1, ULN=upper limit of normal.
Consistent with the paltusotine mechanism of action, target GH levels of <1.0 ng/mL were achieved in 57% in the paltusotine-treated patients compared with 17.5% in the placebo-treated patients (p-value <0.0001) at week 24 (Table 4).
Table 4. Study PATHFNDR-2 proportion of patients with GH <1.0×ULN:
| GH <1.0×ULN | paltusotine (N=54) | placebo (N=57) | p-value |
| Proportion of patients who achieved GH <1.0×ULN at week 22, n (%) | 31 (57.4%) | 10 (17.5%) | <0.0001 |
| Not medically treated or previously treated, n/N (%) | 21/40 (52.5%) | 3/42 (7.1%) | <0.0001 |
| Medically naïve, n/N (%) | 8/22 (36.4%) | 1/24 (4.2%) | 0.0148 |
| Previously treated, n/N (%) | 13/18 (72.2%) | 2/18 (11.1%) | 0.0005 |
| Washout, n/N (%) | 10/14 (71.4%) | 7/15 (46.7%) | 0.3297 |
GH=growth hormone, ULN=upper limit of normal.
Study PATHFNDR-2 measured clinical symptom severity for 7 items associated with acromegaly (headache pain, joint pain, sweating, fatigue, weakness in legs, swelling, and numbness or tingling) using the acromegaly symptoms diary (ASD), with each item score ranging from 0 (no symptoms) to 10 (worst symptoms). A preliminary threshold range to characterise meaningful within patient change for the ASD total is a -4 to -6 point change for improvement or worsening out of a total score of 70. At baseline, patients presented with mild to moderate symptoms. The change from baseline to week 24 in total ASD score shows a statistically significant improvement of -2.669 for the paltusotine-treated patients compared to a worsening of 2.754 for placebo-treated patients (p-value=0.0039). In not medically treated or previously treated patients who received paltusotine, the ASD score showed an improvement of -4.187 compared to a worsening of 0.163 in placebo-treated patients. In washout patients, those receiving paltusotine exhibited an improvement of -1.610 compared to worsening of 5.777 in those receiving placebo (Table 5).
Table 5. Change from baseline to week 24 in total ASD score in study PATHFNDR-2:
| paltusotine (N=54) | placebo (N=57) | Treatment difference (95% CI) | p-value | |
| Change from baseline in total ASD score to week 24 | ||||
| LS mean (SE) | -2.669 (±1.422) | 2.754 (±1.364) | -5.423 (-9.070, -1.776) | 0.0039 |
| Not medically treated or previously treated | -4.187 (±1.605) | 0.163 (±1.565) | -4.349 (-8.831, 0.132) | 0.0570 |
| Medically naïve | -3.189 (±1.976) | 2.669 (± 1.848) | -5.868 (-11.336, -0.380) | 0.0367 |
| Previously treated | -5.344 (±2.547) | -3.381 (±2.621) | -1.963 (-9.44, 5.518) | 0.5967 |
| Washout | -1.610 (±2.209) | 5.777 (±2.054) | -7.387 (-13.638, -1.137) | 0.0224 |
Week 24 is the end of the randomised controlled portion of the study; if a patient received rescue therapy, the last assessment prior to rescue is used. Baseline total ASD is the sum of the weekly average on or prior to day 1, and post-baseline total ASD is the sum of the weekly average on or prior to the scheduled visit date, inclusive of the date of visit, for 7 items (headache, joint pain, sweating, fatigue, weakness in legs, swelling, and numbness or tingling).At baseline, mean total ASD score was 17.48 in the paltusotine group, and 15.54 in the placebo group.
ASD=Acromegaly symptoms diary, CI=confidence interval, LS=least squares, SE=standard error.
Results by ASD individual item score change from baseline to week 24 for all patients showed for all 7 items a trend in favour of paltusotine, 5 of which were statistically significant (headache pain, sweating, fatigue, weakness in legs, swelling; p<0.05).
The LS means (±SE) change from baseline to end of treatment in most bothersome symptoms were -0.553 (±0.4219) in the paltusotine group and 0.357 (±0.3770) in the placebo group, with a treatment difference of -0.910 (95% CI: -1.976, 0.157) in favour of paltusotine (nominal p=0.0935).
The observed safety and tolerability profile remained unchanged (see section 4.8) and the durability of the clinical treatment benefits were retained in patients dosed for 120 weeks in the ongoing OLE study PATHFNDR-2.
Study PATHFNDR-1
This 36-week study (PATHFNDR-1) enrolled 58 patients who were biochemically controlled on injectable depot octreotide or lanreotide somatostatin receptor ligand therapy. All patients were required to be biochemically controlled (defined as IGF-1 levels ≤1.0×ULN) during screening and at randomisation. Patients were randomised to receive either paltusotine (N=30) or placebo (N=28) for the 36-week treatment period. The dose could be titrated from 40 mg to a maximum of 60 mg based on IGF-1 value or decreased based on tolerability. After week 24, the paltusotine dose was maintained until the end of the randomised controlled period (week 36).
Fifty-five per cent (55%) of patients were female, 72% were White, 3% Asian, 5% Black or African American, 12% Other, 7% Unknown race. The mean age at time of enrolment was 55 years (28% were ≥65 years). The mean duration since diagnosis of acromegaly was 155 months with 86% of patients receiving pituitary surgery within a mean duration of 138 months prior to study participation. The baseline mean IGF-1 was 0.83×ULN with a baseline mean GH level of 0.90 ng/mL. Of enrolled patients, 59% were previously treated with octreotide and 41% previously treated with lanreotide. The majority of patients enrolled were on the mid or high doses of approved somatostatin receptor ligand therapy prior to screening.
The primary endpoint was met, with 83.3% of paltusotine-treated patients maintained biochemical control (IGF-1 level ≤1.0×ULN) at week 36 compared to 3.6% of placebo-treated patients (Table 6).
Table 6. Study PATHFNDR-1 overall efficacy results based on IGF-1 level:
| IGF-1 normalisation | paltusotine (N=30) | placebo (N=28) | p-value |
| Proportion of patients who maintained response in IGF-1 at week 36 (≤1.0×ULN), n (%) | 25 (83.3%) | 1 (3.6%) | <0.0001 |
| Change from baseline in IGF-1 | paltusotine (N=30) | placebo (N=28) | p-value |
| Change from baseline in IGF-1 at week 36 (×ULN) LS mean (SE) | 0.042 (±0.093) | 0.833 (±0.096) | <0.0001 |
Week 36 is the end of the randomised controlled portion of the study; if a patient received rescue therapy, the last assessment prior to rescue is used.
IGF-1=insulin-like growth factor 1, LS=least squares, SE=standard error, ULN=upper limit of normal.
Paltusotine demonstrated stable IGF-1 levels in patients who switched from prior somatostatin receptor ligand therapy, which was sustained through the end of the 36-week treatment period (IGF-1×ULN: 0.04±0.093). In contrast, patients randomised to placebo showed a rise in IGF levels (IGF-1×ULN: 0.83±0.096) at week 36 and the difference between groups at the end of the treatment period was statistically significant (p-value <0.0001) (Figure 2).
Figure 2. Study PATHFNDR-1 LS mean (±SE) IGF-1 (×ULN) change from baseline by visit for all patients:
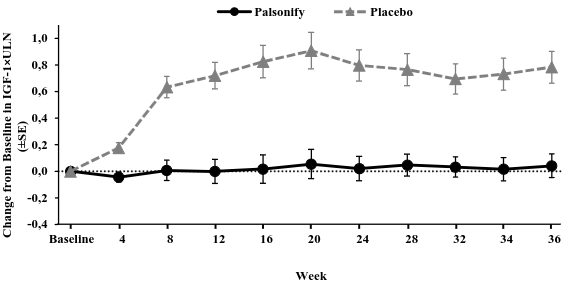
The population includes all randomised patients based on multiple imputation methods.
IGF-1=insulin-like growth factor-1, LS=least squares, SE=standard error, ULN=upper limit of normal.
Target GH levels of <1.0 ng/mL were maintained in 87% of patients controlled at baseline in the paltusotine treated patients compared with 28% in the placebo-treated patients (p-value <0.0003) at week 34.
Study PATHFNDR-1 measured acromegaly clinical symptom severity in 7 items (headache pain, joint pain, sweating, fatigue, weakness in legs, swelling, and numbness or tingling) using the ASD. A preliminary threshold range to characterise meaningful within patient change for the ASD total is a -4 to -6 point change for improvement or worsening out of a total score of 70. At baseline, patients presented with mild to moderate symptoms. The change from baseline to week 36 in total ASD score showed an improvement of -0.606 for the paltusotine-treated patients compared to a worsening of 4.558 for the placebo-treated patients (p-value=0.0216) (Table 7).
Table 7. Change from baseline to week 36 in total ASD score in study PATHFNDR-1:
| paltusotine (N=30) | placebo (N=28) | Treatment difference (95% CI) | p-value | |
| Change from baseline to week 36 in ASD total score | ||||
| LS Mean (SE) | -0.606 (±1.504) | 4.558 (±1.593) | -5.164 (-9.536, -0.792) | 0.0216 |
Week 36 is the end of the randomised controlled portion of the study; if a patient received rescue therapy, the last assessment prior to rescue is used. Baseline total ASD is the sum of the weekly average on or prior to day 1, and post-baseline total ASD is the sum of the weekly average on or prior to the scheduled visit date, inclusive of the date of visit, for 7 items (headache, joint pain, sweating, fatigue, weakness in legs, swelling, and numbness or tingling).At baseline, mean total ASD score was 13.21 in the paltusotine group, and 10.86 in the placebo group.
ASD=Acromegaly symptoms diary, CI=confidence interval, LS=least squares, SE=standard error.
Results by ASD individual item score change from baseline to week 36 showed for all 7 items a trend in favour of paltusotine, 2 of which were statistically significant (joint pain and numbness or tingling; p-value <0.05). No single ASD item predominantly affected the overall total ASD score, indicating there was improvement and stabilisation across acromegaly symptoms evaluated in the paltusotine treated patients compared with the placebo-treated patients.
The LS means (±SE) change from baseline to end of treatment in most bothersome symptoms were -0.530 (±0.360) in the paltusotine group and 0.617 (±0.381) in the placebo group, with a treatment difference of -1.147 (95% CI: -2.199, -0.094) in favour of paltusotine (nominal p=0.0335).
The observed safety and tolerability profile remained unchanged (see section 4.8) and the durability of the clinical treatment benefits were retained in patients dosed for 120 weeks in the ongoing OLE study PATHFNDR-1.
Paediatric population
The European Medicines Agency has waived the obligation to submit the results of studies with Palsonify in all subsets of the paediatric population in the treatment of acromegaly (see section 4.2 for information on paediatric use).
5.2. Pharmacokinetic properties
Absorption
In healthy volunteers, after a single oral dose the median Tmax ranged from 1.4 to 2.0 h (Table 8). At steady state, following a 60 mg dose, the paltusotine geometric mean (geometric %CV) Cmax was 290 (67.5) ng/mL and the geometric mean (geometric %CV) AUC0-24 was 2 890 (63.5) ng*h/mL. In the population pharmacokinetic (PK) analysis, accumulation ratios were 1.31 for Cmax and 1.55 for AUC0-24. Steady state is reached by 1 week. The PK in healthy volunteers is similar to patients with acromegaly.
Table 8. Exposure parameters of single dose of paltusotine when administered with a 1-hour postdose fast:
| 20 mg | 40 mg | 60 mg | |
| Cmax (ng/mL) | 80.7 (54) | 153 (36) | 258 (51) |
| AUC0-24 (ng*h/mL) | 651 (53) | 1 310 (41) | 2 370 (45) |
| Tmax (h) | 1.4 (0.8-4.0) | 1.5 (1.5-4.0) | 2.0 (1.0-4.0) |
Data are shown as geometric means (geometric %CV) except for Tmax, which is shown as median (range).
AUC0-24 = area under the plasma concentration-time curve from time 0 to 24 hours, Cmax = maximum (peak) plasma drug concentration, Tmax =time to reach maximum (peak) plasma concentration following drug administration
The absolute bioavailability of paltusotine film-coated tablets is 51%.
Effect of food on oral absorption
Relative to administration in the fasted state, administration of paltusotine with a high-fat meal reduced the AUC by 85% and the Cmax by 81%. Administration of paltusotine with a low-fat meal reduced AUC by 72% and the Cmax by 68% (see section 4.2).
Distribution
The apparent volume of distribution (Vz/F) of paltusotine film-coated tablets is 406 L. Paltusotine is highly plasma protein bound to both albumin (>99%) and α-1-acid glycoprotein (>98%). The blood to plasma ratio was near 1.
Metabolism
Paltusotine is metabolised primarily hepatically via glucuronidation and oxidation. In vitro, glucuronidation was the major pathway of metabolism and is primarily mediated by UGT1A1 and UGT1A9. Oxidation was a secondary pathway and was primarily catalysed by CYP3A4/5 with a minor contribution from CYP2D6. Paltusotine is a P-gp substrate. In vitro studies suggest inhibition of UGT1A1 is not expected to have clinical meaningful increase in paltusotine exposure.
Elimination
After maximal concentrations were attained, paltusotine concentration declined with apparent terminal half-life (t½) of 25.5 hours which supports once-daily dosing. The apparent clearance of paltusotine film-coated tablets is 11.0 L/h.
Following oral administration of radiolabelled paltusotine, faecal excretion was the predominant route of elimination with observed mean recovery of total administered radioactivity being 90% and 3.9% in faeces and urine, respectively. Unchanged paltusotine was a major component in excreta.
Linearity
Paltusotine exhibited dose-proportional increases in exposures for doses ranging from 20 mg to 120 mg in healthy participants. Apparent dose proportional increases were observed for mean steady-state trough concentrations up to 60 mg once daily dosing in patients with acromegaly.
Special populations
Age, body weight, gender, race, and UGT1A1 polymorphism
Gender, and UGT1A1 polymorphism do not have a clinically relevant effect on the pharmacokinetics of paltusotine. No dose adjustments of paltusotine based on these factors are required.
Based on population PK analysis, age (290 participants [92%] aged 18-65 years and 25 elderly participants [8%], including 20 aged 65-74 years, 5 aged 75-84 years, none aged 85 years or more) did not have a clinically relevant effect on the pharmacokinetics of paltusotine.
Based on population PK analysis, body weight (mean: 76 kg; median: 73 kg; interquartile range: 65-85 kg; min: 45 kg; max: 138 kg) did not have a clinically meaningful effect on exposure of paltusotine.
Based on population PK analysis (196 White participants, 12 Black or African American participants, 17 Chinese participants, 35 Japanese participants, 48 of another race, and 7 of unknown race), race did not have a clinically meaningful effect on exposure of paltusotine.
Hepatic impairment
In a study comparing participants with mild, moderate, or severe hepatic impairment to participants with normal hepatic function, paltusotine exposure was not altered. No dose adjustment is required (see section 4.2).
Renal impairment
As renal clearance has a minor contribution to the elimination of paltusotine in humans, no dedicated PK study was performed in patients with renal impairment. In a population PK analysis including 279 participants with normal renal function (eGFR ≥90 mL/min), 32 with mild renal impairment (eGFR 60 to <90 mL/min), and 4 with moderate renal impairment (eGFR 30 to <60 mL/min), renal function did not have a meaningful effect on paltusotine exposures. No data are available in patients with severe and end stage renal impairment (eGFR <30 mL/min).
5.3. Preclinical safety data
Non-clinical data reveal no special hazard for humans based on conventional studies of acute and repeated dose toxicity, safety pharmacology, genotoxicity and carcinogenicity potential.
Reproductive and developmental toxicity
In fertility and early embryonic development studies of rats at doses of up to 500 mg/kg/day (18-times the clinical dose of 60 mg based on AUC), no paltusotine effect on mating or fertility were observed. However, females at this dose level presented decreased numbers of corpora lutea and implantation sites as well as increased preimplantation loss resulting in fewer numbers of live embryos; these findings were not reported at doses up to 75 mg/kg/day (5-times the clinical dose of 60 mg based on AUC).
Embryo-foetal development studies in rats and rabbits with doses up to 500 mg/kg/day (rat) and 75 mg/kg/day (rabbit) showed no evidence of teratogenic effects (up to 11 times and 5.2 times the clinical dose of 60 mg based on AUC in rat and in rabbit, respectively). In rabbits, the highest dose showed an increased incidence of abortions associated with maternal toxicity (decreased food intake and body weight loss) and a decrease in mean foetal body weights. This was not observed at the 25 mg/kg/day dose (2.9 times the clinical dose of 60 mg based on AUC).
In a pre- and postnatal development study in rat, decreased body weight was observed during the preweaning and postweaning development periods at 500 mg/kg/day, the highest dose tested. There were no treatment-related effects on sexual maturation, neurobehavioral or reproductive function of the first filial (F1) generation rats at any dose level. Excretion of paltusotine into maternal milk was demonstrated with milk-to-plasma concentration ratios at 4 hours postdosing on lactation day (LD) 20 ranging from 2.4- to 3.8-fold.
© All content on this website, including data entry, data processing, decision support tools, "RxReasoner" logo and graphics, is the intellectual property of RxReasoner and is protected by copyright laws. Unauthorized reproduction or distribution of any part of this content without explicit written permission from RxReasoner is strictly prohibited. Any third-party content used on this site is acknowledged and utilized under fair use principles.