PREMPRO Sugar-coated tablet Ref.[10585] Active ingredients: Estrogens, conjugated Medroxyprogesterone
Source: FDA, National Drug Code (US) Revision Year: 2017
12.1. Mechanism of Action
Endogenous estrogens are largely responsible for the development and maintenance of the female reproductive system and secondary sexual characteristics. Although circulating estrogens exist in a dynamic equilibrium of metabolic interconversions, estradiol is the principal intracellular human estrogen and is substantially more potent than its metabolites, estrone and estriol, at the receptor level.
The primary source of estrogen in normally cycling adult women is the ovarian follicle, which secretes 70 to 500 mcg of estradiol daily, depending on the phase of the menstrual cycle. After menopause, most endogenous estrogen is produced by conversion of androstenedione, which is secreted by the adrenal cortex, to estrone in the peripheral tissues. Thus, estrone and the sulfate-conjugated form, estrone sulfate, are the most abundant circulating estrogens in postmenopausal women.
Estrogens act through binding to nuclear receptors in estrogen-responsive tissues. To date, two estrogen receptors have been identified. These vary in proportion from tissue to tissue.
Circulating estrogens modulate the pituitary secretion of the gonadotropins, luteinizing hormone (LH) and FSH, through a negative feedback mechanism. Estrogens act to reduce the elevated levels of these gonadotropins seen in postmenopausal women.
Parenterally administered medroxyprogesterone acetate (MPA) inhibits gonadotropin production, which in turn prevents follicular maturation and ovulation; although available data indicate that this does not occur when the usually recommended oral dosage is given as single daily doses. MPA may achieve its beneficial effect on the endometrium in part by decreasing nuclear estrogen receptors and suppression of epithelial DNA synthesis in endometrial tissue. Androgenic and anabolic effects of MPA have been noted, but the drug is apparently devoid of significant estrogenic activity.
12.2. Pharmacodynamics
Currently, there are no pharmacodynamic data known for PREMPRO or PREMPHASE tablets.
12.3. Pharmacokinetics
Absorption
PREMPRO and PREMPHASE contain a formulation of medroxyprogesterone acetate (MPA) that is immediately released and conjugated estrogens that are slowly released over several hours. Conjugated estrogens are water-soluble and are well-absorbed from the gastrointestinal tract after release from the drug formulation. MPA is well absorbed from the gastrointestinal tract. Table 3 and Table 4 summarize the mean pharmacokinetic parameters for select unconjugated and conjugated estrogens and medroxyprogesterone acetate following administration of PREMPRO to healthy, postmenopausal women.
Table 3. Pharmacokinetic parameters for unconjugated and conjugated estrogens (ce) and medroxyprogesterone acetate (mpa):
| DRUG | 2 × 0.625 mg CE/2.5 mg MPA Combination Tablets (n = 54) | 2 × 0.625 mg CE/5 mg MPA Combination Tablets (n = 51) | ||||||
|---|---|---|---|---|---|---|---|---|
| PK Parameter Arithmetic Mean (%CV) | Cmax (pg/mL) | tmax (h) | t1/2 (h) | AUC (pg∙h/mL) | Cmax (pg/mL) | tmax (h) | t1/2 (h) | AUC (pg∙h/mL) |
| Unconjugated Estrogens | ||||||||
| Estrone | 175 (23) | 7.6 (24) | 31.6 (23) | 5358 (34) | 124 (43) | 10 (35) | 62.2 (137) | 6303 (40) |
| BA* -Estrone | 159 (26) | 7.6 (24) | 16.9 (34) | 3313 (40) | 104 (49) | 10 (35) | 26.0 (100) | 3136 (51) |
| Equilin | 71 (31) | 5.8 (34) | 9.9 (35) | 951 (43) | 54 (43) | 8.9 (34) | 15.5 (53) | 1179 (56) |
| PK Parameter Arithmetic Mean (%CV) | Cmax (ng/mL) | tmax (h) | t1/2 (h) | AUC (ng∙h/mL) | Cmax (ng/mL) | tmax (h) | t1/2 (h) | AUC (ng∙h/mL) |
| Conjugated Estrogens | ||||||||
| Total Estrone | 6.6 (38) | 6.1 (28) | 20.7 (34) | 116 (59) | 6.3 (48) | 9.1 (29) | 23.6 (36) | 151 (42) |
| BA* -Total Estrone | 6.4 (39) | 6.1 (28) | 15.4 (34) | 100 (57) | 6.2 (48) | 9.1 (29) | 20.6 (35) | 139 (40) |
| Total Equilin | 5.1 (45) | 4.6 (35) | 11.4 (25) | 50 (70) | 4.2 (52) | 7.0 (36) | 17.2 (131) | 72 (50) |
| PK Parameter Arithmetic Mean (%CV) | Cmax (ng/mL) | tmax (h) | t1/2 (h) | AUC (ng∙h/mL) | Cmax (ng/mL) | tmax (h) | t1/2 (h) | AUC (ng∙h/mL) |
| Medroxyprogesterone Acetate | ||||||||
| MPA | 1.5 (40) | 2.8 (54) | 37.6 (30) | 37 (30) | 4.8 (31) | 2.4 (50) | 46.3 (39) | 102 (28) |
BA* = Baseline adjusted
Cmax = peak plasma concentration
tmax = time peak concentration occurs
t1/2 = apparent terminal-phase disposition half-life (0.693/λz)
AUC = total area under the concentration-time curve
Table 4. Pharmacokinetic parameters for unconjugated and conjugated estrogens (ce) and medroxyprogesterone acetate (mpa):
| DRUG | 4 × 0.45 mg CE/1.5 mg MPA Combination (n = 65) | |||
|---|---|---|---|---|
| PK Parameter Arithmetic Mean (%CV) | Cmax (pg/mL) | tmax (h) | t1/2 (h) | AUC (pg∙h/mL) |
| Unconjugated Estrogens | ||||
| Estrone | 149 (35) | 8.9 (35) | 37.5 (35) | 6641 (39) |
| BA* -Estrone | 130 (40) | 8.9 (35) | 21.2 (35) | 3799 (47) |
| Equilin | 83 (38) | 8.3 (48) | 15.9 (44) | 1889 (40) |
| PK Parameter Arithmetic Mean (%CV) | Cmax (ng/mL) | tmax (h) | t1/2 (h) | AUC (ng∙h/mL) |
| Conjugated Estrogens | ||||
| Total Estrone | 5.4 (49) | 7.9 (48) | 22.4 (53) | 119 (48) |
| BA* -Total Estrone | 5.2 (48) | 7.9 (48) | 15.1 (29) | 100 (47) |
| Total Equilin | 4.3 (42) | 6.5 (45) | 11.6 (31) | 74 (48) |
| PK Parameter Arithmetic Mean (%CV) | Cmax (ng/mL) | tmax (h) | t1/2 (h) | AUC (ng∙h/mL) |
| Medroxyprogesterone Acetate | ||||
| MPA | 0.7 (66) | 2.0 (52) | 26.2 (35) | 5.0 (61) |
BA* = Baseline adjusted
Cmax = peak plasma concentration
tmax = time peak concentration occurs
t1/2 = apparent terminal-phase disposition half-life (0.693/λz)
AUC = total area under the concentration-time curve
Food-Effect
Single dose studies in healthy, postmenopausal women were conducted to investigate any potential drug interaction when PREMPRO or PREMPHASE is administered with a high-fat breakfast. Administration with food decreased the Cmax of total estrone by 18 to 34 percent and increased total equilin Cmax by 38 percent compared to the fasting state, with no other effect on the rate or extent of absorption of other conjugated or unconjugated estrogens. Administration with food approximately doubles MPA Cmax and increases MPA AUC by approximately 20 to 30 percent.
Dose Proportionality
The Cmax and AUC values for MPA observed in two separate pharmacokinetic studies conducted with 2 PREMPRO 0.625 mg/2.5 mg or 2 PREMPRO or PREMPHASE 0.625 mg/5 mg tablets exhibited nonlinear dose proportionality; doubling the MPA dose from 2 × 2.5 to 2 × 5 mg increased the mean Cmax and AUC by 3.2- and 2.8-fold, respectively.
The dose proportionality of estrogens and medroxyprogesterone acetate was assessed by combining pharmacokinetic data across another two studies totaling 61 healthy, postmenopausal women. Single conjugated estrogens doses of 2 × 0.3 mg, 2 × 0.45 mg, or 2 × 0.625 mg were administered either alone or in combination with medroxyprogesterone acetate doses of 2 × 1.5 mg or 2 × 2.5 mg. Most of the estrogen components demonstrated dose proportionality; however, several estrogen components did not. Medroxyprogesterone acetate pharmacokinetic parameters increased in a dose-proportional manner.
Distribution
The distribution of exogenous estrogens is similar to that of endogenous estrogens. Estrogens are widely distributed in the body and are generally found in higher concentrations in the sex hormone target organs. Estrogens circulate in the blood largely bound to SHBG and albumin. MPA is approximately 90 percent bound to plasma proteins, but does not bind to SHBG.
Metabolism
Exogenous estrogens are metabolized in the same manner as endogenous estrogens. Circulating estrogens exist in a dynamic equilibrium of metabolic interconversions. These transformations take place mainly in the liver. Estradiol is converted reversibly to estrone, and both can be converted to estriol, which is a major urinary metabolite. Estrogens also undergo enterohepatic recirculation via sulfate and glucuronide conjugation in the liver, biliary secretion of conjugates into the intestine, and hydrolysis in the intestine followed by reabsorption. In postmenopausal women, a significant portion of the circulating estrogens exists as sulfate conjugates, especially estrone sulfate, which serves as a circulating reservoir for the formation of more active estrogens. Metabolism and elimination of MPA occur primarily in the liver via hydroxylation, with subsequent conjugation and elimination in the urine.
Excretion
Estradiol, estrone, and estriol are excreted in the urine along with glucuronide and sulfate conjugates. Most metabolites of MPA are excreted as glucuronide conjugates, with only minor amounts excreted as sulfates.
Use in Specific Populations
No pharmacokinetic studies were conducted in specific populations, including patients with renal or hepatic impairment.
13.1. Carcinogenesis, Mutagenesis, Impairment of Fertility
Long-term continuous administration of natural and synthetic estrogens in certain animal species increases the frequency of carcinomas of the breasts, uterus, cervix, vagina, testis, and liver.
14. Clinical Studies
14.1 Effects on Vasomotor Symptoms
In the first year of the Health and Osteoporosis, Progestin and Estrogen (HOPE) Study, a total of 2,805 postmenopausal women (average age 53.3 ± 4.9 years) were randomly assigned to one of eight treatment groups of either placebo or conjugated estrogens, with or without medroxyprogesterone acetate. Efficacy for vasomotor symptoms was assessed during the first 12 weeks of treatment in a subset of symptomatic women (n = 241) who had at least seven moderate to severe hot flushes daily, or at least 50 moderate to severe hot flushes during the week before randomization. With PREMPRO 0.625 mg/2.5 mg, 0.45 mg/1.5 mg, and 0.3 mg/1.5 mg, the relief of both the frequency and severity of moderate to severe vasomotor symptoms was shown to be statistically improved compared to placebo at weeks 4 and 12. Table 5 shows the adjusted mean number of hot flushes in the PREMPRO 0.625 mg/2.5 mg, 0.45 mg/1.5 mg, 0.3 mg/1.5 mg, and placebo groups during the initial 12-week period.
Table 5: Summary tabulation of the number of hot flushes per day – mean values and comparisons between the active treatment groups and the placebo group – patients with at least 7 moderate to severe flushes per day or at least 50 per week at baseline, last observation carried forward (locf):
| Treatment* (No. of Patients) Time Period (week) | No. of Hot Flushes/Day | |||
|---|---|---|---|---|
| Baseline Mean ± SD | Observed Mean ± SD | Mean Change ± SD | p-Values vs. Placebo† | |
| 0.625 mg/2.5 mg (n = 34) | ||||
| 4 | 11.98 ± 3.54 | 3.19 ± 3.74 | -8.78 ± 4.72 | <0.001 |
| 12 | 11.98 ± 3.54 | 1.16 ± 2.22 | -10.82 ± 4.61 | <0.001 |
| 0.45 mg/1.5 mg (n = 29) | ||||
| 4 | 12.61 ± 4.29 | 3.64 ± 3.61 | -8.98 ± 4.74 | <0.001 |
| 12 | 12.61 ± 4.29 | 1.69 ± 3.36 | -10.92 ± 4.63 | <0.001 |
| 0.3 mg/1.5 mg (n = 33) | ||||
| 4 | 11.30 ± 3.13 | 3.70 ± 3.29 | -7.60 ± 4.71 | <0.001 |
| 12 | 11.30 ± 3.13 | 1.31 ± 2.82 | -10.00 ± 4.60 | <0.001 |
| Placebo (n = 28) | ||||
| 4 | 11.69 ± 3.87 | 7.89 ± 5.28 | -3.80 ± 4.71 | - |
| 12 | 11.69 ± 3.87 | 5.71 ± 5.22 | -5.98 ± 4.60 | - |
* Identified by dosage (mg) of Premarin/MPA or placebo.
† There were no statistically significant differences between the 0.625 mg/2.5 mg, 0.4 5 mg/1.5 mg, and 0.3 mg/1.5 mg groups at any time period.
14.2 Effects on Vulvar and Vaginal Atrophy
Results of vaginal maturation indexes at cycles 6 and 13 showed that the differences from placebo were statistically significant (p <0.001) for all treatment groups.
14.3 Effects on the Endometrium
In a 1-year clinical trial of 1,376 women (average age 54 ± 4.6 years) randomized to PREMPRO 0.625 mg/2.5 mg (n = 340), PREMPRO 0.625 mg/5 mg (n = 338), PREMPHASE 0.625 mg/5 mg (n = 351), or Premarin 0.625 mg alone (n = 347), results of evaluable biopsies at 12 months (n = 279, 274, 277, and 283, respectively) showed a reduced risk of endometrial hyperplasia in the two PREMPRO treatment groups (less than 1 percent) and in the PREMPHASE treatment group (less than 1 percent; 1 percent when focal hyperplasia was included) compared to the Premarin group (8 percent; 20 percent when focal hyperplasia was included), see Table 6.
Table 6. Incidence of endometrial hyperplasia after one year of treatment:
| Groups | ||||
|---|---|---|---|---|
| PREMPRO | PREMPRO | PREMPHASE | Premarin | |
| 0.625 mg/2.5 mg | 0.625 mg/5 mg | 0.625 mg/5 mg | 0.625 mg | |
| Total number of patients | 340 | 338 | 351 | 347 |
| Number of patients with evaluable biopsies | 279 | 274 | 277 | 283 |
| No. (%) of patients with biopsies: | ||||
| All focal and non-focal hyperplasia | 2 (<1)* | 0 (0)* | 3 (1)* | 57 (20) |
| Excluding focal cystic hyperplasia | 2 (<1)* | 0 (0)* | 1 (<1)* | 25 (8) |
* Significant (p <0.001) in comparison with Premarin (0.625 mg) alone.
In the first year of the Health and Osteoporosis, Progestin and Estrogen (HOPE) Study, 2,001 women (average age 53.3 ± 4.9 years), of whom 88 percent were Caucasian, were treated with either Premarin 0.625 mg alone (n = 348), Premarin 0.45 mg alone (n = 338), Premarin 0.3 mg alone (n = 326) or PREMPRO 0.625 mg/2.5 mg (n = 331), PREMPRO 0.45 mg/1.5 mg (n = 331) or PREMPRO 0.3 mg/1.5 mg (n = 327). Results of evaluable endometrial biopsies at 12 months showed a reduced risk of endometrial hyperplasia or cancer in the PREMPRO treatment groups compared with the corresponding Premarin alone treatment groups, except for the PREMPRO 0.3 mg/1.5 mg and Premarin 0.3 mg alone groups, in each of which there was only 1 case, see Table 7.
No endometrial hyperplasia or cancer was noted in those patients treated with the continuous combined regimens who continued for a second year in the osteoporosis and metabolic substudy of the HOPE study, see Table 8.
Table 7. incidence of endometrial hyperplasia/cancer* after one year of treatment†:
| Patient | Groups | |||||
|---|---|---|---|---|---|---|
| Prempro 0.625 mg/2.5 mg | Premarin 0.625 mg | Prempro 0.45 mg/1.5 mg | Premarin 0.45 mg | Prempro 0.3 mg/1.5 mg | Premarin 0.3 mg | |
| Total number of patients | 331 | 348 | 331 | 338 | 327 | 326 |
| Number of patients with evaluable biopsies | 278 | 249 | 272 | 279 | 271 | 269 |
| No. (%) of patients with biopsies: | ||||||
| Hyperplasia/cancer (consensus) | 0 (0)* | 20 (8) | 1 (<1)*,§ | 9 (3) | 1 (<1)¶ | 1 (<1)* |
* All cases of hyperplasia/cancer were endometrial hyperplasia, except for 1 patient in the Premarin 0.3 mg group diagnosed with endometrial cancer based on endometrial biopsy and 1 patient in the Premarin/MPA 0.4 5 mg/1.5 mg group diagnosed with endometrial cancer based on endometrial biopsy.
† Two (2) primary pathologists evaluated each endometrial biopsy. Where there was lack of agreement on the presence or absence of hyperplasia/cancer between the two, a third pathologist adjudicated (consensus).
‡ For an endometrial biopsy to be counted as consensus endometrial hyperplasia or cancer, at least 2 pathologists had to agree on the diagnosis.
§ Significant (p <0.05) in comparison with corresponding dose of Premarin alone.
¶ Non-significant in comparison with corresponding dose of Premarin alone.
Table 8. Osteoporosis and metabolic substudy, incidence of endometrial hyperplasia/cancer* after two years of treatment†:
| Patient | Groups | |||||
|---|---|---|---|---|---|---|
| Prempro 0.625 mg/2.5 mg | Premarin 0.625 mg | Prempro 0.45 mg/1.5 mg | Premarin 0.45 mg | Prempro 0.3 mg/1.5 mg | Premarin 0.3 mg | |
| Total number of patients | 75 | 65 | 75 | 74 | 79 | 73 |
| Number of patients with evaluable biopsies | 62 | 55 | 69 | 67 | 75 | 63 |
| No. (%) of patients with biopsies: | ||||||
| Hyperplasia/cancer* (consensus‡) | 0 (0)§ | 15 (27) | 0 (0)§ | 10 (15) | 0 (0)§ | 2 (3) |
* All cases of hyperplasia/cancer were endometrial hyperplasia in patients who continued for a second year in the osteoporosis and metabolic substudy of the HOPE study.
† Two (2) primary pathologists evaluated each endometrial biopsy. Where there was lack of agreement on the presence or absence of hyperplasia/cancer between the two, a third pathologist adjudicated (consensus).
‡ For an endometrial biopsy to be counted as consensus endometrial hyperplasia or cancer, at least 2 pathologists had to agree on the diagnosis.
§ Significant (p <0.05) in comparison with corresponding dose of Premarin alone.
14.4 Effects on Uterine Bleeding or Spotting
The effects of PREMPRO on uterine bleeding or spotting, as recorded on daily diary cards, were evaluated in 2 clinical trials. Results are shown in Figures 1 and 2.
Figure 1. patients with cumulative amenorrhea over time percentages of women with no bleeding or spotting at a given cycle through cycle 13 intent-to-treat:
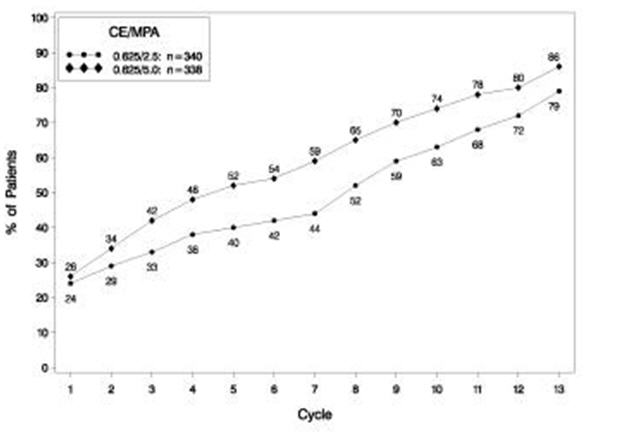
Note: The percentage of patients who were amenorrheic in a given cycle and through cycle 13 is shown. If data were missing, the bleeding value from the last reported day was carried forward (LOCF).
POPULATION, LOCF
Figure 2. patients with cumulative amenorrhea over time percentages of women with no bleeding or spotting at a given cycle through cycle 13 intent-to-treat population, locf:
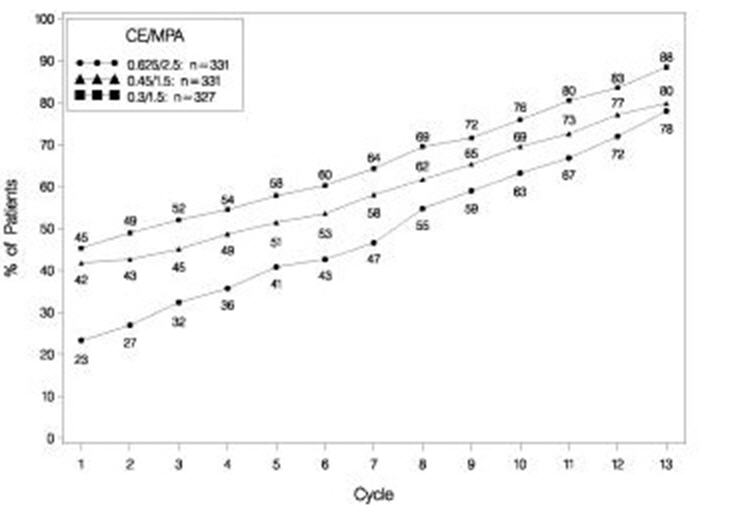
Note: The percentage of patients who were amenorrheic in a given cycle and through cycle 13 is shown. If data were missing, the bleeding value from the last reported day was carried forward (LOCF).
14.5 Effects on Bone Mineral Density
Health and Osteoporosis, Progestin and Estrogen (HOPE) Study
The HOPE study was a double-blind, randomized, placebo/active-drug-controlled, multicenter study of healthy postmenopausal women with an intact uterus. Subjects (mean age 53.3 ± 4.9 years) were 2.3 ± 0.9 years on average since menopause and took one 600 mg tablet of elemental calcium (Caltrate) daily. Subjects were not given Vitamin D supplements. They were treated with PREMPRO 0.625 mg/2.5 mg, 0.45 mg/1.5 mg or 0.3 mg/1.5 mg, comparable doses of Premarin alone, or placebo. Prevention of bone loss was assessed by measurement of bone mineral density (BMD), primarily at the anteroposterior lumbar spine (L2 to L4). Secondarily, BMD measurements of the total body, femoral neck, and trochanter were also analyzed. Serum osteocalcin, urinary calcium, and N-telopeptide were used as bone turnover markers (BTM) at cycles 6, 13, 19, and 26.
Intent-to-treat subjects
All active treatment groups showed significant differences from placebo in each of the four BMD endpoints. These significant differences were seen at cycles 6, 13, 19, and 26.
The percent changes from baseline to final evaluation are shown in Table 9.
Table 9. percent change in bone mineral density: comparison between active and placebo groups in the intent-to-treat population, locf:
| Region Evaluated Treatment Group* | No. of Subjects | Baseline (g/cm 2) Mean ± SD | Change from Baseline (%) Adjusted Mean ± SE | p-Value vs. Placebo |
|---|---|---|---|---|
| L2 to L4 BMD | ||||
| 0.625/2.5 | 81 | 1.14 ± 0.16 | 3.28 ± 0.37 | <0.001 |
| 0.45/1.5 | 89 | 1.16 ± 0.14 | 2.18 ± 0.35 | <0.001 |
| 0.3/1.5 | 90 | 1.14 ± 0.15 | 1.71 ± 0.35 | <0.001 |
| Placebo | 85 | 1.14 ± 0.14 | -2.45 ± 0.36 | |
| Total body BMD | ||||
| 0.625/2.5 | 81 | 1.14 ± 0.08 | 0.87 ± 0.17 | <0.001 |
| 0.45/1.5 | 89 | 1.14 ± 0.07 | 0.59 ± 0.17 | <0.001 |
| 0.3/1.5 | 91 | 1.13 ± 0.08 | 0.60 ± 0.16 | <0.001 |
| Placebo | 85 | 1.13 ± 0.08 | -1.50 ± 0.17 | |
| Femoral neck BMD | ||||
| 0.625/2.5 | 81 | 0.89 ± 0.14 | 1.62 ± 0.46 | <0.001 |
| 0.45/1.5 | 89 | 0.89 ± 0.12 | 1.48 ± 0.44 | <0.001 |
| 0.3/1.5 | 91 | 0.86 ± 0.11 | 1.31 ± 0.43 | <0.001 |
| Placebo | 85 | 0.88 ± 0.14 | -1.72 ± 0.45 | |
| Femoral trochanter BMD | ||||
| 0.625/2.5 | 81 | 0.77 ± 0.14 | 3.35 ± 0.59 | 0.002 |
| 0.45/1.5 | 89 | 0.76 ± 0.12 | 2.84 ± 0.57 | 0.011 |
| 0.3/1.5 | 91 | 0.76 ± 0.12 | 3.93 ± 0.56 | <0.001 |
| Placebo | 85 | 0.75 ± 0.12 | 0.81 ± 0.58 | |
* Identified by dosage (mg/mg) of Premarin/MPA or placebo.
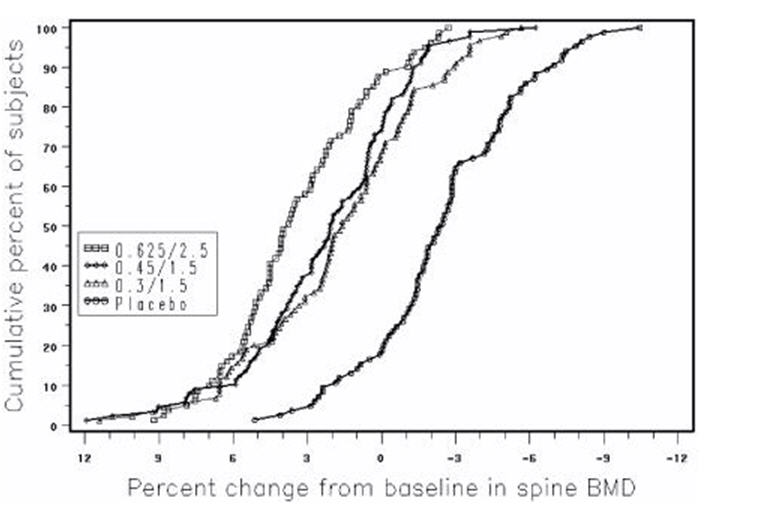
Figure 3 shows the cumulative percentage of subjects with percent changes from baseline in spine BMD equal to or greater than the percent change shown on the x-axis.
Figure 3. cumulative percent of subjects with changes from baseline in spine bmd of given magnitude or greater in premarin/mpa and placebo groups:
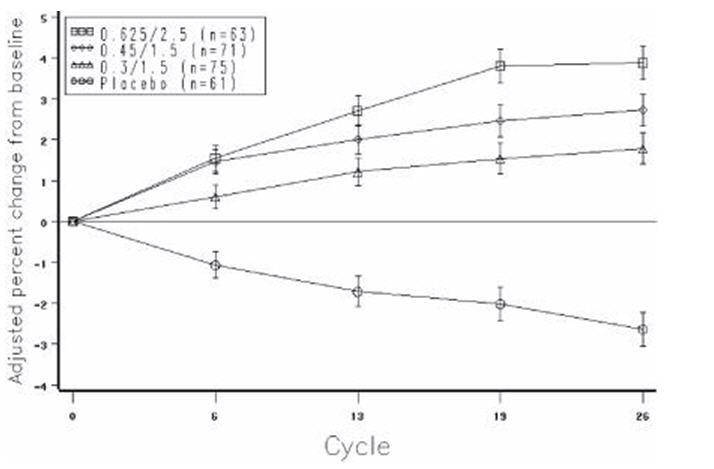
The mean percent changes from baseline in L2 to L4 BMD for women who completed the bone density study are shown with standard error bars by treatment group in Figure 4. Significant differences between each of the PREMPRO dosage groups and placebo were found at cycles 6, 13, 19, and 26.
Figure 4. adjusted mean (se) percent change from baseline at each cycle in spine bmd: subjects completing in premarin/mpa groups and placebo:
The bone turnover markers, serum osteocalcin and urinary N-telopeptide, significantly decreased (p <0.001) in all active-treatment groups at cycles 6, 13, 19, and 26 compared with the placebo group. Larger mean decreases from baseline were seen with the active groups than with the placebo group. Significant differences from placebo were seen less frequently in urine calcium; only with PREMPRO 0.625 mg/2.5 mg and 0.45 mg/1.5 mg were there significantly larger mean decreases than with placebo at 3 or more of the 4 time points.
14.6 Women's Health Initiative Studies
The WHI enrolled approximately 27,000 predominantly healthy postmenopausal women in two substudies to assess the risks and benefits of daily oral CE (0.625 mg)-alone or in combination with MPA (2.5 mg) compared to placebo in the prevention of certain chronic diseases. The primary endpoint was the incidence of CHD (defined as nonfatal MI, silent MI and CHD death), with invasive breast cancer as the primary adverse outcome. A "global index" included the earliest occurrence of CHD, invasive breast cancer, stroke, PE, endometrial cancer (only in the CE plus MPA substudy), colorectal cancer, hip fracture, or death due to other causes. These substudies did not evaluate the effects of CE plus MPA or CE-alone on menopausal symptoms.
WHI Estrogen Plus Progestin Substudy
The WHI estrogen plus progestin substudy was stopped early. According to the predefined stopping rule, after an average follow-up of 5.6 years of treatment, the increased risk of invasive breast cancer and cardiovascular events exceeded the specified benefits included in the "global index." The absolute excess risk of events included in the "global index" was 19 per 10,000 women-years.
For those outcomes included in the WHI "global index" that reached statistical significance after 5.6 years of follow-up, the absolute excess risks per 10,000 women-years in the group treated with CE plus MPA were 7 more CHD events, 8 more strokes, 10 more PEs, and 8 more invasive breast cancers, while the absolute risk reductions per 10,000 women-years were 6 fewer colorectal cancers and 5 fewer hip fractures.
Results of the CE plus MPA substudy, which included 16,608 women (average 63 years of age, range 50 to 79; 83.9 percent White, 6.8 percent Black, 5.4 percent Hispanic, 3.9 percent Other) are presented in Table 10. These results reflect centrally adjudicated data after an average follow-up of 5.6 years.
Table 10: Relative and Absolute Risk Seen in the Estrogen Plus Progestin Substudy of WHI at an Average of 5.6 Years*,†:
| Relative Risk CE/MPA vs. Placebo (95% nCI‡) | CE/MPA n = 8,506 | Placebo n = 8,102 | |
|---|---|---|---|
| Event | Absolute Risk per 10,000 Women-Years | ||
| CHD events | 1.23 (0.99–1.53) | 41 | 34 |
| Non-fatal MI | 1.28 (1.00–1.63) | 31 | 25 |
| CHD death | 1.10 (0.70–1.75) | 8 | 8 |
| All Strokes | 1.31 (1.03–1.68) | 33 | 25 |
| Ischemic stroke | 1.44 (1.09–1.90) | 26 | 18 |
| Deep vein thrombosis§ | 1.95 (1.43–2.67) | 26 | 13 |
| Pulmonary embolism | 2.13 (1.45–3.11) | 18 | 8 |
| Invasive breast cancer¶ | 1.24 (1.01–1.54) | 41 | 33 |
| Colorectal cancer | 0.61 (0.42–0.87) | 10 | 16 |
| Endometrial cancer§ | 0.81 (0.48–1.36) | 6 | 7 |
| Cervical cancer§ | 1.44 (0.47–4.42) | 2 | 1 |
| Hip fracture | 0.67 (0.47–0.96) | 11 | 16 |
| Vertebral fractures§ | 0.65 (0.46–0.92) | 11 | 17 |
| Lower arm/wrist fractures§ | 0.71 (0.59–0.85) | 44 | 62 |
| Total fractures§ | 0.76 (0.69–0.83) | 152 | 199 |
| Overall Mortality# | 1.00 (0.83–1.19) | 52 | 52 |
| Global IndexÞ | 1.13 (1.02–1.25) | 184 | 165 |
* Adapted from numerous WHI publications. WHI publications can be viewed at www.nhlbi.nih.gov/whi.
† Results are based on centrally adjudicated data.
‡ Nominal confidence intervals unadjusted for multiple looks and multiple comparisons.
§ Not included in "global index".
¶ Includes metastatic and non-metastatic breast cancer, with the exception of in situ breast cancer.
# All deaths, except from breast or colorectal cancer, definite or probable CHD, PE or cerebrovascular disease.
Þ A subset of the events was combined in a "global index" defined as the earliest occurrence of CHD events, invasive breast cancer, stroke, pulmonary embolism, colorectal cancer, hip fracture, or death due to other causes.
Timing of the initiation of estrogen plus progestin therapy relative to the start of menopause may affect the overall risk benefit profile. The WHI estrogen plus progestin substudy stratified by age showed in women 50 to 59 years of age, a non-significant trend toward reduced risk for overall mortality [hazard ratio (HR) 0.69 (95 percent CI, 0.44–1.07)].
WHI Estrogen-Alone Substudy
The WHI estrogen-alone substudy was stopped early because an increased risk of stroke was observed, and it was deemed that no further information would be obtained regarding the risks and benefits of estrogen-alone in predetermined primary endpoints.
Results of the estrogen-alone substudy, which included 10,739 women (average 63 years of age, range 50 to 79; 75.3 percent White, 15.1 percent Black, 6.1 percent Hispanic, 3.6 percent Other) after an average follow-up of 7.1 years, are presented in Table 11.
Table 11. Relative and Absolute Risk Seen in the Estrogen-Alone Substudy of WHI*:
| Relative Risk CE vs. Placebo (95% nCI†) | CE n = 5,310 | Placebo n = 5,429 | |
|---|---|---|---|
| Event | Absolute Risk per 10,000 Women-Years | ||
| CHD events‡ | 0.95 (0.78–1.16) | 54 | 57 |
| Non-fatal MI‡ | 0.91 (0.73–1.14) | 40 | 43 |
| CHD death‡ | 1.01 (0.71–1.43) | 16 | 16 |
| All Strokes‡ | 1.33 (1.05–1.68) | 45 | 33 |
| Ischemic stroke‡ | 1.55 (1.19–2.01) | 38 | 25 |
| Deep vein thrombosis‡,§ | 1.47 (1.06–2.06) | 23 | 15 |
| Pulmonary embolism‡ | 1.37 (0.90–2.07) | 14 | 10 |
| Invasive breast cancer‡ | 0.80 (0.62–1.04) | 28 | 34 |
| Colorectal cancer¶ | 1.08 (0.75–1.55) | 17 | 16 |
| Hip fracture‡ | 0.65 (0.45–0.94) | 12 | 19 |
| Vertebral fractures‡,§ | 0.64 (0.44–0.93) | 11 | 18 |
| Lower arm/wrist fractures‡,§ | 0.58 (0.47–0.72) | 35 | 59 |
| Total fractures‡,§ | 0.71 (0.64–0.80) | 144 | 197 |
| Death due to other causes¶,# | 1.08 (0.88–1.32) | 53 | 50 |
| Overall mortality‡,§ | 1.04 (0.88–1.22) | 79 | 75 |
| Global IndexÞ | 1.02 (0.92–1.13) | 206 | 201 |
* Adapted from numerous WHI publications. WHI publications can be viewed at www.nhlbi.nih.gov/whi.
† Nominal confidence intervals unadjusted for multiple looks and multiple comparisons.
‡ Results are based on centrally adjudicated data for an average follow-up of 7.1 years.
§ Not included in "global index".
¶ Results are based on an average follow-up of 6.8 years.
# All deaths, except from breast or colorectal cancer, definite or probable CHD, PE or cerebrovascular disease.
Þ A subset of the events was combined in a "global index" defined as the earliest occurrence of CHD events, invasive breast cancer, stroke, pulmonary embolism, colorectal cancer, hip fracture, or death due to other causes.
For those outcomes included in the WHI "global index" that reached statistical significance, the absolute excess risk per 10,000 women-years in the group treated with CE-alone was 12 more strokes while the absolute risk reduction per 10,000 women-years was 7 fewer hip fractures9. The absolute excess risk of events included in the "global index" was a non-significant 5 events per 10,000 women-years. There was no difference between the groups in terms of all-cause mortality.
No overall difference for primary CHD events (nonfatal MI, silent MI and CHD death) and invasive breast cancer incidence in women receiving CE-alone compared with placebo was reported in final centrally adjudicated results from the estrogen-alone substudy, after an average follow up of 7.1 years.
Centrally adjudicated results for stroke events from the estrogen-alone substudy, after an average follow-up of 7.1 years, reported no significant difference in distribution of stroke subtype or severity, including fatal strokes, in women receiving CE-alone compared to placebo. Estrogen-alone increased the risk for ischemic stroke, and this excess risk was present in all subgroups of women examined10.
Timing of the initiation of estrogen-alone therapy relative to the start of menopause may affect the overall risk benefit profile. The WHI estrogen-alone substudy, stratified by age, showed in women 50 to 59 years of age a non-significant trend toward reduced risk for CHD [HR 0.63 (95 percent CI, 0.36–1.09)] and overall mortality [HR 0.71 (95 percent CI, 0.46–1.11)].
14.7 Women's Health Initiative Memory Study
The WHIMS estrogen plus progestin ancillary study of WHI enrolled 4,532 predominantly healthy postmenopausal women 65 years of age and older (47 percent were 65 to 69 years of age; 35 percent were 70 to 74 years of age; and 18 percent were 75 years of age and older) to evaluate the effects of daily CE (0.625 mg) plus MPA (2.5 mg) on the incidence of probable dementia (primary outcome) compared to placebo.
After an average follow-up of 4 years, the relative risk of probable dementia for CE plus MPA versus placebo was 2.05 (95 percent CI, 1.21–3.48). The absolute risk of probable dementia for CE plus MPA versus placebo was 45 versus 22 cases per 10,000 women-years. Probable dementia as defined in this study included Alzheimer's disease (AD), vascular dementia (VaD) and mixed types (having features of both AD and VaD). The most common classification of probable dementia in the treatment group and the placebo group was AD. Since the ancillary study was conducted in women 65 to 79 years of age, it is unknown whether these findings apply to younger postmenopausal women [see Warnings and Precautions (5.3), and Use in Specific Populations (8.5)].
The WHIMS estrogen-alone ancillary study of WHI enrolled 2,947 predominantly healthy hysterectomized postmenopausal women 65 to 79 years of age and older (45 percent were 65 to 69 years of age; 36 percent were 70 to 74 years of age; 19 percent were 75 years of age and older) to evaluate the effects of daily CE (0.625 mg)-alone on the incidence of probable dementia (primary outcome) compared to placebo.
After an average follow-up of 5.2 years, the relative risk of probable dementia for CE-alone versus placebo was 1.49 (95 percent CI, 0.83–2.66). The absolute risk of probable dementia for CE-alone versus placebo was 37 versus 25 cases per 10,000 women-years. Probable dementia as defined in this study included AD, VaD and mixed types (having features of both AD and VaD). The most common classification of probable dementia in the treatment group and the placebo group was AD. Since the ancillary study was conducted in women 65 to 79 years of age, it is unknown whether these findings apply to younger postmenopausal women [see Warnings and Precautions (5.3), and Use in Specific Populations (8.5)].
When data from the two populations were pooled as planned in the WHIMS protocol, the reported overall relative risk for probable dementia was 1.76 (95 percent CI, 1.19–2.60). Differences between groups became apparent in the first year of treatment. It is unknown whether these findings apply to younger postmenopausal women [see Warnings and Precautions (5.3), and Use in Specific Populations (8.5)].
© All content on this website, including data entry, data processing, decision support tools, "RxReasoner" logo and graphics, is the intellectual property of RxReasoner and is protected by copyright laws. Unauthorized reproduction or distribution of any part of this content without explicit written permission from RxReasoner is strictly prohibited. Any third-party content used on this site is acknowledged and utilized under fair use principles.