STEGLATRO Film-coated tablet Ref.[8684] Active ingredients: Ertugliflozin
Source: European Medicines Agency (EU) Revision Year: 2022 Publisher: Merck Sharp & Dohme B.V., Waarderweg 39, 2031 BN Haarlem, The Netherlands
Pharmacodynamic properties
Pharmacotherapeutic group: Drugs used in diabetes, Sodium glucose co-transporter 2 (SGLT2) inhibitors
ATC code: A10BK04
Mechanism of action
SGLT2 is the predominant transporter responsible for reabsorption of glucose from the glomerular filtrate back into the circulation. Ertugliflozin is a potent, selective, and reversible inhibitor of SGLT2. By inhibiting SGLT2, ertugliflozin reduces renal reabsorption of filtered glucose and lowers the renal threshold for glucose, and thereby increases urinary glucose excretion.
Pharmacodynamic effects
Urinary glucose excretion and urinary volume
Dose-dependent increases in the amount of glucose excreted in urine were observed in healthy subjects and in patients with type 2 diabetes mellitus following single- and multiple-dose administration of ertugliflozin. Dose-response modelling indicates that ertugliflozin 5 mg and 15 mg result in near maximal urinary glucose excretion (UGE) in patients with type 2 diabetes mellitus, providing 87% and 96% of maximal inhibition, respectively.
Clinical efficacy and safety
Both improvement of glycaemic control and reduction of cardiovascular morbidity and mortality are integral parts of the treatment of type 2 diabetes mellitus.
Ertugliflozin has been studied as monotherapy and in combination with metformin, sitagliptin, a sulphonylurea, insulin (with or without metformin), metformin plus sitagliptin, metformin plus a sulphonylurea and compared to a sulphonylurea (glimepiride). Ertugliflozin has also been studied in patients with type 2 diabetes mellitus and moderate renal impairment.
The glycaemic efficacy and safety of ertugliflozin have been studied in 7 multi-centre, randomised, double-blind, placebo- or active comparator-controlled, phase 3 clinical studies involving 4 863 patients with type 2 diabetes, including a study of 468 patients with moderate renal impairment. The racial distribution was 76.8% White, 13.3% Asian, 5.0% Black and 4.8% other. Hispanic or Latino patients comprised 24.2% of the population. Patients had an average age of 57.8 years (range 21 years to 87 years), with 25.8% of patients ≥ 65 years of age and 4.5% ≥75 years of age.
In addition, a cardiovascular outcomes study (VERTIS CV) was conducted. VERTIS CV enrolled 8 246 patients with type 2 diabetes mellitus and established atherosclerotic cardiovascular disease including 1 776 patients with moderate renal impairment. VERTIS CV also included sub-studies to evaluate the glycaemic efficacy and safety of ertugliflozin added to other glycaemic treatments.
Glycaemic control
Monotherapy
A total of 461 patients with type 2 diabetes inadequately controlled on diet and exercise participated in a randomised, double-blind, multi-centre, 26-week, placebo-controlled study to evaluate the efficacy and safety of ertugliflozin monotherapy. These patients, who were not receiving any background antihyperglycaemic treatment, were randomised to ertugliflozin 5 mg, ertugliflozin 15 mg, or placebo administered once daily (see Table 2).
Table 2. Results at week 26 from a placebo-controlled monotherapy study of ertugliflozin*:
| Ertugliflozin 5 mg | Ertugliflozin 15 mg | Placebo | |
|---|---|---|---|
| HbA1c (%) | N=156 | N=151 | N=153 |
| Baseline (mean) | 8.2 | 8.4 | 8.1 |
| Change from baseline (LS mean†) | -0.8 | -1.0 | 0.2 |
| Difference from placebo (LS mean†, 95% CI) | -1.0‡ (-1.2, -0.8) | -1.2‡ (-1.4, -0.9) | |
| Patients [N (%)] with HbA1c <7% | 44 (28.2)§ | 54 (35.8)§ | 20 (13.1) |
| Body Weight (kg) | N=156 | N=152 | N=153 |
| Baseline (mean) | 94.0 | 90.6 | 94.2 |
| Change from baseline (LS mean†) | -3.2 | -3.6 | -1.4 |
| Difference from placebo (LS mean^^, 95% CI) | -1.8‡ (-2.6, -0.9) | -2.2‡ (-3.0, -1.3) |
* N includes all randomised, treated patients who had at least one measurement of the outcome variable.
† Least squares means adjusted for treatment, time, prior antihyperglycaemic medication, baseline eGFR and the interaction of time by treatment.
‡ p<0.001 compared to placebo.
§ p<0.001 compared to placebo (based on adjusted odds ratio comparisons from a logistic regression model using multiple imputation for missing data values).
Ertugliflozin as add-on combination therapy with metformin
A total of 621 patients with type 2 diabetes inadequately controlled on metformin monotherapy (≥1,500 mg/day) participated in a randomised, double-blind, multi-centre, 26-week, placebocontrolled study to evaluate the efficacy and safety of ertugliflozin in combination with metformin. Patients were randomised to ertugliflozin 5 mg, ertugliflozin 15 mg, or placebo administered once daily in addition to continuation of background metformin therapy (see Table 3).
Table 3. Results at week 26 from a placebo-controlled study for ertugliflozin used in combination with metformin*:
| Ertugliflozin 5 mg | Ertugliflozin 15 mg | Placebo | |||||
|---|---|---|---|---|---|---|---|
| HbA1c (%) | N=207 | N=205 | N=209 | ||||
| Baseline (mean) | 8.1 | 8.1 | 8.2 | ||||
| Change from baseline (LS mean†) | -0.7 | -0.9 | -0.0 | ||||
| Difference from placebo (LS mean†, 95% CI) | -0.7‡ (-0.9, -0.5) | -0.9‡ (-1.1, -0.7) | |||||
| Patients [N (%)] with HbA1c <7% | 73 (35.3)§ | 82 (40.0)§ | 33 (15.8) | Body Weight (kg) | N=207 | N=205 | N=209 |
| Baseline (mean) | 84.9 | 85.3 | 84.5 | ||||
| Change from baseline (LS mean†) | -3.0 | -2.9 | -1.3 | ||||
| Difference from placebo (LS mean†, 95% CI) | -1.7‡ (-2.2, -1.1) | -1.6‡ (-2.2, -1.0) |
* N includes all randomised, treated patients who had at least one measurement of the outcome variable.
† Least squares means adjusted for treatment, time, prior antihyperglycaemic medication (metformin monotherapy or metformin + another AHA), baseline eGFR (continuous), menopausal status randomisation stratum (men, premenopausal women, women who are perimenopausal or <3 years postmenopausal, women who are ≥3 years postmenopausal) and the interaction of time by treatment.
‡ p≤0.001 compared to placebo.
§ p<0.001 compared to placebo (based on adjusted odds ratio comparisons from a logistic regression model using multiple
imputation for missing data values).
Active-controlled study of ertugliflozin versus glimepiride as add-on combination therapy with metformin
A total of 1,326 patients with type 2 diabetes inadequately controlled on metformin monotherapy participated in a randomised, double-blind, multi-centre, 52-week, active comparator-controlled study to evaluate the efficacy and safety of ertugliflozin in combination with metformin. These patients, who were receiving metformin monotherapy (≥1,500 mg/day), were randomised to ertugliflozin 5 mg, ertugliflozin 15 mg, or glimepiride administered once daily in addition to continuation of background metformin therapy. Glimepiride was initiated at 1 mg/day and titrated up to a maximum dose of 6 or 8 mg/day (depending on maximum approved dose in each country) or a maximum tolerated dose or down-titrated to avoid or manage hypoglycaemia. The mean daily dose of glimepiride was 3.0 mg (see Table 4).
Table 4. Results at week 52 from an active-controlled study comparing ertugliflozin to glimepiride as add-on therapy in patients inadequately controlled on metformin*:
| Ertugliflozin 5 mg | Ertugliflozin 15 mg | Glimepiride | |
|---|---|---|---|
| HbA1c (%) | N=448 | N=440 | N=437 |
| Baseline (mean) | 7.8 | 7.8 | 7.8 |
| Change from baseline (LS mean†) | -0.6 | -0.6 | -0.7 |
| Difference from glimepiride (LS mean†, 95% CI) | 0.2 (0.1, 0.3) | 0.1‡ (-0.0, 0.2) | |
| Patients [N (%)] with HbA1c <7% | 154 (34.4) | 167 (38.0) | 190 (43.5) |
| Body Weight (kg) | N=448 | N=440 | N=437 |
| Baseline (mean) | 87.9 | 85.6 | 86.8 |
| Change from baseline (LS mean†) | -3.0 | -3.4 | 0.9 |
| Difference from glimepiride (LS mean†, 95% CI) | -3.9 (-4.4, -3.4) | -4.3§ (-4.8, -3.8) |
* N includes all randomised, treated patients who had at least one measurement of the outcome variable.
† Least squares means adjusted for treatment, time, prior antihyperglycaemic medication (monotherapy or dual therapy), baseline eGFR (continuous) and the interaction of time by treatment. Time was treated as a categorical variable.
‡ Non-inferiority is declared when the upper bound of the two-sided 95% confidence interval (CI) for the mean difference is less than 0.3%.
§ p<0.001 compared to glimepiride.
Factorial study with ertugliflozin and sitagliptin as add-on combination therapy with metformin
A total of 1,233 patients with type 2 diabetes participated in a randomised, double-blind, multi-centre, 26-week, active-controlled study to evaluate the efficacy and safety of ertugliflozin 5 mg or 15 mg in combination with sitagliptin 100 mg compared to the individual components. Patients with type 2 diabetes inadequately controlled on metformin monotherapy (≥1,500 mg/day) were randomised to one of five active-treatment arms: ertugliflozin 5 mg or 15 mg, sitagliptin 100 mg, or sitagliptin 100 mg in combination with 5 mg or 15 mg ertugliflozin administered once daily in addition to continuation of background metformin therapy (see Table 5).
Table 5. Results at week 26 from a factorial study with ertugliflozin and sitagliptin as add-on combination therapy with metformin compared to individual components alone*:
| Ertugliflozin 5 mg | Ertugliflozin 15 mg | Sitagliptin 100 mg | Ertugliflozin 5 mg + Sitagliptin 100 mg | Ertugliflozin 15 mg + Sitagliptin 100 mg | |
|---|---|---|---|---|---|
| HbA1c (%) | N=250 | N=248 | N=247 | N=243 | N=244 |
| Baseline (mean) | 8.6 | 8.6 | 8.5 | 8.6 | 8.6 |
| Change from baseline (LS mean†) | -1.0 | -1.1 | -1.1 | -1.5 | -1.5 |
| Difference from Sitagliptin Ertugliflozin 5 mg Ertugliflozin 15 mg (LS mean†, 95% CI) | -0.4‡ (-0.6, -0.3) -0.5‡ (-0.6, -0.3) | -0,5‡ (-0.6, -0.3) -0.4‡(-0.6, -0.3) | |||
| Patients [N (%)] with HbA1c <7% | 66 (26.4) | 79 (31.9) | 81 (32.8) | 127§ (52.3) | 120§ (49.2) |
| Body Weight (kg) | N=250 | N=248 | N=247 | N=243 | N=244 |
| Baseline (mean) | 88.6 | 88.0 | 89.8 | 89.5 | 87.5 |
| Change from baseline (LS mean†) | -2.7 | -3.7 | -0.7 | -2.5 | -2.9 |
| Difference from Sitagliptin (LS mean†, 95% CI) | -1.8‡ (-2.5, -1.2) | -2.3‡ (-2.9, -1.6) |
* N includes all randomised, treated patients who had at least one measurement of the outcome variable.
† Least squares means adjusted for treatment, time, baseline eGFR and the interaction of time by treatment.
‡ p<0.001 compared to control group.
§ p<0.001 compared to corresponding dose of ertugliflozin or sitagliptin (based on adjusted odds ratio comparisons from a logistic
regression model using multiple imputation for missing data values).
Ertugliflozin as add-on combination therapy with metformin and sitagliptin
A total of 463 patients with type 2 diabetes inadequately controlled on metformin (≥1,500 mg/day) and sitagliptin 100 mg once daily participated in a randomised, double-blind, multi-centre, 26-week, placebo-controlled study to evaluate the efficacy and safety of ertugliflozin. Patients were randomised to ertugliflozin 5 mg, ertugliflozin 15 mg, or placebo administered once daily in addition to continuation of background metformin and sitagliptin therapy (see Table 6).
Table 6. Results at week 26 from an add-on study of ertugliflozin in combination with metformin and sitagliptin*:
| Ertugliflozin 5 mg | Ertugliflozin 15 mg | Placebo | |
|---|---|---|---|
| HbA1c (%) | N=156 | N=153 | N=153 |
| Baseline (mean) | 8.1 | 8.0 | 8.0 |
| Change from baseline (LS mean†) | -0.8 | -0.9 | -0.1 |
| Difference from placebo (LS mean†, 95% CI) | -0.7‡ (-0.9, -0.5) | -0.8‡ (-0.9, -0.6) | |
| Patients [N (%)] with HbA1c <7% | 50 (32.1)‡ | 61 (39.9)‡ | 26 (17.0) |
| Body Weight (kg) | N=156 | N=153 | N=153 |
| Baseline (mean) | 87.6 | 86.6 | 86.5 |
| Change from baseline (LS mean†) | -3.3 | -3.0 | -1.3 |
| Difference from placebo (LS mean†, 95% CI) | -2.0‡ (-2.6, -1.4) | -1.7‡ (-2.3, -1.1) |
* N includes all randomized, treated patients who had at least one measurement of the outcome variable.
† Least squares means adjusted for treatment, time, prior antihyperglycaemic medication.
‡ p<0.001 compared to placebo.
Combination therapy of ertugliflozin and sitagliptin
A total of 291 patients with type 2 diabetes inadequately controlled on diet and exercise participated in a randomised, double-blind, multi-centre, placebo-controlled 26-week study to evaluate the efficacy and safety of ertugliflozin in combination with sitagliptin. These patients, who were not receiving any background anti-hyperglycaemic treatment, were randomised to ertugliflozin 5 mg or ertugliflozin 15 mg in combination with sitagliptin (100 mg) or to placebo once daily (see Table 7).
Table 7. Results at Week 26 from a combination therapy study of ertugliflozin and sitagliptin*:
| Ertugliflozin 5 mg + Sitagliptin | Ertugliflozin 15 mg + Sitagliptin | Placebo | |
|---|---|---|---|
| HbA1c (%) | N=98 | N=96 | N=96 |
| Baseline (mean) | 8.9 | 9.0 | 9.0 |
| Change from baseline (LS mean†) | -1.6 | -1.7 | -0.4 |
| Difference from placebo (LS mean† and 95% CI) | -1.2‡ (-1.5, -0.8) | -1.2‡ (-1.6, -0.9) | |
| Patients [N (%)] with HbA1c <7% | 35 (35.7)§ | 30 (31.3)§ | 8 (8.3) |
| Body Weight (kg) | N=98 | N=96 | N=97 |
| Baseline (mean) | 90.8 | 91.3 | 95.0 |
| Change from baseline (LS mean†) | -2.9 | -3.0 | -0.9 |
| Difference from placebo (LS mean†, 95% CI) | -2.0‡ (-3.0, -1.0) | -2.1‡ (-3.1, -1.1) |
* N includes all patients who received at least one dose of study medication and had at least one measurement of the outcome variable.
† Least squares means adjusted based on a longitudinal model including terms for treatment, time, and the interaction of time by treatment.
‡ p<0.001 compared to placebo.
§ p<0.001 compared to placebo (based on adjusted odds ratio comparisons from a logistic regression model using multiple imputation for missing data values).
Ertugliflozin as add-on combination therapy with insulin (with or without metformin)
In an 18-week randomised, double-blind, multi-centre, placebo-controlled, glycaemic sub-study of VERTIS CV, a total of 1 065 patients with type 2 diabetes mellitus and established atherosclerotic cardiovascular disease with inadequate glycaemic control (haemoglobin A1c [HbA1c] between 7% and 10.5%) with background therapy of insulin ≥20 units/day (59% patients were also on metformin ≥1 500 mg/day) were randomised to ertugliflozin 5 mg, ertugliflozin 15 mg or placebo once daily (see Table 8).
Table 8. Results at Week 18 from an add-on study of ertugliflozin in combination with insulin (with or without metformin) in patients with type 2 diabetes mellitus*:
| Ertugliflozin 5 mg | Ertugliflozin 15 mg | Placebo | |
|---|---|---|---|
| HbA1c (%) | N=348 | N=370 | N=347 |
| Baseline (mean) | 8.4 | 8.4 | 8.4 |
| Change from baseline (LS mean†) | -0.8 | -0.8 | -0.2 |
| Difference from placebo (LS mean†, 95% CI) | -0.6‡ (-0.7, -0.4) | -0.6‡ (-0.8, -0.5) | |
| Patients [N (%)] with HbA1c <7% | 72 (20.7)§ | 78 (21.1)§ | 37 (10.7) |
| Body weight (kg) | N=348 | N=370 | N=347 |
| Baseline (mean) | 93.8 | 92.1 | 93.3 |
| Change from baseline (LS mean†) | -1.9 | -2.1 | -0.2 |
| Difference from placebo (LS mean†, 95% CI) | -1.6‡ (-2.1, -1.1) | -1.9‡ (-2.4, -1.4) |
* N includes all randomised, treated patients who had at least one measurement of the outcome variable.
† Least squares means adjusted for time, insulin stratum, baseline eGFR, and the interaction of time by treatment.
‡ p<0.001 compared to placebo.
§ p<0.001 compared to placebo (based on adjusted odds ratio comparisons from a logistic regression model using multiple imputation for missing data values).
Ertugliflozin as add-on combination therapy with metformin and sulphonylurea
In an 18-week randomised, double-blind, multi-centre, placebo-controlled, glycaemic sub-study of VERTIS CV, a total of 330 patients with type 2 diabetes mellitus and established atherosclerotic cardiovascular disease with inadequate glycaemic control (HbA1c between 7% and 10.5%) with background therapy of metformin ≥1 500 mg/day and a sulphonylurea were randomised to ertugliflozin 5 mg, ertugliflozin 15 mg or placebo once daily (see Table 9).
Table 9. Results at Week 18 from an add-on study of ertugliflozin in combination with metformin and a sulphonylurea in patients with type 2 diabetes mellitus*:
| Ertugliflozin 5 mg | Ertugliflozin 15 mg | Placebo | |
|---|---|---|---|
| HbA1c (%) | N=100 | N=113 | N=117 |
| Baseline (mean) | 8.4 | 8.3 | 8.3 |
| Change from baseline (LS mean†) | -0.9 | -1.0 | -0.2 |
| Difference from placebo (LS mean†, 95% CI) | -0.7‡ (-0.9, -0.4) | -0.8‡ (-1.0, -0.5) | |
| Patients [N (%)] with HbA1c <7% | 37 (37.0)§ | 37 (32.7)§ | 15 (12.8) |
| Body weight (kg) | N=100 | N=113 | N=117 |
| Baseline (mean) | 92.1 | 92.9 | 90.5 |
| Change from baseline (LS mean†) | -2.0 | -2.4 | -0.5 |
| Difference from placebo (LS mean†, 95% CI) | -1.6‡ (-2.3, -0.8) | -1.9‡ (-2.6, -1.2) |
* N includes all randomised, treated patients who had at least one measurement of the outcome variable.
† Least squares means adjusted for time, baseline eGFR, and the interaction of time by treatment.
‡ p<0.001 compared to placebo.
§ p< 0.001 compared to placebo (based on adjusted odds ratio comparisons from a logistic regression model using multiple imputation for missing data values).
Moderate renal impairment
26 week placebo-controlled study:
The efficacy of ertugliflozin was also assessed separately in a dedicated study of diabetic patients with moderate renal impairment (468 patients with eGFR ≥30 to <60 mL/min/1.73 m²).
The least square (LS) mean (95% CI) changes from baseline in HbA1c were -0.26 (-0.42, -0.11), -0.29 (-0.44, -0.14), and -0.41 (-0.56, -0.27) in the placebo, ertugliflozin 5 mg, and ertugliflozin 15 mg groups, respectively. The HbA1c reductions in the ertugliflozin arms were not significantly different from placebo. The pre-specified analysis of glycaemic efficacy was confounded by use of prohibited concomitant anti-hyperglycaemic medicinal products. In a subsequent analysis excluding those subjects who used the prohibited medicinal products, ertugliflozin 5 mg and 15 mg were associated with placebo-corrected reductions in HbA1c of -0.14 (-0.36, 0.08) and -0.33 (-0.55, -0.11).
18 week placebo-controlled study:
In the VERTIS CV study, 1 776 patients with type 2 diabetes mellitus and established atherosclerotic cardiovascular disease had moderate renal impairment (eGFR ≥30 to <60 mL/min/1.73 m²). Among them, 1 319 patients had an eGFR ≥45 to <60 mL/min/1.73 m², including 879 patients exposed to ertugliflozin (see Table 10), and 457 patients had an eGFR ≥30 to <45 mL/min/1.73 m², including 299 patients exposed to ertugliflozin.
Table 10. Results at Week 18 of ertugliflozin in patients with type 2 diabetes mellitus and cardiovascular disease with baseline eGFR ≥45 to <60 mL/min/1.73 m²*:
| Ertugliflozin 5 mg | Ertugliflozin 15 mg | Placebo | |
|---|---|---|---|
| HbA1c (%) | N=465 | N=413 | N=439 |
| Baseline (mean) | 8.2 | 8.2 | 8.2 |
| Change from baseline (LS mean†) | -0.5 | -0.6 | -0.3 |
| Difference from placebo (LS mean†, 95% CI) | -0.3‡ (-0.4, -0.1) | -0.3‡ (-0.4, -0.2) | |
| Body weight (kg) | N=465 | N=413 | N=439 |
| Baseline (mean) | 92.1 | 92.5 | 92.3 |
| Change from baseline (LS mean†) | -1.8 | -1.9 | -0.5 |
| Difference from placebo (LS mean†, 95% CI) | -1.3‡ (-1.7, -0.9) | -1.4‡ (-1.8, -1.0) |
* N includes all randomised, treated patients who had at least one measurement of the outcome variable.
† Least squares means adjusted for time, baseline eGFR, and the interaction of time by treatment.
‡ p<0.001 compared to placebo.
Fasting plasma glucose
In three placebo-controlled studies, ertugliflozin resulted in statistically significant reductions in fasting plasma glucose (FPG). For ertugliflozin 5 mg and 15 mg, respectively, the placebo-corrected reductions in FPG were 1.92 and 2.44 mmol/L as monotherapy, 1.48 and 2.12 mmol/L as add-on to metformin, and 1.40 and 1.74 mmol/L as add-on to metformin and sitagliptin.
The combination of ertugliflozin and sitagliptin resulted in significantly greater reductions in FPG compared to sitagliptin or ertugliflozin alone or placebo. The combination of ertugliflozin 5 or 15 mg and sitagliptin resulted in incremental FPG reductions of 0.46 to 0.65 mmol/L compared to the ertugliflozin alone or 1.02 to 1.28 mmol/L compared to sitagliptin alone. The placebo-corrected reductions of ertugliflozin 5 or 15 mg in combination with sitagliptin were 2.16 and 2.56 mmol/L.
Efficacy in patients with baseline HbA1c ≥8%
In the monotherapy study conducted on a background of diet and exercise in patients with baseline HbA1c from 7-10.5%, the subgroup of patients in the study with a baseline HbA1c ≥8% had placebo-corrected reductions in HbA1c of 1.11% and 1.52% with ertugliflozin 5 or 15 mg, respectively.
In the study of ertugliflozin added-on to metformin in patients with baseline HbA1c from 7.0-10.5%, the placebo-corrected reductions in HbA1c for the subgroup of patients in the study with baseline HbA1c ≥9% were 1.31% and 1.43% with ertugliflozin 5 and 15 mg, respectively.
In the study of patients inadequately controlled on metformin with baseline HbA1c from 7.5-11.0%, among the subgroup of patients with a baseline HbA1c ≥10%, the combination of ertugliflozin 5 mg or 15 mg with sitagliptin resulted in reductions of HbA1c of 2.35% and 2.66% compared to 2.10%, 1.30%, and 1.82% for ertugliflozin 5 mg, ertugliflozin 15 mg and sitagliptin alone, respectively.
Post-prandial glucose
In the monotherapy study, ertugliflozin 5 and 15 mg resulted in statistically significant placebocorrected reductions in 2-hour PPG of 3.83 and 3.74 mmol/l.
Blood pressure
In three 26-week, placebo-controlled studies, ertugliflozin reduced systolic blood pressure (SBP). For ertugliflozin 5 mg and 15 mg, the statistically significant placebo-corrected reductions in SBP ranged from 2.9 mmHg to 3.7 mmHg and 1.7 mmHg to 4.5 mmHg, respectively.
In a 52-week, active-controlled study versus glimepiride, reductions from baseline in SBP were 2.2 mmHg and 3.8 mmHg for ertugliflozin 5 mg and 15 mg respectively, while subjects treated with glimepiride had an increase in SBP from baseline of 1.0 mmHg.
Subgroup analysis
In patients with type 2 diabetes treated with ertugliflozin, clinically meaningful reductions in HbA1c were observed in subgroups defined by age, sex, race, ethnicity, geographic region, baseline BMI, baseline HbA1c, and duration of type 2 diabetes mellitus.
Cardiovascular outcomes
The effect of ertugliflozin on cardiovascular risk in adult patients with type 2 diabetes mellitus and established atherosclerotic cardiovascular disease was evaluated in the VERTIS CV study, a multi-centre, multi-national, randomised, double-blind, placebo-controlled, event-driven trial. The study compared the risk of experiencing a major adverse cardiovascular event (MACE) between ertugliflozin and placebo when these were added to and used concomitantly with standard of care treatments for diabetes and atherosclerotic cardiovascular disease.
A total of 8 246 patients were randomised (placebo N=2 747, ertugliflozin 5 mg N=2 752, ertugliflozin 15 mg N=2 747) and followed for a median of 3 years. The mean age was 64 years and approximately 70% were male.
All patients in the study had inadequately controlled type 2 diabetes mellitus at baseline (HbA1c greater than or equal to 7%). The mean duration of type 2 diabetes mellitus was 13 years, the mean HbA1c at baseline was 8.2% and the mean eGFR was 76 mL/min/1.73 m². At baseline, patients were treated with one (32%) or more (67%) antidiabetic medicinal products including metformin (76%), insulin (47%), sulphonylureas (41%), dipeptidyl peptidase-4 (DPP-4) inhibitors (11%) and glucagonlike peptide-1 (GLP-1) receptor agonists (3%).
Almost all patients (99%) had established atherosclerotic cardiovascular disease at baseline. Approximately 24% patients had a history of heart failure. The primary endpoint in VERTIS CV was the time to first occurrence of MACE (cardiovascular death, non-fatal myocardial infarction (MI) or non-fatal stroke).
Ertugliflozin demonstrated non-inferiority versus placebo for MACE (see Table 11). Results for the individual 5 mg and 15 mg doses were consistent with results for the combined dose groups.
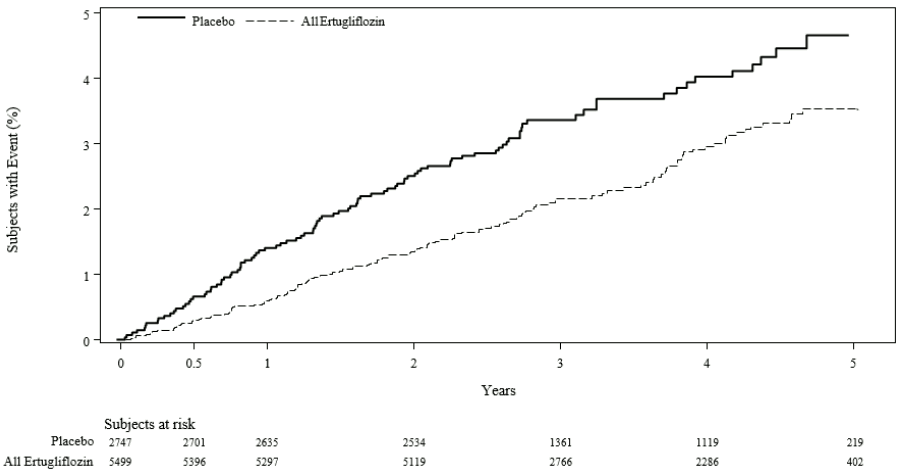
In patients treated with ertugliflozin, the rate of hospitalisation for heart failure was lower than in patients treated with placebo (see Table 11 and Figure 1).
Table 11. Analysis of MACE and its components and hospitalisation for heart failure from the VERTIS CV study*:
| Placebo (N=2 747) | Ertugliflozin (N=5 499) | ||||
|---|---|---|---|---|---|
| Endpoint† | N (%) | Event rate (per 100 person- years) | N (%) | Event rate (per 100 person- years) | Hazard ratio vs placebo (CI)‡ |
| MACE (CV death, non- fatal MI, or non-fatal stroke) | 327 (11.9) | 4.0 | 653 (11.9) | 3.9 | 0.97 (0.85, 1.11) |
| Non-fatal MI | 148 (5.4) | 1.6 | 310 (5.6) | 1.7 | 1.04 (0.86, 1.27) |
| Non-fatal stroke | 78 (2.8) | 0.8 | 157 (2.9) | 0.8 | 1.00 (0.76, 1.32) |
| CV death | 184 (6.7) | 1.9 | 341 (6.2) | 1.8 | 0.92 (0.77, 1.11) |
| Hospitalisation for heart failure# | 99 (3.6) | 1.1 | 139 (2.5) | 0.7 | 0.70 (0.54, 0.90) |
N=Number of patients, CI=Confidence interval, CV=Cardiovascular, MI=Myocardial infarction.
* Intent-to-treat analysis set.
† MACE was evaluated in subjects who took at least one dose of study medication and, for subjects who discontinued study medication prior to the end of the study, events that occurred more than 365 days after the last dose of study medication were censored. Other endpoints were evaluated using all randomised subjects and events that occurred any time after the first dose of study medication until the last contact date. The total number of first events was analysed for each endpoint.
‡ For MACE a 95.6% CI is presented, for other endpoints a 95% CI is presented.
# Not evaluated for statistical significance as it was not a part of the prespecified sequential testing procedure.
Figure 1. Time to first occurrence of hospitalisation for heart failure:
Paediatric population
The European Medicines Agency has deferred the obligation to submit the results of studies with ertugliflozin in one or more subsets of the paediatric population in Type II diabetes mellitus (see section 4.2 for information on paediatric use).
Pharmacokinetic properties
General introduction
The pharmacokinetics of ertugliflozin are similar in healthy subjects and patients with type 2 diabetes. The steady state mean plasma AUC and Cmax were 398 ng∙hr/mL and 81 ng/mL, respectively, with 5 mg ertugliflozin once daily treatment, and 1 193 ng∙hr/mL and 268 ng/mL, respectively, with 15 mg ertugliflozin once daily treatment. Steady-state is reached after 4 to 6 days of once-daily dosing with ertugliflozin. Ertugliflozin does not exhibit time-dependent pharmacokinetics and accumulates in plasma up to 10-40% following multiple dosing.
Absorption
Following single-dose oral administration of 5 mg and 15 mg of ertugliflozin, peak plasma concentrations (median time to maximum plasma concentration [Tmax]) of ertugliflozin occur at 1 hour post-dose under fasted conditions. Plasma Cmax and AUC of ertugliflozin increase in a doseproportional manner following single doses from 0.5 mg to 300 mg and following multiple doses from 1 mg to 100 mg. The absolute oral bioavailability of ertugliflozin following administration of a 15 mg dose is approximately 100%.
Administration of ertugliflozin with a high-fat and high-calorie meal decreases ertugliflozin Cmax by 29% and prolongs Tmax by 1 hour but does not alter AUC as compared with the fasted state. The observed effect of food on ertugliflozin pharmacokinetics is not considered clinically relevant, and ertugliflozin may be administered with or without food. In phase 3 clinical trials, ertugliflozin was administered without regard to meals.
Ertugliflozin is a substrate of P-glycoprotein (P-gp) and breast cancer resistance protein (BCRP) transporters.
Distribution
The mean steady-state volume of distribution of ertugliflozin following an intravenous dose is 86 L. Plasma protein binding of ertugliflozin is 93.6% and is independent of ertugliflozin plasma concentrations. Plasma protein binding is not meaningfully altered in patients with renal or hepatic impairment. The blood-to-plasma concentration ratio of ertugliflozin is 0.66.
Ertugliflozin is not a substrate of organic anion transporters (OAT1, OAT3), organic cation transporters (OCT1, OCT2), or organic anion transporting polypeptides (OATP1B1, OATP1B3) in vitro.
Biotransformation
Metabolism is the primary clearance mechanism for ertugliflozin. The major metabolic pathway for ertugliflozin is UGT1A9 and UGT2B7-mediated O-glucuronidation to two glucuronides that are pharmacologically inactive at clinically relevant concentrations. CYP-mediated (oxidative) metabolism of ertugliflozin is minimal (12%).
Elimination
The mean systemic plasma clearance following an intravenous 100 µg dose was 11 L/hr. The mean elimination half-life in type 2 diabetic patients with normal renal function was estimated to be 17 hours based on the population pharmacokinetic analysis. Following administration of an oral [14C]-ertugliflozin solution to healthy subjects, approximately 41% and 50% of the drug-related radioactivity was eliminated in faeces and urine, respectively. Only 1.5% of the administered dose was excreted as unchanged ertugliflozin in urine and 34% as unchanged ertugliflozin in faeces, which is likely due to biliary excretion of glucuronide metabolites and subsequent hydrolysis to parent.
Special populations
Renal impairment
In a phase 1 clinical pharmacology study in patients with type 2 diabetes and mild, moderate, or severe renal impairment (as determined by eGFR), following a single-dose administration of 15 mg ertugliflozin, the mean increases in AUC of ertugliflozin were ≤ 1.7-fold, compared to subjects with normal renal function. These increases in ertugliflozin AUC are not considered clinically relevant. There were no clinically meaningful differences in the ertugliflozin Cmax values among the different renal function groups. The 24-hour urinary glucose excretion declined with increasing severity of renal impairment (see section 4.4). The plasma protein binding of ertugliflozin was unaffected in patients with renal impairment.
Hepatic impairment
Moderate hepatic impairment (based on the Child-Pugh classification) did not result in an increase in exposure of ertugliflozin. The AUC of ertugliflozin decreased by approximately 13%, and Cmax decreased by approximately 21% compared to subjects with normal hepatic function. This decrease in ertugliflozin exposure is not considered clinically meaningful. There is no clinical experience in patients with Child-Pugh class C (severe) hepatic impairment. The plasma protein binding of ertugliflozin was unaffected in patients with moderate hepatic impairment.
Paediatric population
No studies with ertugliflozin have been performed in paediatric patients.
Effects of age, body weight, gender, and race
Based on a population pharmacokinetic analysis, age, body weight, gender, and race do not have a clinically meaningful effect on the pharmacokinetics of ertugliflozin.
Drug interactions
In vitro assessment of ertugliflozin
In in vitro studies, ertugliflozin and ertugliflozin glucuronides did not inhibit or inactivate CYPs 1A2, 2C9, 2C19, 2C8, 2B6, 2D6, or 3A4, and did not induce CYPs 1A2, 2B6, or 3A4. Ertugliflozin and ertugliflozin glucuronides did not inhibit the activity of UGTs 1A6, 1A9 or 2B7 in vitro. Ertugliflozin was a weak inhibitor of UGTs 1A1 and 1A4 in vitro at higher concentrations that are not clinically relevant. Ertugliflozin glucuronides had no effect on these isoforms. Overall, ertugliflozin is unlikely to affect the pharmacokinetics of concurrently administered medicinal products eliminated by these enzymes.
Ertugliflozin or ertugliflozin glucuronides do not meaningfully inhibit P-gp, OCT2, OAT1, or OAT3 transporters or transporting polypeptides OATP1B1 and OATP1B3 at clinically relevant concentrations in vitro. Overall, ertugliflozin is unlikely to affect the pharmacokinetics of concurrently administered medicinal products that are substrates of these transporters.
Preclinical safety data
Non-clinical data reveal no special hazard for humans based on conventional studies of safety pharmacology, acute toxicity, repeated dose toxicity, genotoxicity, and carcinogenic potential.
General toxicity
Repeat-dose oral toxicity studies were conducted in mice, rats, and dogs for up to 13, 26, and 39 weeks, respectively. Signs of toxicity that were considered adverse were generally observed at exposures greater than or equal to 77 times the human unbound exposure (AUC) at the maximum recommended human dose (MRHD) of 15 mg/day. Most toxicity was consistent with pharmacology related to urinary glucose loss and included decreased body weight and body fat, increased food consumption, diarrhoea, dehydration, decreased serum glucose and increases in other serum parameters reflective of increased protein metabolism, gluconeogenesis and electrolyte imbalances, and urinary changes such as polyuria, glucosuria, and calciuria. Microscopic changes related to glucosuria and/or calciuria observed only in rodents included dilatation of renal tubules, hypertrophy of zona glomerulosa in adrenal glands (rats), and increased trabecular bone (rats). Except for emesis, there were no adverse toxicity findings in dogs at 379 times the human unbound exposure (AUC) at the MRHD of 15 mg/day.
Carcinogenesis
In the 2-year mouse carcinogenicity study, ertugliflozin was administered by oral gavage at doses of 5, 15, and 40 mg/kg/day. There were no ertugliflozin-related neoplastic findings at doses up to 40 mg/kg/day (approximately 41 times human unbound exposure at the MRHD of 15 mg/day based on AUC). In the 2-year rat carcinogenicity study, ertugliflozin was administered by oral gavage at doses of 1.5, 5, and 15 mg/kg/day. Ertugliflozin-related neoplastic findings included an increased incidence of benign adrenal medullary pheochromocytoma in male rats at 15 mg/kg/day. This finding was attributed to carbohydrate malabsorption leading to altered calcium homeostasis and was not considered relevant to human risk. The no-observed-effect level (NOEL) for neoplasia was 5 mg/kg/day (approximately 16 times human unbound exposure at the MRHD of 15 mg/day).
Mutagenesis
Ertugliflozin was not mutagenic or clastogenic with or without metabolic activation in the microbial reverse mutation, in vitro cytogenetic (human lymphocytes), and in vivo rat micronucleus assays.
Reproductive toxicology
In the rat fertility and embryonic development study, male and female rats were administered ertugliflozin at 5, 25, and 250 mg/kg/day. No effects on fertility were observed at 250 mg/kg/day (approximately 386 times human unbound exposure at the MRHD of 15 mg/day based on AUC comparisons). Ertugliflozin did not adversely affect developmental outcomes in rats and rabbits at maternal exposures that were 239 and 1,069 times, respectively, the human exposure at the maximum clinical dose of 15 mg/day, based on AUC. At a maternally toxic dose in rats (250 mg/kg/day), lower foetal viability and a higher incidence of a visceral malformation were observed at maternal exposure that was 510 times the maximum clinical dose of 15 mg/day.
In the pre- and postnatal development study, decreased postnatal growth and development were observed in rats administered ertugliflozin gestation day 6 through lactation day 21 at ≥100 mg/kg/day (estimated 239 times the human exposure at the maximum clinical dose of 15 mg/day, based on AUC). Sexual maturation was delayed in both sexes at 250 mg/kg/day (estimated 620 times the MRHD at 15 mg/day, based on AUC).
When ertugliflozin was administered to juvenile rats from postnatal day (PND) 21 to PND 90, a period of renal development corresponding to the late second and third trimesters of human pregnancy, increased kidney weights, dilatation of the renal pelvis and tubules, and renal tubular mineralization were seen at an exposure 13 times the maximum clinical dose of 15 mg/day, based on AUC. Effects on bone (shorter femur length, increased trabecular bone in the femur) as well as effects of delayed puberty were observed at an exposure 817 times the MRHD of 15 mg/day based on AUC. The effects on kidney and bone did not fully reverse after the 1-month recovery period.
© All content on this website, including data entry, data processing, decision support tools, "RxReasoner" logo and graphics, is the intellectual property of RxReasoner and is protected by copyright laws. Unauthorized reproduction or distribution of any part of this content without explicit written permission from RxReasoner is strictly prohibited. Any third-party content used on this site is acknowledged and utilized under fair use principles.