TEGSEDI Solution for injection Ref.[10306] Active ingredients: Inotersen
Source: FDA, National Drug Code (US) Revision Year: 2020
12.1. Mechanism of Action
Inotersen is an antisense oligonucleotide that causes degradation of mutant and wild-type TTR mRNA through binding to the TTR mRNA, which results in a reduction of serum TTR protein and TTR protein deposits in tissues.
12.2. Pharmacodynamics
The pharmacodynamic effects of TEGSEDI were evaluated in hATTR amyloidosis patients treated with 284 mg TEGSEDI via subcutaneous injection once weekly.
With repeat dosing, the mean percent decreases from baseline in serum TTR from Week 13 to Week 65 of treatment ranged from 68% to 74% (median range: 75% to 79%). Similar TTR reductions were observed regardless of TTR mutation, sex, age, or race.
Serum TTR is a carrier of retinol binding protein, which is involved in the transport of vitamin A in the blood. Mean reductions in serum retinol binding of 71%, and serum vitamin A of 63%, were observed at Week 65 [see Warnings and Precautions (5.6)].
Cardiac Electrophysiology
Formal QTc studies have not been conducted with TEGSEDI. The potential for QTc prolongation with inotersen was evaluated in a randomized, placebo-controlled trial in healthy volunteers. No large changes in the mean QTc interval (>20 ms) were detected in the trial.
In the 66-week controlled efficacy trial, 5.4% of TEGSEDI-treated patients had evidence of QRS prolongation on their electrocardiograms (ECGs) to greater than 160 msec and greater than 25% above baseline, compared to and in 1.7% of patients on placebo.
12.3. Pharmacokinetics
Following subcutaneous administration, systemic exposure to inotersen increased in a dose-proportional manner over the range of 150-400 mg of inotersen sodium salt. At the recommended TEGSEDI dosing regimen of 284 mg every week, steady state is reached after approximately 3 months. The estimated geometric mean (90% confidence interval) steady state peak concentrations (Cmax), trough concentrations (Ctrough), and area under the curve (AUCτ) were 6.39 (5.65, 7.20) µg/mL, 0.034 (0.031, 0.038) µg/mL, and 90 (82.4, 97.4) µg·h/mL, respectively. Plasma Cmax and AUC do not exhibit accumulation at steady state.
Absorption
Following subcutaneous administration, TEGSEDI is absorbed rapidly into systemic circulation in a dose-dependent fashion, with the median time to maximum plasma concentrations (Cmax) of 2 to 4 hours.
Distribution
TEGSEDI is highly bound to human plasma proteins (>94%) and the fraction bound is independent of drug concentration. Based on animal studies (mouse, rat and monkey), TEGSEDI rapidly distributes broadly to tissues, with the highest concentrations observed in the kidney and liver. TEGSEDI does not cross the blood-brain barrier. The apparent volume of distribution of TEGSEDI at steady-state (mean and 90% confidence interval) is 293 (268, 320) L in patients with hATTR.
Elimination
The terminal elimination half-life (mean and 90% confidence interval) for TEGSEDI is 32.3 (29.4, 35.5) days. Inotersen is mainly cleared through metabolism, and the total body clearance (mean and 90% confidence interval) is 3.18 (3.08, 3.29) L/h.
Metabolism
Inotersen is metabolized by nucleases to nucleotides of various lengths.
Excretion
Less than 1% of the administered dose of inotersen is excreted unchanged into urine within 24 hours.
Specific Populations
Age, race, and sex had no impact on the steady state pharmacokinetics of inotersen or TTR reduction. Population pharmacokinetic and pharmacodynamic analyses indicated no impact of mild or moderate renal impairment (eGFR ≥30 to <90 mL/min/1.73 m²) or mild hepatic impairment (bilirubin less than or equal to 1.5 x ULN and/or AST less than 1.9 x ULN) on inotersen exposure or TTR reduction. TEGSEDI has not been studied in patients with severe renal impairment, end-stage renal disease, moderate or severe hepatic impairment, or in patients with prior liver transplant.
Drug Interaction Studies
No formal clinical drug interaction studies have been performed. TEGSEDI is not a substrate or inhibitor/inducer of major CYP enzymes or a substrate or inhibitor of major transporters. In a population pharmacokinetic analysis, concomitant use of diuretics, antithrombotic, and analgesics did not impact the pharmacokinetic parameters of inotersen. TEGSEDI is not expected to cause drug-drug interactions or to be affected by inhibitors or inducers of cytochrome P450 enzymes.
13.1. Carcinogenesis, Mutagenesis, Impairment of Fertility
In a 26-week carcinogenicity study in transgenic (TgRasH2) mice, weekly subcutaneous administration of inotersen (0, 10, 30, or 80 mg/kg) or a rodent-specific (pharmacologically active) surrogate (30 mg/kg) did not result in an increase in tumors.
Inotersen was negative for genotoxicity in in vitro (bacterial mutagenicity, chromosomal aberration in Chinese hamster lung) and in vivo (mouse bone marrow micronucleus) assays.
Subcutaneous administration of inotersen (0, 3, 15, or 25 mg/kg) or a rodent-specific surrogate (15 mg/kg) to male and female mice every other day prior to and during mating and continuing in females throughout the period of organogenesis produced no adverse effects on fertility.
14. Clinical Studies
The efficacy of TEGSEDI was demonstrated in a randomized, double-blind, placebo-controlled, multicenter clinical trial in adult patients with polyneuropathy caused by hATTR amyloidosis (Study 1; NCT 01737398). Patients were randomized in a 2:1 ratio to receive either TEGSEDI (284 mg inotersen) (N=113) or placebo (N=60), respectively, as a subcutaneous injection administered once per week for 65 weeks (3 doses were administered during the first week of treatment). Seventy seven percent of TEGSEDI-treated patients and 87% of patients on placebo completed 66 weeks of the assigned treatment.
The co-primary efficacy endpoints were the change from baseline to Week 66 in the modified Neuropathy Impairment Scale+7 (mNIS+7) composite score and the Norfolk Quality of Life-Diabetic Neuropathy (QoL-DN) total score
The mNIS+7 is an objective assessment of neuropathy, and comprises the NIS and Modified +7 composite scores. In the version of the mNIS+7 used in the trial, the NIS objectively measures deficits in cranial nerve function, muscle strength, reflexes, and sensations, and the Modified +7 assesses heart rate response to deep breathing, postural blood pressure, quantitative sensory testing (touch-pressure and heat-pain), and peripheral nerve electrophysiology. The maximum possible score was 346.32 points, with higher scores representing a greater severity of disease.
The clinical meaningfulness of effects on the mNIS+7 was assessed by the change from baseline to Week 66 in Norfolk Quality of Life-Diabetic Neuropathy (QoL-DN) total score. The Norfolk QoL-DN scale is a patient-reported assessment that evaluates the subjective experience of neuropathy in the following domains: physical functioning/large fiber neuropathy, activities of daily living, symptoms, small fiber neuropathy, and autonomic neuropathy. The version of the Norfolk QoL-DN that was used in the trial had a maximum possible total score of 136 points, with higher scores representing greater impairment.
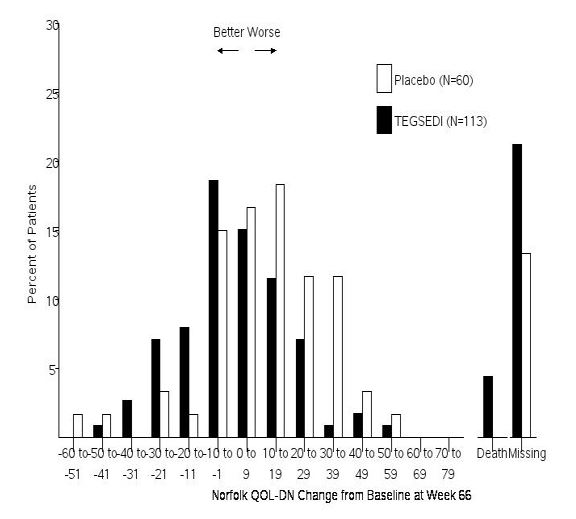
The changes from baseline to Week 66 on both the mNIS+7 and the Norfolk QoL-DN significantly favored TEGSEDI (Table 3, Figures 1 and 3). The distributions of changes in mNIS+7 and Norfolk QoL-DN scores from baseline to Week 66 by percent of patients are shown in Figure 2 and Figure 4, respectively.
Table 3. Clinical Efficacy Results from Study 1:
| Endpoint | Baseline | Change from Baseline to Week 66 (LS Mean) | TEGSEDI – placebo Treatment Difference LS Mean (95% CI) | p-value | ||
|---|---|---|---|---|---|---|
| TEGSEDI | Placebo | TEGSEDI | Placebo | |||
| Primarya | ||||||
| mNIS+7b,c | 80.2 | 75.3 | 5.8 | 25.5 | -19.7 [-26.4, -13.0] | <0.001 |
| Norfolk QOL- DNb,d | 48.7 | 48.7 | 1.0 | 12.7 | -11.7 [-18.3, -5.1] | <0.001 |
CI, confidence interval; LS, least squares; mNIS, modified Neuropathy Impairment Score; QoL-DN, Quality of Life – Diabetic Neuropathy
a All endpoints analyzed using the mixed-effect model repeated measures (MMRM) method.
b A lower value indicates less impairment/fewer symptoms.
c The primary analysis population for the mNIS+7 analysis included N=95 TEGSEDI patients and N=56 placebo patients
d The primary analysis population for the Norfolk QOL-DN analysis included N=94 TEGSEDI patients and N=57 placebo patients
Figure 1. Change from Baseline in mNIS+7:
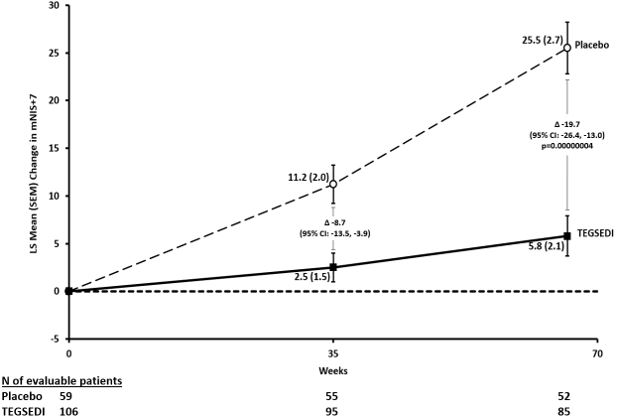
Figure 2. Histogram of mNIS+7 Change from Baseline at Week 66:
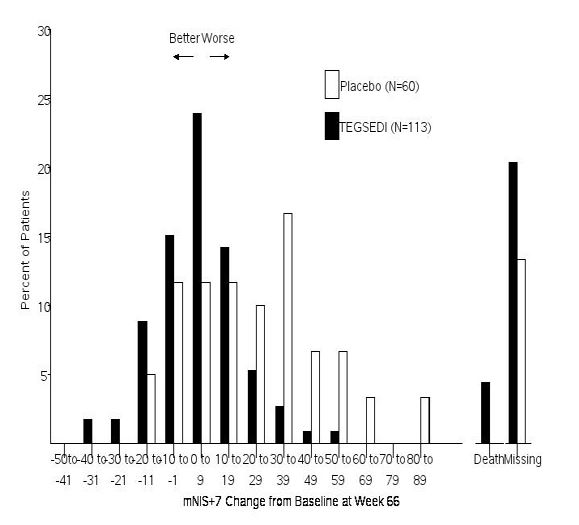
Figure 3. Change from Baseline in Norfolk QoL-DN Score:
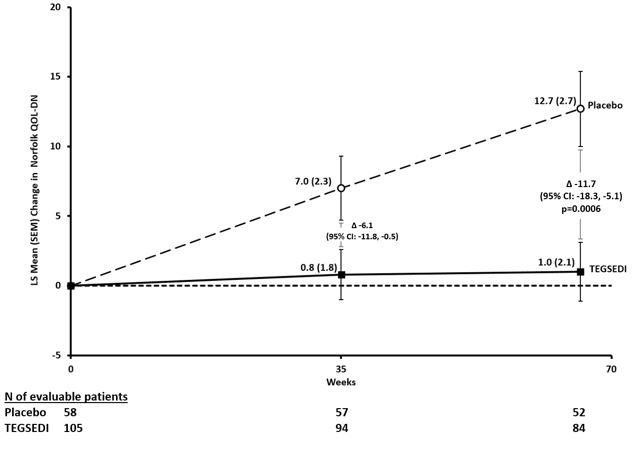
Figure 4. Histogram of Norfolk QoL-DN Change from Baseline at Week 66:
Patients receiving TEGSEDI experienced similar improvements relative to placebo in mNIS+7 and Norfolk QoL-DN score across all subgroups including age, sex, race, region, NIS score, Val30Met mutation status, and disease stage.
© All content on this website, including data entry, data processing, decision support tools, "RxReasoner" logo and graphics, is the intellectual property of RxReasoner and is protected by copyright laws. Unauthorized reproduction or distribution of any part of this content without explicit written permission from RxReasoner is strictly prohibited. Any third-party content used on this site is acknowledged and utilized under fair use principles.