TRULICITY Solution for injection Ref.[6812] Active ingredients: Dulaglutide
Source: European Medicines Agency (EU) Revision Year: 2024 Publisher: Eli Lilly Nederland B.V., Papendorpseweg 83, 3528 BJ Utrecht, The Netherlands
Pharmacodynamic properties
Pharmacotherapeutic group: Drugs used in diabetes, blood glucose lowering drugs, excl. insulins
ATC code: A10BJ05
Mechanism of action
Dulaglutide is a long-acting glucagon-like peptide 1 (GLP-1) receptor agonist. The molecule consists of 2 identical disulfide-linked chains, each containing a modified human GLP-1 analogue sequence covalently linked to a modified human immunoglobulin G4 (IgG4) heavy chain fragment (Fc) by a small peptide linker. The GLP-1 analog portion of dulaglutide is approximately 90% homologous to native human GLP-1 (7-37). Native GLP-1 has a half-life of 1.5-2 minutes due to degradation by DPP-4 and renal clearance. In contrast to native GLP-1, dulaglutide is resistant to degradation by DPP-4, and has a large size that slows absorption and reduces renal clearance. These engineering features result in a soluble formulation and a prolonged half-life of 4.7 days, which makes it suitable for once-weekly subcutaneous administration. In addition, the dulaglutide molecule was engineered to prevent the Fcγ receptor-dependent immune response and to reduce its immunogenic potential.
Dulaglutide exhibits several antihyperglycaemic actions of GLP-1. In the presence of elevated glucose concentrations, dulaglutide increases intracellular cyclic AMP (cAMP) in pancreatic beta cells leading to insulin release. Dulaglutide suppresses glucagon secretion which is known to be inappropriately elevated in patients with type 2 diabetes. Lower glucagon concentrations lead to decreased hepatic glucose output. Dulaglutide also slows gastric emptying.
Pharmacodynamic effects
Dulaglutide improves glycaemic control through the sustained effects of lowering fasting, pre-meal and postprandial glucose concentrations in patients with type 2 diabetes starting after the first dulaglutide administration and is sustained throughout the once weekly dosing interval.
A pharmacodynamic study with dulaglutide demonstrated, in patients with type 2 diabetes, a restoration of first phase insulin secretion to a level that exceeded levels observed in healthy subjects on placebo and improved second phase insulin secretion in response to an intravenous bolus of glucose. In the same study, a single 1.5 mg dose of dulaglutide appeared to increase maximal insulin secretion from the β-cells, and to enhance β-cell function in subjects with type 2 diabetes mellitus as compared with placebo.
Consistent with the pharmacokinetic profile, dulaglutide has a pharmacodynamic profile suitable for once weekly administration (see section 5.2).
Clinical efficacy and safety
Glycaemic control
The safety and efficacy of dulaglutide were evaluated in ten randomised, controlled, phase 3 trials involving 8,035 patients with type 2 diabetes. Of these, 1,644 were ≥65 years of which 174 were ≥75 years. These studies included 5,650 dulaglutide treated patients, of whom 1,558 were treated with Trulicity 0.75 mg weekly, 2,862 were treated with Trulicity 1.5 mg weekly, 616 were treated with Trulicity 3 mg weekly and 614 were treated with Trulicity 4.5 mg weekly. In all studies, dulaglutide produced clinically significant improvements in glycaemic control as measured by glycosylated haemoglobin A1c (HbA1c).
Monotherapy
Dulaglutide was studied in a 52-week active controlled monotherapy study in comparison to metformin. Trulicity 1.5 mg and 0.75 mg were superior to metformin (1500 - 2000 mg/day) in the reduction in HbA1c and a significantly greater proportion of patients reached an HbA1c target of <7.0% and ≤6.5% with Trulicity 1.5 mg and Trulicity 0.75 mg compared to metformin at 26 weeks.
Table 2. Results of a 52-week active controlled monotherapy study with two doses of dulaglutide in comparison to metformin:
| Baseline HbA1c | Mean change in HbA1c | Patients at target HbA1c | Change in FBG | Change in body weight | ||
|---|---|---|---|---|---|---|
| (%) | (%) | <7.0% (%)a | ≤6.5% (%)b | (mmol/L) | (kg) | |
| 26 weeks | ||||||
| Dulaglutide 1.5 mg once weekly (n=269) | 7.63 | -0.78†† | 61.5# | 46.0## | -1.61 | -2.29 |
| Dulaglutide 0.75 mg once weekly (n=270) | 7.58 | -0.71†† | 62.6# | 40.0# | -1.46 | -1.36# |
| Metformin 1500-2000 mg/day (n=268) | 7.60 | -0.56 | 53.6 | 29.8 | -1.34 | -2.22 |
| 52 weeks | ||||||
| Dulaglutide 1.5 mg once weekly (n=269) | 7.63 | -0.70†† | 60.0# | 42.3## | -1.56# | -1.93 |
| Dulaglutide 0.75 mg once weekly (n=270) | 7.58 | -0.55† | 53.2 | 34.7 | -1.00 | -1.09# |
| Metformin 1500-2000 mg/day (n=268) | 7.60 | -0.51 | 48.3 | 28.3 | -1.15 | -2.20 |
† multiplicity adjusted 1-sided p-value <0.025, for noninferiority; ††multiplicity adjusted 1-sided p-value <0.025, for superiority of dulaglutide to metformin, assessed for HbA1c only
# p<0.05, ##p<0.001 dulaglutide treatment group compared to metformin
a HbA1c value of 7.0 % (DCCT) corresponds to 53.0 mmol/mol (IFCC) (average blood glucose: 8.6 mmol/L)
b HbA1c value of 6.5 % (DCCT) corresponds to 47.5 mmol/mol (IFCC) (average blood glucose: 7.8 mmol/L)
FBG = fasting blood glucose; DCCT = Diabetes Control and Complications Trial; IFCC = International Federation of Clinical Chemistry and Laboratory Medicine
The rate of documented symptomatic hypoglycaemia with dulaglutide 1.5 mg and 0.75 mg, and metformin were 0.62, 0.15, and 0.09 episodes/patient/year, respectively. No cases of severe hypoglycaemia were observed.
Combination therapy with metformin
The safety and efficacy of dulaglutide was investigated in a placebo and active controlled (sitagliptin 100 mg daily) study of 104 weeks duration, all in combination with metformin. Treatment with Trulicity 1.5 mg and 0.75 mg resulted in a superior reduction in HbA1c compared to sitagliptin at 52 weeks, accompanied by a significantly greater proportion of patients achieving HbA1c targets of <7.0% and ≤6.5%. These effects were sustained to the end of the study (104 weeks).
Table 3. Results of a 104-week placebo and active controlled study with two doses of dulaglutide in comparison to sitagliptin:
| Baseline HbA1c | Mean change in HbA1c | Patients at target HbA1c | Change in FBG | Change in body weight | ||
|---|---|---|---|---|---|---|
| (%) | (%) | <7.0% (%)a | ≤6.5% (%)b | (mmol/L) | (kg) | |
| 26 weeks | ||||||
| Dulaglutide 1.5 mg once weekly (n=304) | 8.12 | -1.22‡‡,## | 60.9**,## | 46.7**,## | -2.38**,## | -3.18**,## |
| Dulaglutide 0.75 mg once weekly (n=302) | 8.19 | -1.01‡‡,## | 55.2**,## | 31.0**,## | -1.97**,## | -2.63**,## |
| Placebo (n=177) | 8.10 | 0.03 | 21.0 | 12.5 | -0.49 | -1.47 |
| Sitagliptin 100 mg once daily (n=315) | 8.09 | -0.61 | 37.8 | 21.8 | -0.97 | -1.46 |
| 52 weeks | ||||||
| Dulaglutide 1.5 mg once weekly (n=304) | 8.12 | -1.10†† | 57.6## | 41.7## | -2.38## | -3.03## |
| Dulaglutide 0.75 mg once weekly (n=302) | 8.19 | -0.87†† | 48.8## | 29.0## | -1.63## | -2.60## |
| Sitagliptin 100 mg once daily (n=315) | 8.09 | -0.39 | 33.0 | 19.2 | -0.90 | -1.53 |
| 104 weeks | ||||||
| Dulaglutide 1.5 mg once weekly (n=304) | 8.12 | -0.99†† | 54.3## | 39.1## | -1.99## | -2.88## |
| Dulaglutide 0.75 mg once weekly (n=302) | 8.19 | -0.71†† | 44.8## | 24.2## | -1.39## | -2.39 |
| Sitagliptin 100 mg once daily (n=315) | 8.09 | -0.32 | 31.1 | 14.1 | -0.47 | -1.75 |
†† multiplicity adjusted 1-sided p-value <0.025, for superiority of dulaglutide compared to sitagliptin, assessed only for HbA1c at 52 and 104 weeks
‡‡ multiplicity adjusted 1-sided p-value <0.001 for superiority of dulaglutide compared to placebo, assessed for HbA1c only
** p<0.001 dulaglutide treatment group compared to placebo
## p<0.001 dulaglutide treatment group compared to sitagliptin
a HbA1c value of 7.0% (DCCT) corresponds to 53.0 mmol/mol (IFCC) (average blood glucose: 8.6 mmol/L)
b HbA1c value of 6.5% (DCCT) corresponds to 47.5 mmol/mol (IFCC) (average blood glucose: 7.8 mmol/L)
The rates of documented symptomatic hypoglycaemia with Trulicity 1.5 mg and 0.75 mg, and sitagliptin were 0.19, 0.18, and 0.17 episodes/patient/year, respectively. No cases of severe hypoglycaemia with dulaglutide were observed.
The safety and efficacy of dulaglutide was also investigated in an active controlled study (liraglutide 1.8 mg daily) of 26 weeks duration, both in combination with metformin. Treatment with Trulicity 1.5 mg resulted in similar lowering of HbA1c and patients achieving HbA1c targets of <7.0% and ≤6.5% compared to liraglutide.
Table 4. Results of a 26-week active controlled study of one dose of dulaglutide in comparison to liraglutide:
| Baseline HbA1c | Mean change in HbA1c | Patients at target HbA1c | Change in FBG | Change in body weight | ||
|---|---|---|---|---|---|---|
| (%) | (%) | <7.0% (%)a | ≤6.5% (%)b | (mmol/L) | (kg) | |
| 26 weeks | ||||||
| Dulaglutide 1.5 mg once weekly (n=299) | 8.06 | -1.42‡ | 68.3 | 54.6 | -1.93 | -2.90# |
| Liraglutide+ 1.8 mg daily (n=300) | 8.05 | -1.36 | 67.9 | 50.9 | -1.90 | -3.61 |
‡ 1-sided p-value p<0.001, for noninferiority of dulaglutide compared to liraglutide, assessed only for HbA1c.
# p<0.05 dulaglutide treatment group compared to liraglutide.
+ Patients randomised to liraglutide were initiated at a dose of 0.6 mg/day. After Week 1, patients were up-titrated to 1.2 mg/day and then at Week 2 to 1.8 mg/day.
a HbA1c value of 7.0% (DCCT) corresponds to 53.0 mmol/mol (IFCC) (average blood glucose: 8.6 mmol/L)
b HbA1c value of 6.5% (DCCT) corresponds to 47.5 mmol/mol (IFCC) (average blood glucose: 7.8 mmol/L)
The rate of documented symptomatic hypoglycaemia with dulaglutide 1.5 mg was 0.12 episodes/patient/year and with liraglutide was 0.29 episodes/patient/year. No cases of severe hypoglycaemia were observed.
Combination therapy with metformin and sulphonylurea
In an active controlled study of 78 weeks duration, dulaglutide was compared to insulin glargine, both on a background of metformin and a sulphonylurea. At 52 weeks, Trulicity 1.5 mg demonstrated superior lowering in HbA1c to insulin glargine which was maintained at 78 weeks; whereas lowering in HbA1c with Trulicity 0.75 mg was non-inferior to insulin glargine. With Trulicity 1.5 mg a significantly higher percentage of patients reached a target HbA1c of <7.0% or ≤6.5% at 52 and 78 weeks compared to insulin glargine.
Table 5. Results of a 78-week active controlled study with two doses of dulaglutide in comparison to insulin glargine:
| Baseline HbA1c | Mean change in HbA1c | Patients at target HbA1c | Change in FBG | Change in body weight | ||
|---|---|---|---|---|---|---|
| (%) | (%) | <7.0% (%)a | ≤6.5% (%)b | (mmol/L) | (kg) | |
| 52 weeks | ||||||
| Dulaglutide 1.5 mg once weekly (n=273) | 8.18 | -1.08†† | 53.2## | 27.0## | -1.50 | -1.87## |
| Dulaglutide 0.75 mg once weekly (n=272) | 8.13 | -0.76† | 37.1 | 22.5# | -0.87## | -1.33## |
| Insulin glargine+ once daily (n=262) | 8.10 | -0.63 | 30.9 | 13.5 | -1.76 | 1.44 |
| 78 weeks | ||||||
| Dulaglutide 1.5 mg once weekly (n=273) | 8.18 | -0.90†† | 49.0## | 28.1## | -1.10# | -1.96## |
| Dulaglutide 0.75 mg once weekly (n=272) | 8.13 | -0.62† | 34.1 | 22.1 | -0.58## | -1.54## |
| Insulin glargine+ once daily (n=262) | 8.10 | -0.59 | 30.5 | 16.6 | -1.58 | 1.28 |
† multiplicity adjusted 1-sided p-value < 0.025, for noninferiority; ††multiplicity adjusted 1-sided p-value < 0.025, for superiority of dulaglutide to insulin glargine, assessed for HbA1c only
# p<0.05, ##p<0.001 dulaglutide treatment group compared to insulin glargine
+ Insulin glargine doses were adjusted utilising an algorithm with a fasting plasma glucose target of <5.6 mmol/L
a HbA1c value of 7.0% (DCCT) corresponds to 53.0 mmol/mol (IFCC) (average blood glucose: 8.6 mmol/L)
b HbA1c value of 6.5% (DCCT) corresponds to 47.5 mmol/mol (IFCC) (average blood glucose: 7.8 mmol/L)
The rates of documented symptomatic hypoglycaemia with dulaglutide 1.5 mg and 0.75 mg, and insulin glargine were 1.67, 1.67, and 3.02 episodes/patient/year, respectively. Two cases of severe hypoglycaemia were observed with dulaglutide 1.5 mg and two cases of severe hypoglycaemia were observed with insulin glargine.
Combination therapy with sulphonylurea
The safety and efficacy of dulaglutide as add-on to a sulphonylurea was investigated in a placebo controlled study of 24 weeks duration. Treatment with Trulicity 1.5 mg in combination with glimepiride resulted in a statistically significant reduction in HbA1c compared to placebo with glimepiride at 24 weeks. With Trulicity 1.5 mg, a significantly higher percentage of patients reached a target HbA1c of <7.0% and ≤6.5% at 24 weeks compared to placebo.
Table 6. Results of a 24-week placebo controlled study of dulaglutide as add-on to glimepiride:
| Baseline HbA1c | Mean change in HbA1c | Patients at target HbA1c | Change in FBG | Change in body weight | ||
|---|---|---|---|---|---|---|
| (%) | (%) | <7.0% (%)a | ≤6.5% (%)b | (mmol/L) | (kg) | |
| 24 weeks | ||||||
| Dulaglutide 1.5 mg once weekly (n=239) | 8.39 | -1.38‡‡ | 55.3‡‡ | 40.0** | -1.70‡‡ | -0.91 |
| Placebo (n=60) | 8.39 | -0.11 | 18.9 | 9.4 | 0.16 | -0.24 |
‡‡ p<0.001 for superiority of dulaglutide compared to placebo, with overall type I error controlled
** p<0.001 for dulaglutide treatment group compared to placebo
a HbA1c value of 7.0% (DCCT) corresponds to 53.0 mmol/mol (IFCC) (average blood glucose: 8.6 mmol/L)
b HbA1c value of 6.5% (DCCT) corresponds to 47.5 mmol/mol (IFCC) (average blood glucose: 7.8 mmol/L)
The rates of documented symptomatic hypoglycaemia with dulaglutide 1.5 mg and placebo were 0.90 and 0.04 episodes/patient/year, respectively. No cases of severe hypoglycaemia were observed for dulaglutide or placebo.
Combination therapy with SGLT2 inhibitor with or without metformin
The safety and efficacy of dulaglutide as add-on to sodium-glucose co-transporter 2 inhibitor (SGLT2i) therapy (96% with and 4% without metformin) were investigated in a placebo controlled study of 24 weeks duration. Treatment with Trulicity 0.75 mg or Trulicity 1.5 mg in combination with SGLT2i therapy resulted in a statistically significant reduction in HbA1c compared to placebo with SGLT2i therapy at 24 weeks. With both Trulicity 0.75 mg and 1.5 mg, a significantly higher percentage of patients reached a target HbA1c of <7.0% and ≤6.5% at 24 weeks compared to placebo.
Table 7. Results of a 24 week placebo controlled study of dulaglutide as add-on to SGLT2i therapy:
| Baseline HbA1c | Mean change in HbA1c | Patients at target HbA1c | Change in FBG | Change in body weight | ||
|---|---|---|---|---|---|---|
| (%) | (%) | <7.0%^ (%)a | ≤6.5% (%)b | (mmol/L) | (kg) | |
| 24 weeks | ||||||
| Dulaglutide 0.75 mg once weekly (n=141) | 8.05 | -1.19‡‡ | 58.8‡‡ | 38.9** | -1.44 | -2.6 |
| Dulaglutide 1.5 mg once weekly (n=142) | 8.04 | -1.33‡‡ | 67.4‡‡ | 50.8** | -1.77 | -3.1 |
| Placebo (n=140) | 8.05 | -0.51 | 31.2 | 14.6 | -0.29 | -2.3 |
‡‡ p<0.001 for superiority of dulaglutide compared to placebo, with overall type I error controlled
** p<0.001 for dulaglutide treatment group compared to placebo
^ Patients who withdrew from randomized treatment before 24 weeks were considered as not meeting the target
a HbA1c value of 7.0% (DCCT) corresponds to 53.0 mmol/mol (IFCC) (average blood glucose: 8.6 mmol/L)
b HbA1c value of 6.5% (DCCT) corresponds to 47.5 mmol/mol (IFCC) (average blood glucose: 7.8 mmol/L)
The rates of documented symptomatic hypoglycaemia with dulaglutide 0.75 mg, dulaglutide 1.5 mg, and placebo were 0.15, 0.16 and 0.12 episodes/patient/year, respectively. One patient reported severe hypoglycaemia with dulaglutide 0.75 mg in combination with SGLT2i therapy and none with dulaglutide 1.5 mg or placebo.
Combination therapy with metformin and pioglitazone
In a placebo and active (exenatide twice daily) controlled study, both in combination with metformin and pioglitazone, Trulicity 1.5 mg and 0.75 mg demonstrated superiority for HbA1c reduction in comparison to placebo and exenatide, accompanied by a significantly a greater percentage of patients achieving HbA1c targets of <7.0% or ≤6.5%.
Table 8. Results of a 52 week active controlled study with two doses of dulaglutide in comparison to exenatide:
| Baseline HbA1c | Mean change in HbA1c | Patients at target HbA1c | Change in FBG | Change in body weight | ||
|---|---|---|---|---|---|---|
| (%) | (%) | <7.0% (%)a | ≤6.5% (%)b | (mmol/L) | (kg) | |
| 26 weeks | ||||||
| Dulaglutide 1.5 mg once weekly (n=279) | 8.10 | -1.51‡‡,†† | 78.2**,## | 62.7**,## | -2.36**,## | -1.30** |
| Dulaglutide 0.75 mg once weekly (n=280) | 8.05 | -1.30‡‡/†† | 65.8**/## | 53.2**/## | -1.90**/## | 0.20*/## |
| Placebo (n=141) | 8.06 | -0.46 | 42.9 | 24.4 | -0.26 | 1.24 |
| Exenatide+ 10 mcg twice daily (n=276) | 8.07 | -0.99 | 52.3 | 38.0 | -1.35 | -1.07 |
| 52 weeks | ||||||
| Dulaglutide 1.5 mg once weekly (n=279) | 8.10 | -1.36†† | 70.8## | 57.2## | -2.04## | -1.10 |
| Dulaglutide 0.75 mg once weekly (n=280) | 8.05 | -1.07†† | 59.1# | 48.3## | -1.58# | 0.44# |
| Exenatide+ 10 mcg twice daily (n=276) | 8.07 | -0.80 | 49.2 | 34.6 | -1.03 | -0.80 |
† multiplicity adjusted 1-sided p-value <0.025, for superiority of dulaglutide to exenatide, assessed for HbA1c only
‡‡ multiplicity adjusted 1-sided p-value <0.001 for superiority of dulaglutide compared to placebo, assessed for HbA1c only
* p<0.05, **p<0.001 dulaglutide treatment group compared to placebo
# p<0.05, ##p<0.001 dulaglutide treatment group compared to exenatide
+ Exenatide dose was 5 mcg twice daily for first 4 weeks and 10 mcg twice daily thereafter
a HbA1c value of 7.0% (DCCT) corresponds to 53.0 mmol/mol (IFCC) (average blood glucose: 8.6 mmol/L)
b HbA1c value of 6.5% (DCCT) corresponds to 47.5 mmol/mol (IFCC) (average blood glucose: 7.8 mmol/L)
The rates of documented symptomatic hypoglycaemia with Trulicity 1.5 mg and 0.75 mg, and exenatide twice daily were 0.19, 0.14, and 0.75 episodes/patient/year, respectively. No cases of severe hypoglycaemia were observed for dulaglutide and two cases of severe hypoglycaemia were observed with exenatide twice daily.
Combination therapy with titrated basal insulin, with or without metformin
In a 28-week placebo controlled study, Trulicity1.5 mg was compared to placebo as add-on to titrated basal insulin glargine (88% with and 12% without metformin) to evaluate the effect on glycaemic control and safety. To optimise the insulin glargine dose, both groups were titrated to a target fasting serum glucose of <5.6 mmol/L. The mean baseline dose of insulin glargine was 37 units/day for patients receiving placebo and 41 units/day for patients receiving Trulicity 1.5 mg. The initial insulin glargine doses in patients with HbA1c <8.0% were reduced by 20%. At the end of the 28-week treatment period the dose was 65 units/day and 51 units/day, for patients receiving placebo and Trulicity 1.5 mg, respectively. At 28 weeks, treatment with once weekly Trulicity 1.5 mg resulted in a statistically significant reduction in HbA1c compared to placebo and a significantly greater percentage of patients achieving HbA1c targets of <7.0% and ≤6.5% (Table 9).
Table 9. Results of a 28-week study of dulaglutide compared to placebo as add-on to titrated insulin glargine:
| Baseline HbA1c | Mean change in HbA1c | Patients at target HbA1c | Change in FBG | Change in body weight | ||
|---|---|---|---|---|---|---|
| (%) | (%) | <7.0% (%)a | ≤6.5% (%)b | (mmol/L) | (kg) | |
| 28 weeks | ||||||
| Dulaglutide 1.5 mg once weekly and insulin glargine (n=150) | 8.41 | -1.44‡‡ | 66.7‡‡ | 50.0** | -2.48‡‡ | -1.91‡‡ |
| Placebo once weekly and insulin glargine (n=150) | 8.32 | -0.67 | 33.3 | 16.7 | -1.55 | 0.50 |
‡‡ p<0.001 for superiority of dulaglutide compared to placebo, overall type I error controlled
** p<0.001 dulaglutide treatment group compared to placebo
a HbA1c value of 7.0% (DCCT) corresponds to 53.0 mmol/mol (IFCC) (average blood glucose: 8.6 mmol/L)
b HbA1c value of 6.5% (DCCT) corresponds to 47.5 mmol/mol (IFCC) (average blood glucose: 7.8 mmol/L)
The rates of documented symptomatic hypoglycaemia with dulaglutide 1.5 mg and insulin glargine were 3.38 episodes/patient/year compared to placebo and insulin glargine 4.38 episodes/patient/year. One patient reported severe hypoglycaemia with dulaglutide 1.5 mg in combination with insulin glargine and none with placebo.
Combination therapy with prandial insulin with or without metformin
In this study, patients on 1 or 2 insulin injections per day prior to study entry, discontinued their prestudy insulin regimen and were randomised to dulaglutide once weekly or insulin glargine once daily, both in combination with prandial insulin lispro three times daily, with or without metformin. At 26 weeks, both Trulicity 1.5 mg and 0.75 mg were superior to insulin glargine in lowering of HbA1c and this effect was sustained at 52 weeks. A greater percentage of patients achieved HbA1c targets of <7.0% or ≤6.5% at 26 weeks and <7.0% at 52 weeks than with insulin glargine.
Table 10. Results of a 52-week active controlled study with two doses of dulaglutide in comparison to insulin glargine:
| Baseline HbA1c | Mean change in HbA1c | Patients at target HbA1c | Change in FBG | Change in body weight | ||
|---|---|---|---|---|---|---|
| (%) | (%) | <7.0% (%)a | ≤6.5% (%)b | (mmol/L) | (kg) | |
| 26 weeks | ||||||
| Dulaglutide 1.5 mg once weekly (n=295) | 8.46 | -1.64†† | 67.6# | 48.0# | -0.27## | -0.87## |
| Dulaglutide 0.75 mg once weekly (n=293) | 8.40 | -1.59†† | 69.0# | 43.0 | 0.22## | 0.18## |
| Insulin glargine+ once daily (n=296) | 8.53 | -1.41 | 56.8 | 37.5 | -1.58 | 2.33 |
| 52 weeks | ||||||
| Dulaglutide 1.5 mg once weekly (n=295) | 8.46 | -1.48†† | 58.5# | 36.7 | 0.08## | -0.35## |
| Dulaglutide 0.75 mg once weekly (n=293) | 8.40 | -1.42†† | 56.3 | 34.7 | 0.41## | 0.86## |
| Insulin glargine+ once daily (n=296) | 8.53 | -1.23 | 49.3 | 30.4 | -1.01 | 2.89 |
†† multiplicity adjusted 1-sided p-value <0.025, for superiority of dulaglutide to insulin glargine, assessed for HbA1c only
# p<0.05, ##p<0.001 dulaglutide treatment group compared to insulin glargine
+ Insulin glargine doses were adjusted utilizing an algorithm with a fasting plasma glucose target of <5.6 mmol/L
The rates of documented symptomatic hypoglycaemia with dulaglutide 1.5 mg and 0.75 mg, and insulin glargine were 31.06, 35.66, and 40.95 episodes/patient/year, respectively. Ten patients reported severe hypoglycaemia with dulaglutide 1.5 mg, seven with dulaglutide 0.75 mg, and fifteen with insulin glargine.
Fasting blood glucose
Treatment with dulaglutide resulted in significant reductions from baseline in fasting blood glucose. The majority of the effect on fasting blood glucose concentrations occurred by 2 weeks. The improvement in fasting glucose was sustained through the longest study duration of 104 weeks.
Postprandial glucose
Treatment with dulaglutide resulted in significant reductions in mean post prandial glucose from baseline (changes from baseline to primary time point -1.95 mmol/L to -4.23 mmol/L).
Beta-cell function
Clinical studies with dulaglutide have indicated enhanced beta-cell function as measured by homeostasis model assessment (HOMA2-%B). The durability of effect on beta-cell function was maintained through the longest study duration of 104 weeks.
Body weight
Trulicity 1.5 mg was associated with sustained weight reduction over the duration of studies (from baseline to final time point -0.35 kg to -2.90 kg). Changes in body weight with Trulicity 0.75 mg ranged from 0.86 kg to -2.63 kg. Reduction in body weight was observed in patients treated with dulaglutide irrespective of nausea, though the reduction was numerically larger in the group with nausea.
Patient reported outcomes
Dulaglutide significantly improved total treatment satisfaction compared to exenatide twice daily. In addition, there was significantly lower perceived frequency of hyperglycaemia and hypoglycaemia compared to exenatide twice daily.
Blood pressure
The effect of dulaglutide on blood pressure as assessed by Ambulatory Blood Pressure Monitoring was evaluated in a study of 755 patients with type 2 diabetes. Treatment with dulaglutide provided reductions in systolic blood pressure (SBP) (-2.8 mmHg difference compared to placebo) at 16 weeks. There was no difference in diastolic blood pressure (DBP). Similar results for SBP and DBP were demonstrated at the final 26 week time point of the study.
Cardiovascular Evaluation
The Trulicity long-term cardiovascular outcome study was a placebo-controlled, double-blind clinical trial. Type 2 diabetes patients were randomly allocated to either Trulicity 1.5 mg (4,949) or placebo (4,952) both in addition to standards of care for type 2 diabetes (the 0.75 mg dose was not administered in this study). The median study follow-up time was 5.4 years.
The mean age was 66.2 years, the mean BMI was 32.3 kg/m², and 46.3% of patients were female. There were 3,114 (31.5%) patients with established CV disease. The median baseline HbA1c was 7.2%. The Trulicity treatment arm included patients ≥65 years (n=2,619) and ≥75 years (n=484), and patients with mild (n=2,435), moderate (n=1,031) or severe (n=50) renal impairment.
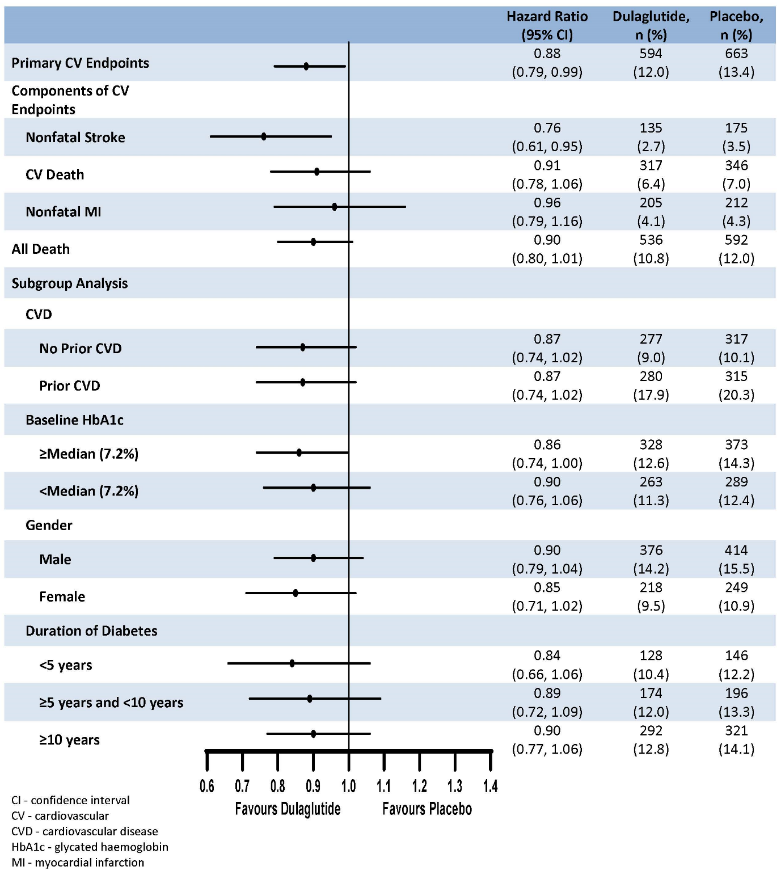
The primary endpoint was the time from randomisation to first occurrence of any major adverse cardiovascular events (MACE): CV death, non-fatal myocardial infarction, or non-fatal stroke. Trulicity was superior in preventing MACE compared to placebo (Figure 1). Each MACE component contributed to the reduction of MACE, as shown in Figure 2.
Figure 1. Kaplan-Meier plot of time to first occurrence of the composite outcome: CV death, non-fatal myocardial infarction or non-fatal stroke, in the dulaglutide long-term cardiovascular outcome study:
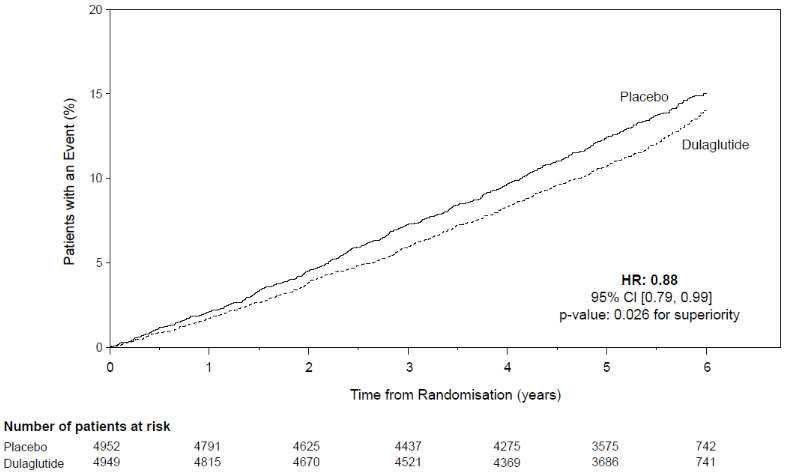
Figure 2. Forest plot of analyses of individual cardiovascular event types, all cause death, and consistency of effect across subgroups for the primary endpoint:
A significant and sustained reduction in HbA1c levels from baseline to month 60 was observed with Trulicity vs placebo, in addition to standard of care (-0.29% vs 0.22%; estimated treatment difference -0.51% [-0.57; -0.45]; p<0.001). There were significantly fewer patients in the Trulicity group who received an additional glycaemic intervention compared to placebo (Trulicity: 2,086 [42.2%]; placebo: 2,825 [57.0%]; p<0.001).
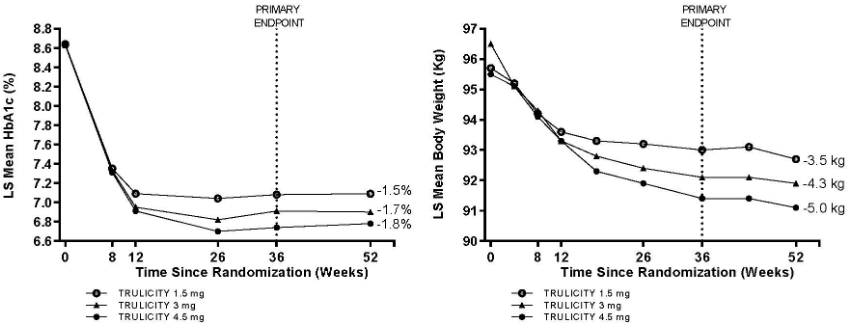
Combination of dulaglutide 4.5 mg, 3 mg and 1.5 mg therapy with metformin
The safety and efficacy of dulaglutide 3 mg and 4.5 mg once weekly compared to dulaglutide 1.5 mg once weekly as add-on to metformin were investigated in a 52 weeks study. At 36 weeks, both Trulicity 3 mg and 4.5 mg were superior to Trulicity 1.5 mg in lowering of HbA1c and body weight.
A greater percentage of patients achieved HbA1c targets of <7.0% or ≤6.5% at 36 weeks with Trulicity 3 mg and Trulicity 4.5 mg. The proportions of patients that achieved ≥5% body weight reduction from baseline were 31%, 40% and 49% for Trulicity 1.5 mg, 3 mg and 4.5 mg respectively. These effects were sustained through 52 weeks.
Table 11. Results of an active controlled study comparing three doses of dulaglutide:
| Baseline HbA1c | Mean change in HbA1c | Patients at target HbA1c | Change in FBG | Change in body weight | ||
|---|---|---|---|---|---|---|
| (%) | (%) | <7.0% (%)a | ≤6.5% (%)b | (mmol/L) | (kg) | |
| 36 weeks | ||||||
| Dulaglutide 1.5 mg once weekly (n=612) | 8.64 | -1.53 | 57.0 | 38.1 | -2.45 | -3.1 |
| Dulaglutide 3 mg once weekly (n=616) | 8.63 | -1.71# | 64.7# | 48.4‡‡ | -2.66 | -4.0# |
| Dulaglutide 4.5 mg once weekly (n=614) | 8.64 | -1.87## | 71.5# | 51.7‡‡ | -2.90# | -4.7## |
| 52 weeks | ||||||
| Dulaglutide 1.5 mg once weekly (n=612) | 8.64 | -1.52 | 58.6 | 40.4 | -2.39 | -3.5 |
| Dulaglutide 3 mg once weekly (n=616) | 8.63 | -1.71‡ | 65.4‡ | 49.2‡ | -2.70‡ | -4.3‡ |
| Dulaglutide 4.5 mg once weekly (n=614) | 8.64 | -1.83‡‡ | 71.7‡‡ | 51.3‡‡ | -2.92‡‡ | -5.0‡‡ |
# p<0.05, ##p<0.001 for superiority compared to dulaglutide 1.5 mg, adjusted p-values with overall type I error controlled
‡ p<0.05, ‡‡p<0.001 compared to dulaglutide 1.5 mg
a HbA1c value of 7.0% (DCCT) corresponds to 53.0 mmol/mol (IFCC) (average blood glucose: 8.6 mmol/L)
b HbA1c value of 6.5% (DCCT) corresponds to 47.5 mmol/mol (IFCC) (average blood glucose: 7.8 mmol/L)
Results target the on-treatment effect (analysis is based on mixed models for repeated measurements or longitudinal logistic regression).
Figure 3. Mean change in HbA1c (%) and body weight (kg) from baseline to week 52:
The rates of documented symptomatic hypoglycaemia with dulaglutide 1.5 mg, 3 mg and 4.5 mg were 0.07, 0.05 and 0.07 episodes/patient/year respectively. One patient reported severe hypoglycaemia with dulaglutide 1.5 mg, no patient with dulaglutide 3 mg, and one patient with dulaglutide 4.5 mg.
Special populations
Use in patients with renal impairment
In a 52 week study, Trulicity 1.5 mg and 0.75 mg were compared to titrated insulin glargine as add-on to prandial insulin lispro to evaluate the effect on glycaemic control and safety of patients with moderate to severe chronic kidney disease (eGFR [by CKD-EPI] <60 and ≥15 mL/min/1.73 m²). Patients discontinued their prestudy insulin regimen at randomisation. At baseline, overall mean eGFR was 38 mL/min/1.73 m², 30% of patients had eGFR <30 mL/min/1.73 m².
At 26 weeks, both Trulicity 1.5 mg and 0.75 mg were non-inferior to insulin glargine in lowering of HbA1c and this effect was sustained at 52 weeks. A similar percentage of patients achieved HbA1c targets of <8.0% at 26 and 52 weeks with both dulaglutide doses as well as insulin glargine.
Table 12. Results of a 52 week active controlled study with two doses of dulaglutide in comparison to insulin glargine (in patients with moderate to severe chronic kidney disease):
| Baseline HbA1c | Mean change in HbA1c | Patients at target HbA1c | Change in FBG | Change in body weight | |
|---|---|---|---|---|---|
| (%) | (%) | <8.0% (%)a | (mmol/L) | (kg) | |
| 26 weeks | |||||
| Dulaglutide 1.5 mg once weekly (n=192) | 8.60 | -1.19† | 78.3 | 1.28## | -2.81## |
| Dulaglutide 0.75 mg once weekly (n=190) | 8.58 | -1.12† | 72.6 | 0.98## | -2.02## |
| Insulin glargine+ once daily (n=194) | 8.56 | -1.13 | 75.3 | -1.06 | 1.11 |
| 52 weeks | |||||
| Dulaglutide 1.5 mg once weekly (n=192) | 8.60 | -1.10† | 69.1 | 1.57## | -2.66## |
| Dulaglutide 0.75 mg once weekly (n=190) | 8.58 | -1.10† | 69.5 | 1.15## | -1.71## |
| Insulin glargine+ once daily (n=194) | 8.56 | -1.00 | 70.3 | -0.35 | 1.57 |
† 1-sided p-value <0.025, for non-inferiority of dulaglutide to insulin glargine
## p<0.001 dulaglutide treatment group compared to insulin glargine
+ Insulin glargine doses were adjusted utilizing an algorithm with a fasting plasma glucose target of ≤8.3 mmol/L
a HbA1c value of 8.0% (DCCT) corresponds to 63.9 mmol/mol (IFCC) (average blood glucose: 10.1 mmol/L)
The rates of documented symptomatic hypoglycaemia with dulaglutide 1.5 mg and dulaglutide 0.75 mg, and insulin glargine were 4.44, 4.34, and 9.62 episodes/patient/year, respectively. No patients reported cases of severe hypoglycaemia with dulaglutide 1.5 mg, six with dulaglutide 0.75 mg, and seventeen with insulin glargine. The safety profile of dulaglutide in patients with renal impairment was similar to that observed in other studies with dulaglutide.
Use in the paediatric population
The safety and efficacy of dulaglutide 0.75 mg and 1.5 mg once weekly in children and adolescents aged 10 years and above were compared to placebo added to diet and exercise alone, with or without metformin and/or basal insulin. The double-blind placebo-controlled period lasted for 26 weeks, after which patients assigned to placebo started 26 weeks of open-label treatment with dulaglutide 0.75 mg once weekly and patients assigned to dulaglutide continued open-label dulaglutide at their assigned dose. At 26 weeks, dulaglutide was superior to placebo treatment in lowering HbA1c.
Table 13. Glycemic results in paediatric patients aged 10 years and above with type 2 diabetes, with inadequate glycemic control despite diet and exercise (with or without metformin and/or basal insulin):
| Baseline HbA1c | Mean change in HbA1c | Patients at target HbA1c | Mean change in FBG | Mean change in body mass index | ||
|---|---|---|---|---|---|---|
| (%) | (%) | <7.0% (%)a | ≤6.5% (%)b | (mmol/L) | (kg/m²) | |
| 26 weeks | ||||||
| Dulaglutide pooledc (n=103) | 8.0 | -0.8## | 51.5## | 41.8‡‡ | -1.1## | -0.1 |
| Dulaglutide 0.75 mg once weekly (n=51) | 7.9 | -0.6## | 54.9## | 43.1‡‡ | -0.7# | -0.2 |
| Dulaglutide 1.5 mg once weekly (n=52) | 8.2 | -0.9## | 48.1## | 40.4‡‡ | -1.4## | -0.1 |
| Placebo once weekly (n=51) | 8.1 | 0.6 | 13.7 | 9.8 | 1.0 | 0.0 |
| 52 weeksd | ||||||
| Dulaglutide pooledc (n=103) | 8.0 | -0.4 | 59.5 | 45.2 | -0.63 | 0.1 |
| Dulaglutide 0.75 mg once weekly (n=51) | 7.9 | -0.2 | 65.0 | 55.0 | -0.21 | 0.0 |
| Dulaglutide 1.5 mg once weekly (n=52) | 8.2 | -0.6 | 54.6 | 36.4 | -0.95 | 0.1 |
| Placebo/dulaglutide 0.75 mg once weeklye (n=51) | 8.1 | -0.1 | 50.0 | 29.4 | 0.24 | -0.2 |
# p<0.05, ##p<0.001 for superiority compared to placebo, adjusted p-values with overall type I error controlled.
‡ p<0.05, ‡‡p<0.001 for superiority compared to placebo.
a HbA1c value of 7.0% (DCCT) corresponds to 53.0 mmol/mol (IFCC) (average blood glucose: 8.6 mmol/L)
b HbA1c value of 6.5% (DCCT) corresponds to 47.5 mmol/mol (IFCC) (average blood glucose: 7.8 mmol/L)
c Combined results for Trulicity 0.75 mg and 1.5 mg. The comparison of the two doses together and individually with placebo was prespecified with overall type I error controlled.
d Efficacy estimates at the primary endpoint (26 weeks) are based on the treatment regimen estimand while estimates at the end of the open label extension (52 weeks) are based on the efficacy estimand.
e Patients assigned to placebo for the initial 26 week double-blind period started treatment with dulaglutide 0.75 mg once weekly for the follow-on 26 week open-label period.
Pharmacokinetic properties
Absorption
Following subcutaneous administration to patients with type 2 diabetes, dulaglutide reaches peak plasma concentrations in 48 hours. The mean peak (Cmax) and total (AUC) exposures were approximately 114 ng/ml and 14,000 ngh/ml, respectively, after multiple subcutaneous 1.5 mg doses of dulaglutide in patients with type 2 diabetes. Steady-state plasma concentrations were achieved between 2 to 4 weeks of once-weekly administration of dulaglutide (1.5 mg). Exposures after subcutaneous administration of single dulaglutide (1.5 mg) doses in the abdomen, thigh, or upper arm were comparable. The mean absolute bioavailability of dulaglutide following single-dose subcutaneous administration of single 1.5 mg and 0.75 mg doses was 47% and 65%, respectively. Absolute bioavailabilities for 3 mg and 4.5 mg doses were estimated to be similar to 1.5 mg although they have not been specifically studied. Over the dose range 0.75 mg to 4.5 mg, the increase in dulaglutide concentration is approximately proportional.
Distribution
The apparent population mean central volume of distribution was 3.09 L and the apparent population mean peripheral volume of distribution was 5.98 L.
Biotransformation
Dulaglutide is presumed to be degraded into its component amino acids by general protein catabolism pathways.
Elimination
Apparent population mean clearance of dulaglutide was 0.142 L/h. and the elimination half-life was approximately 5 days.
Special populations
Elderly
Age had no clinically relevant effect on the pharmacokinetic and pharmacodynamic properties of dulaglutide.
Gender and race
Gender and race had no clinically meaningful effect on the pharmacokinetics of dulaglutide.
Body weight or body mass index
Pharmacokinetic analyses have demonstrated a statistically significant inverse relationship between body weight or body mass index (BMI) and dulaglutide exposure, although there was no clinically relevant impact of weight or BMI on glycaemic control.
Renal impairment
The pharmacokinetics of dulaglutide were evaluated in a clinical pharmacology study and were generally similar between healthy subjects and patients with mild to severe renal impairment (CrCl <30 ml/min), including end stage renal disease (requiring dialysis). Additionally, in a 52 week clinical study in patients with type 2 diabetes and moderate to severe renal impairment (eGFR [by CKD-EPI] <60 and ≥15 mL/min/1.73 m²), the pharmacokinetic profile of Trulicity 0.75 mg and 1.5 mg once weekly was similar to that demonstrated in previous clinical studies. This clinical study did not include patients with end stage renal disease.
Hepatic impairment
The pharmacokinetics of dulaglutide were evaluated in a clinical pharmacology study, where subjects with hepatic impairment had statistically significant decreases in dulaglutide exposure of up to 30% to 33% for mean Cmax and AUC, respectively, compared to healthy controls. There was a general increase in tmax of dulaglutide with increased hepatic impairment. However, no trend in dulaglutide exposure was observed relative to the degree of hepatic impairment. These effects were not considered to be clinically relevant.
Paediatric population
A population pharmacokinetic analysis was conducted for dulaglutide 0.75 mg and 1.5 mg using data from 128 paediatric patients (10 to <18 years of age) with type 2 diabetes. The AUC in paediatric patients was approximately 37% lower than that in adult patients. However, this difference was not determined to be clinically meaningful.
Preclinical safety data
Non-clinical data reveal no special hazards for humans based on conventional studies of safety pharmacology or repeat-dose toxicity.
In a 6 month carcinogenicity study in transgenic mice, there was no tumorigenic response. In a 2 year carcinogenicity study in rats, at ≥3 times the human clinical exposure following 4.5 mg dulaglutide per week, dulaglutide caused statistically significant, dose-related increases in the incidence of thyroid C-cell tumours (adenomas and carcinomas combined). The clinical relevance of these findings is currently unknown.
During the fertility studies, a reduction in the number of corpora lutea and prolonged oestrous cycle were observed at dose levels that were associated with decreased food intake and body weight gain in maternal animals; however, no effects on indices of fertility and conception or embryonic development were observed. In reproductive toxicology studies, skeletal effects and a reduction in foetal growth were observed in the rat and rabbit at exposures of dulaglutide 5- to 18-fold higher than those proposed clinically, but no foetal malformations were observed. Treatment of rats throughout pregnancy and lactation produced memory deficits in female offspring at exposures that were 7-fold higher than those proposed clinically. Dulaglutide dosing of male and female juvenile rats did not produce memory deficits at 38-fold the highest human exposure.
© All content on this website, including data entry, data processing, decision support tools, "RxReasoner" logo and graphics, is the intellectual property of RxReasoner and is protected by copyright laws. Unauthorized reproduction or distribution of any part of this content without explicit written permission from RxReasoner is strictly prohibited. Any third-party content used on this site is acknowledged and utilized under fair use principles.