TUKYSA Film-coated tablet Ref.[10257] Active ingredients: Tucatinib
Source: FDA, National Drug Code (US) Revision Year: 2020
12.1. Mechanism of Action
Tucatinib is a tyrosine kinase inhibitor of HER2. In vitro, tucatinib inhibits phosphorylation of HER2 and HER3, resulting in inhibition of downstream MAPK and AKT signaling and cell proliferation, and showed anti-tumor activity in HER2 expressing tumor cells. In vivo, tucatinib inhibited the growth of HER2 expressing tumors. The combination of tucatinib and trastuzumab showed increased anti-tumor activity in vitro and in vivo compared to either drug alone.
12.2. Pharmacodynamics
Exposure Response Relationship
Tucatinib exposure-response relationships and the time course of pharmacodynamics response have not been fully characterized.
Cardiac Electrophysiology
No large mean increase in QTc (i.e., >20 ms) was detected following treatment with TUKYSA at the recommended dose of 300 mg taken orally twice daily.
12.3. Pharmacokinetics
Tucatinib AUC0-INF and Cmax increases proportionally over a dosage range from 50 mg to 300 mg (0.17 to 1 times the approved recommended dosage). Tucatinib exhibited 1.7-fold accumulation for AUC and 1.5-fold accumulation for Cmax following administration of TUKYSA 300 mg twice daily for 14 days. Time to steady state was approximately 4 days.
Absorption
The median time to peak plasma concentration of tucatinib was approximately 2 hours (range 1 to 4 hours).
Effects of Food
Following administration of a single oral dose of TUKYSA in 11 subjects after a high-fat meal (approximately 58% fat, 26% carbohydrate, and 16% protein), the mean AUC0-INF increased by 1.5-fold, the Tmax shifted from 1.5 hours to 4 hours, and Cmax was unaltered. The effect of food on the pharmacokinetics of tucatinib was not clinically meaningful.
Distribution
The geometric mean (CV%) apparent volume of distribution of tucatinib was approximately 1670 L (66%). The plasma protein binding was 97.1% at clinically relevant concentrations.
Elimination
The geometric mean (CV%) half-life of tucatinib was approximately 8.5 (21%) hours and apparent clearance was 148 L/h (55%).
Metabolism
Tucatinib is metabolized primarily by CYP2C8 and to a lesser extent via CYP3A.
Excretion
Following a single oral dose of 300 mg radiolabeled tucatinib, approximately 86% of the total radiolabeled dose was recovered in feces (16% of the administered dose as unchanged tucatinib) and 4.1% in urine with an overall total recovery of 90% within 13 days post-dose. In plasma, approximately 76% of the plasma radioactivity was unchanged, 19% was attributed to identified metabolites, and approximately 5% was unassigned.
Specific Populations
Age (<65 (n=211); ≥65 (n=27)), albumin (25 to 52 g/L), creatinine clearance (creatinine clearance [CLcr] 60 to 89 mL/min (n=89); CLcr 30 to 59 mL/min (n=5)), body weight (41 to 138 kg), and race (White (n=168), Black (n=53), or Asian (n=10)) did not have a clinically meaningful effect on tucatinib exposure.
Renal Impairment
No clinically significant differences in the pharmacokinetics of tucatinib were observed in patients with mild to moderate renal impairment (creatinine clearance: 30 to 89 mL/min by Cockcroft-Gault). The effect of severe renal impairment (creatinine clearance: <30 mL/min) on the pharmacokinetics of tucatinib is unknown.
Hepatic Impairment
Mild (Child-Pugh A) and moderate (Child-Pugh B) hepatic impairment had no clinically relevant effect on tucatinib exposure. Tucatinib AUC0-INF was increased by 1.6 fold in subjects with severe (Child-Pugh C) hepatic impairment compared to subjects with normal hepatic function.
Drug Interaction Studies
Clinical Studies
Table 7. Effect of Other Drugs on TUKYSA:
| Concomitant Drug (Dose) | TUKYSA Dose | Ratio (90% CI) of Tucatinib Exposure With and Without Concomitant Drug | |
|---|---|---|---|
| Cmax | AUC | ||
| Strong CYP3A Inhibitor Itraconazole (200 mg BID) | 300 mg single dose | 1.3 (1.2, 1.4) | 1.3 (1.3, 1.4) |
| Strong CYP3A/Moderate 2C8 Inducer Rifampin (600 mg once daily) | 0.6 (0.5, 0.8) | 0.5 (0.4, 0.6) | |
| Strong CYP2C8 Inhibitor Gemfibrozil (600 mg BID) | 1.6 (1.5, 1.8) | 3.0 (2.7, 3.5) | |
Table 8. Effect of TUKYSA on Other Drugs:
| Concomitant Drug (Dose) | TUKYSA Dose | Ratio (90% CI) of Exposure Measures of Concomitant Drug with/without Tucatinib | |
|---|---|---|---|
| Cmax | AUC | ||
| CYP2C8 Substrate Repaglinide (0.5 mg single dose) | 300 mg twice daily | 1.7 (1.4, 2.1) | 1.7 (1.5, 1.9) |
| CYP3A Substrate Midazolam (2 mg single dose) | 3.0 (2.6, 3.4) | 5.7 (5.0, 6.5) | |
| P-gp Substrate Digoxin (0.5 mg single dose) | 2.4 (1.9, 2.9) | 1.5 (1.3, 1.7) | |
| MATE1/2-K substratea Metformin (850 mg single dose) | 1.1 (1.0, 1.2) | 1.4 (1.2, 1.5) | |
a Tucatinib reduced the renal clearance of metformin without any effect on glomerular filtration rate (GFR) as measured by iohexol clearance and serum cystatin C.
No clinically significant difference in the pharmacokinetics of tucatinib were observed when used concomitantly with omeprazole (proton pump inhibitor) or tolbutamide (sensitive CYP2C9 substrate).
In Vitro Studies
Cytochrome P450 (CYP) Enzymes: Tucatinib is a reversible inhibitor of CYP2C8 and CYP3A and a time-dependent inhibitor of CYP3A, but is not an inhibitor of CYP1A2, CYP2B6, CYP2C9, CYP2C19, or CYP2D6.
Uridine diphosphate (UDP)-glucuronosyl transferase (UGT) Enzymes: Tucatinib is not an inhibitor of UGT1A1.
Transporter Systems: Tucatinib is a substrate of P-gp and BCRP, but is not a substrate of OAT1, OAT3, OCT1, OCT2, OATP1B1, OATP1B3, MATE1, MATE2-K, or BSEP.
Tucatinib inhibits MATE1/MATE2-K-mediated transport of metformin and OCT2/MATE1-mediated transport of creatinine. The observed serum creatinine increase in clinical studies with tucatinib is due to inhibition of tubular secretion of creatinine via OCT2 and MATE1.
13.1. Carcinogenesis, Mutagenesis, Impairment of Fertility
Carcinogenicity studies have not been conducted with tucatinib.
Tucatinib was not mutagenic in an in vitro bacterial reverse mutation (Ames) assay. Tucatinib was not clastogenic in either an in vitro chromosome aberration assay or an in vivo mouse bone marrow micronucleus assay.
Fertility studies in animals have not been conducted. In repeat-dose toxicity studies up to 13 weeks duration, decreased corpora lutea/corpus luteum cyst, increased interstitial cells of the ovary, atrophy of the uterus, and mucification of the vagina were observed in female rats at doses ≥6 mg/kg/day (approximately 0.1 times the human exposure at the recommended dose based on AUC). Atrophy and edema of the testes and oligospermia/germ cell debris in the epididymides were observed in male rats at ≥120 mg/kg/day (approximately 13 times the human exposure at the recommended dose based on AUC).
14. Clinical Studies
14.1 HER2-Positive Metastatic Breast Cancer
The efficacy of TUKYSA in combination with trastuzumab and capecitabine was evaluated in 612 patients in HER2CLIMB (NCT02614794), a randomized (2:1), double-blind, placebo-controlled trial. Patients were required to have HER2-positive, unresectable locally advanced or metastatic breast cancer, with or without brain metastases, and prior treatment with trastuzumab, pertuzumab, and ado-trastuzumab emtansine (T-DM1) separately or in combination, in the neoadjuvant, adjuvant or metastatic setting. HER2 positivity was based on archival or fresh tissue tested with an FDA-approved test at a central laboratory prior to enrollment with HER2 positivity defined as HER2 IHC 3+ or ISH positive.
Patients with brain metastases, including those with progressing or untreated lesions, were eligible provided they were neurologically stable and did not require immediate radiation or surgery. The trial excluded patients with leptomeningeal disease. Randomization was stratified by the presence or history of brain metastases (yes vs. no), Eastern Cooperative Oncology Group (ECOG) performance status (0 vs. 1), and region (U.S., Canada, or rest of world).
Patients received TUKYSA 300 mg or placebo orally twice daily with a trastuzumab loading dose of 8 mg/kg on Day 1 of Cycle 1 if needed and then a maintenance dose of 6 mg/kg on Day 1 of every 21-day cycle thereafter and capecitabine 1000 mg/m² orally twice daily on Days 1 through 14 of every 21-day cycle. An alternate trastuzumab dosing regimen was 600 mg administered subcutaneously on Day 1 of every 21-day cycle. Patients were treated until disease progression or unacceptable toxicity. Tumor assessments, including brain-MRI in patients with presence or history of brain metastases at baseline, occurred every 6 weeks for the first 24 weeks and every 9 weeks thereafter.
The major efficacy outcome measure was progression-free survival (PFS) in the first 480 randomized patients assessed by blinded independent central review (BICR) using Response Evaluation Criteria in Solid Tumors (RECIST) v1.1. Additional efficacy outcome measures were evaluated in all randomized patients and included overall survival (OS), PFS among patients with a history or presence of brain metastases (PFSBrainMets), and confirmed objective response rate (ORR).
The median age was 54 years (range: 22-82); 116 (19%) patients were age 65 or older. The majority were White (73%) and female (99%) and 51% had an ECOG performance status of 1. Sixty percent had estrogen and/or progesterone receptor-positive disease. Forty-eight percent had a presence or history of brain metastases; of these patients, 23% had untreated brain metastases, 40% had treated but stable brain metastases, and 37% had treated but radiographically progressing brain metastases. Seventy-four percent of patients had visceral metastases. Patients had received a median of 4 (range, 2 to 17) prior lines of systemic therapy and a median of 3 (range, 1 to 14) prior lines of systemic therapy in the metastatic setting. All patients received prior trastuzumab and T-DM1 and all but two patients had prior pertuzumab.
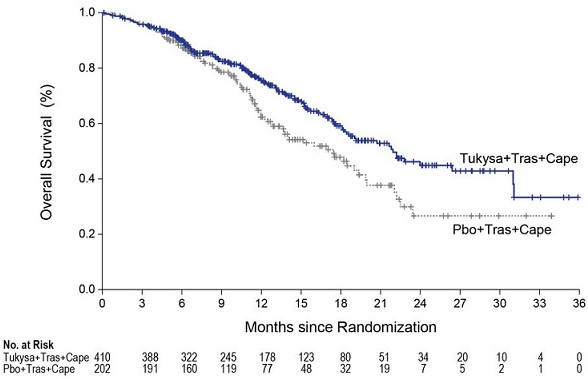
Efficacy results are summarized in Table 9 and Figure 1 and 2. Efficacy results were consistent across patient subgroups defined by stratification factors (presence or history of brain metastases, ECOG status, region of world) and hormone receptor status.
Table 9. Efficacy Results in HER2CLIMB:
| TUKYSA + Trastuzumab + Capecitabine | Placebo + Trastuzumab + Capecitabine | ||
|---|---|---|---|
| PFS1 | N=320 | N=160 | |
| Number of events (%) | 178 (56) | 97 (61) | |
| Median, months (95% CI) | 7.8 (7.5, 9.6) | 5.6 (4.2, 7.1) | |
| Hazard ratio (95% CI)2 | 0.54 (0.42, 0.71) | ||
| P-value3 | <0.00001 | ||
| OS | N=410 | N=202 | |
| Number of deaths (%) | 130 (32) | 85 (42) | |
| Median, months (95% CI) | 21.9 (18.3, 31.0) | 17.4 (13.6, 19.9) | |
| Hazard ratio (95% CI)2 | 0.66 (0.50, 0.87) | ||
| P-value4 | 0.00480 | ||
| PFSBrainMets5 | N=198 | N=93 | |
| Number of events (%) | 106 (53.5) | 51 (54.8) | |
| Median, months (95% CI) | 7.6 (6.2, 9.5) | 5.4 (4.1, 5.7) | |
| Hazard ratio (95% CI)2 | 0.48 (0.34, 0.69) | ||
| P-value6 | <0.00001 | ||
| Confirmed ORR for Patients with Measurable Disease | N=340 | N=171 | |
| ORR (95% CI)7 | 40.6 (35.3, 46.0) | 22.8 (16.7, 29.8) | |
| CR (%) | 3 (0.9) | 2 (1.2) | |
| PR (%) | 135 (39.7) | 37 (21.6) | |
| P-value3 | 0.00008 | ||
| DOR | |||
| Median, months (95% CI)8 | 8.3 (6.2, 9.7) | 6.3 (5.8, 8.9) | |
BICR=blinded independent central review; CI=confidence interval; PFS=progression-free survival; OS=overall survival; ORR=objective response rate; CR=complete response; PR=partial response; DOR=duration of response.
1 Primary PFS analysis conducted in first 480 randomized patients.
2 Hazard ratio and 95% confidence intervals are based on stratified Cox proportional hazards regression model controlling for stratification factors (presence or history of brain metastases, ECOG status, and region of world)
3 Two-sided p-value based on re-randomization procedure (Rosenberger and Lachin 2002) controlling for stratification factors, compared with the allocated alpha of 0.05
4 Two-sided p-value based on re-randomization procedure (Rosenberger and Lachin 2002) controlling for stratification factors, compared with the allocated alpha of 0.0074 for this interim analysis (with 60% of the planned number of events for final analysis)
5 Analysis includes patients with history or presence of parenchymal brain metastases at baseline, including target and non-target lesions. Does not include patients with dural lesions only.
6 Two-sided p-value based on re-randomization procedure (Rosenberger and Lachin 2002) controlling for stratification factors, compared with the allocated alpha of 0.0080 for this interim analysis (with 71% of the planned number of events for final analysis)
7 Two-sided 95% exact confidence interval, computed using the Clopper-Pearson method (1934)
8 Calculated using the complementary log-log transformation method (Collett, 1994)
Figure 1. Kaplan-Meier Curve of PFS per BICR in HER2CLIMB:
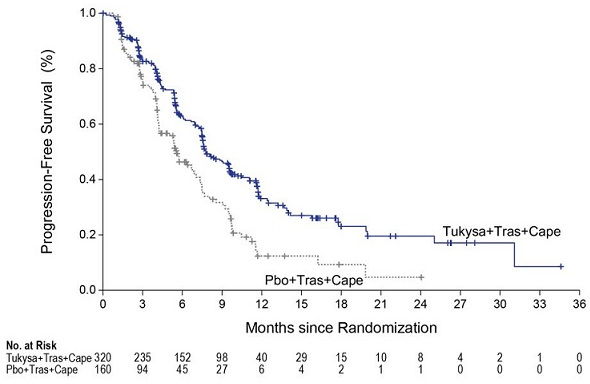
Figure 2. Kaplan-Meier Curve of Overall Survival in HER2CLIMB:
© All content on this website, including data entry, data processing, decision support tools, "RxReasoner" logo and graphics, is the intellectual property of RxReasoner and is protected by copyright laws. Unauthorized reproduction or distribution of any part of this content without explicit written permission from RxReasoner is strictly prohibited. Any third-party content used on this site is acknowledged and utilized under fair use principles.