TYBOST Film-coated tablet Ref.[27447] Active ingredients: Cobicistat
Source: FDA, National Drug Code (US) Revision Year: 2021
12.1. Mechanism of Action
Cobicistat is a mechanism-based inhibitor of cytochrome P450 3A (CYP3A). Inhibition of CYP3A-mediated metabolism by cobicistat increases the systemic exposure of CYP3A substrates atazanavir and darunavir.
12.2. Pharmacodynamics
Effects on Pharmacokinetic Enhancement
The effect of TYBOST on atazanavir pharmacokinetics was evaluated in the pharmacokinetic substudy (N=48) of Trial 114 in which HIV-1 infected subjects received atazanavir 300 mg coadministered with TYBOST 150 mg or atazanavir 300 mg coadministered with ritonavir 100 mg, both in combination with TRUVADA. The steady-state pharmacokinetic parameters of atazanavir were comparable when coadministered with TYBOST versus ritonavir groups as shown in Table 7 [see Clinical Studies (14.1)].
Table 7. Pharmacokinetic Parameters (Mean ± SD) of Atazanavir in HIV-1 Infected Treatment-Naïve Adults (Pharmacokinetic Substudy of Trial 114):
| TYBOST + Atazanavir + TRUVADA Once Daily | Ritonavir + Atazanavir + TRUVADA Once Daily | |
|---|---|---|
| Atazanavir Pharmacokinetic Parameters | N=22 | N=26 |
| AUCtau (mcg∙hr/mL) | 46.13 ± 26.18 | 47.59 ± 24.38 |
| Cmax (mcg/mL) | 3.91 ± 1.94 | 4.76 ± 1.94 |
| Ctau (mcg/mL) | 0.80 ± 0.72 | 0.85 ± 0.72 |
The effect of TYBOST on darunavir was evaluated in a clinical study (Trial 115) in 31 healthy subjects who received darunavir 800 mg in combination with TYBOST 150 mg or ritonavir 100 mg, all once daily, for 10 days. With the exception of Ctau, the steady-state pharmacokinetic parameters of darunavir were comparable when coadministered with TYBOST versus ritonavir as shown in Table 8, and these results were similar to those reported in previous clinical trials of darunavir 800 mg with ritonavir 100 mg once daily (refer to prescribing information for darunavir).
Table 8. Pharmacokinetic Parameters (Mean ± SD) of Darunavir in Healthy Adults (Trial 115):
| TYBOST + Darunavir Once Daily | Ritonavir + Darunavir Once Daily | |
|---|---|---|
| Darunavir Pharmacokinetic Parameters | N=31 | N=31 |
| AUCtau (mcg∙hr/mL) | 81.08 ± 25.15 | 79.99 ± 27.20 |
| Cmax (mcg/mL) | 7.74 ± 1.69 | 7.46 ± 1.52 |
| C0h (mcg/mL) | 2.40 ± 1.22 | 2.48 ± 0.85 |
| Ctau (mcg/mL) | 1.33 ± 0.89 | 1.87 ± 1.56 |
Cardiac Electrophysiology
In a thorough QT/QTc study in 48 healthy subjects, a single dose of cobicistat 250 mg and 400 mg (1.67 and 2.67 times the dose in TYBOST) did not affect the QT/QTc interval. Prolongation of the PR interval was noted in subjects receiving cobicistat. The maximum mean (95% upper confidence bound) difference in PR from placebo after baseline-correction was 9.5 (12.1) msec for the 250 mg cobicistat dose and 20.2 (22.8) for the 400 mg cobicistat dose.
Effects on Serum Creatinine
The effect of TYBOST on serum creatinine was investigated in a trial in subjects with normal renal function (eGFR ≥80 mL/min, N=12) and mild-to-moderate renal impairment (eGFR 50–79 mL/min, N=18). A statistically significant decrease in the estimated glomerular filtration rate, calculated by Cockcroft-Gault method (eGFRCG) from baseline, was observed after 7 days of treatment with cobicistat 150 mg among subjects with normal renal function (−9.9 ± 13.1 mL/min) and mild-to-moderate renal impairment (−11.9 ± 7.0 mL/min). No statistically significant changes in eGFRCG were observed compared to baseline for subjects with normal renal function or mild-to-moderate renal impairment 7 days after cobicistat was discontinued. The actual glomerular filtration rate, as determined by the clearance of probe drug iohexol, was not altered from baseline following treatment with TYBOST among subjects with normal renal function and mild-to-moderate renal impairment, indicating that cobicistat inhibits tubular secretion of creatinine, reflected as a reduction in eGFRCG, without affecting the actual glomerular filtration rate [see Warnings and Precautions (5.1)].
12.3. Pharmacokinetics
Absorption
In a trial where subjects were instructed to take coadministered TYBOST and darunavir with food, median cobicistat peak plasma concentrations were observed approximately 3.5 hours postdose. Steady-state cobicistat Cmax, AUCtau, and Ctau (mean ± SD) values were 0.99 ± 0.3 mcg/mL (n=60), 7.6 ± 3.7 mcg∙hr/mL (n=59), and 0.03 ± 0.1 mcg/mL (n=59), respectively.
Effect of Food on Oral Absorption
A food-effect trial was not conducted for TYBOST. In clinical trials, TYBOST was coadministered with other antiretroviral agents [see Clinical Studies (14.1)] under fed conditions, in accordance with the prescribing information for these agents. It is recommended that TYBOST coadministered with atazanavir or darunavir be administered with food [see Dosage and Administration (2.1, 2.2)].
Distribution
Cobicistat is 97–98% bound to human plasma proteins and the mean blood-to-plasma ratio was approximately 0.5.
Metabolism
Cobicistat is metabolized by CYP3A and to a minor extent by CYP2D6 enzymes and does not undergo glucuronidation.
Elimination
The terminal plasma half-life of cobicistat following administration of TYBOST is approximately 3 to 4 hours. With single dose administration of [ 14C] cobicistat after multiple dosing of cobicistat for 6 days, the mean percent of the administered dose excreted in feces and urine was 86.2% and 8.2%, respectively.
Specific Populations
Race and Gender
No clinically relevant differences in the pharmacokinetics of cobicistat were observed based on race or gender.
Pediatric Patients
In pediatric subjects aged 12 to less than 18 years who received TYBOST 150 mg coadministered with atazanavir 300 mg (N=12), geometric mean atazanavir Cmax and AUCtau and cobicistat AUCtau values were approximately 20–30% higher than in adults and geometric mean atazanavir and cobicistat Ctau values were approximately 60% to 160% higher than in adults; the increases were not considered clinically significant. In pediatric subjects aged 12 to less than 18 years who received TYBOST 150 mg coadministered with darunavir 800 mg (N=7), geometric mean darunavir Cmax and AUCtau values were similar between adults and adolescents. Geometric mean darunavir AUCtau and Ctau values were 15% and 32% lower, with geometric mean ratios of 0.85 (90% CI: 0.64, 1.13) and 0.68 (90% CI: 0.30, 1.55) in adolescent subjects relative to adults, respectively. This difference was not considered clinically significant based on exposure-response relationships. Geometric mean cobicistat AUCtau, Cmax, and Ctau values were comparable in adolescents and adults (Table 9).
Table 9. Multiple-Dose PK Parameters of Cobicistat, Atazanavir, and Darunavir Following Administration of TYBOST with Atazanavir or Darunavir in HIV-1 Infected Pediatric Subjects Weighing at Least 35 kg*:
| Parameter Geometric Mean (CV%) | Cobicistat | Atazanavir | Darunavir | |
|---|---|---|---|---|
| Treatment Administered | TYBOST + Atazanavir | TYBOST + Darunavir | TYBOST + Atazanavir | TYBOST + Darunavir |
| Pediatric Subjects* | N=12 | N=7 | N=12 | N=7 |
| AUCtau (mcg∙hr/mL) | 12.11 (44.7) | 8.33 (34.9) | 49.48 (49.1) | 77.22 (29.5) |
| Cmax (mcg/mL) | 1.28 (31.7) | 1.10 (20.0) | 4.32 (49.9) | 7.32 (21.7) |
| Ctau (mcg/mL) | 0.09 (156.2) | 0.02 (123.9)† | 0.91 (96.4) | 0.68 (91.6) |
| Adults‡,§ | N=30‡ | N=21§ | N=30‡ | N=21§ |
| AUCtau (mcg∙hr/mL) | 9.65 (41.8) | 7.69 (43.9) | 39.96 (52.1) | 90.56 (45.3) |
| Cmax (mcg/mL) | 1.28 (35.6) | 1.04 (35.3) | 3.54 (45.8) | 8.34 (33.3) |
| Ctau (mcg/mL) | 0.04 (112.7) | 0.02 (135.1)¶ | 0.58 (84.7) | 1.00 (108.0) |
CV=Coefficient of Variation
* From Intensive PK analysis of Trial 128.
† N=5; Data from two subjects who had undetectable TYBOST Ctau concentrations were excluded from summary statistics.
‡ From pooled Intensive PK analysis of trials with TYBOST + atazanavir.
§ From Intensive PK analysis of Trial GS-US-299-0102 with TYBOST + darunavir.
¶ N=18.
Patients with Renal Impairment
No clinically relevant differences in cobicistat pharmacokinetics were observed between subjects with severe renal impairment (estimated creatinine clearance below 30 mL/min) and healthy subjects [see Use in Specific Populations (8.6)].
Patients with Hepatic Impairment
No clinically relevant differences in cobicistat pharmacokinetics were observed between subjects with moderate hepatic impairment (Child-Pugh Class B) and healthy subjects. The effect of severe hepatic impairment (Child-Pugh Class C) on the pharmacokinetics of cobicistat has not been studied [see Use in Specific Populations (8.7)].
Pregnancy and Postpartum
The exposure to total and unbound darunavir boosted with cobicistat after intake of darunavir/cobicistat as part of an antiretroviral regimen was substantially lower during the second and third trimesters of pregnancy compared with 6–12 weeks postpartum (see Table 10 and Figure 1).
Table 10. Pharmacokinetic Results of Total Darunavir after Administration of Darunavir/Cobicistat Once Daily as Part of an Antiretroviral Regimen, During the 2nd Trimester of Pregnancy, the 3 rd Trimester of Pregnancy, and Postpartum:
| Pharmacokinetics of total darunavir (mean ± SD) | 2nd Trimester of pregnancy N=7 | 3rd Trimester of pregnancy N=6 | Postpartum (6–12 weeks) N=6 |
|---|---|---|---|
| Cmax, ng/mL | 4,340 ± 1,616 | 4,910 ± 970 | 7,918 ± 2,199 |
| AUC24h, ng.h/mL | 47,293 ± 19,058 | 47,991 ± 9,879 | 99,613 ± 34,862 |
| Cmin, ng/mL | 168 ± 149 | 184 ± 99 | 1,538 ± 1,344 |
Figure 1. Pharmacokinetic Results (Within-Subject Comparison) of Total and Unbound Darunavir and Total Cobicistat After Administration of Darunavir/Cobicistat at 800/150 mg Once Daily as Part of an Antiretroviral Regimen, During the 2nd and 3rd Trimester of Pregnancy Compared to Postpartum:
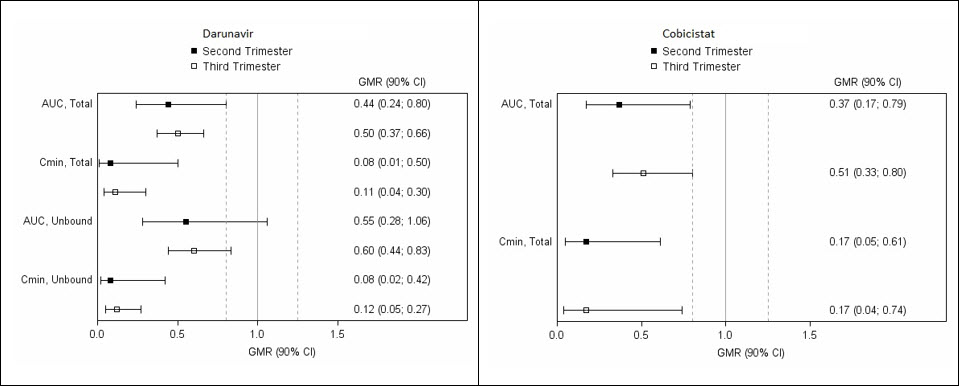
Legend: 90% CI: 90% confidence interval; GMR: geometric mean ratio (i.e. second or third trimester/postpartum). Solid vertical line: ratio of 1.0; dotted vertical lines: reference lines of 0.8 and 1.25.
Assessment of Drug Interactions
Drug interaction trials were conducted with TYBOST (as a single entity) and desipramine, digoxin, and efavirenz. Drug interaction trials of TYBOST coadministered with atazanavir or darunavir included atorvastatin, drospirenone/ethinyl estradiol, and rosuvastatin. Drug interaction trials of TYBOST coadministered with elvitegravir included rosuvastatin and rifabutin.
The effects of cobicistat on the exposure of coadministered drugs are shown in Table 11.
Table 11. Drug Interactions: Changes in Pharmacokinetic Parameters for Coadministered Drugs in the Presence of Cobicistat*:
Note: The information listed below is not a comprehensive list of all the available drug interaction data for concomitant medications with cobicistat containing regimens. Please refer to the U.S. prescribing information for antiretroviral medications administered in combination with cobicistat for additional drug interaction information.
| Coadministered Drug | Dose of Coadministered Drug (mg) | TYBOST Dose (mg) | N | Mean Ratio of Coadministered Drug Pharmacokinetic Parameters (90% CI); No effect = 1.00 | |
|---|---|---|---|---|---|
| Cmax | AUC | ||||
| Atorvastatin | 10 single dose | 150 once daily | 16 | 18.85† (13.53, 26.27) | 9.22† (7.58, 11.22) |
| 4.19‡ (3.67, 4.78) | 3.90‡ (3.52, 4.32) | ||||
| Desipramine | 50 single dose | 150 once daily | 8 | 1.24 (1.08, 1.44) | 1.65 (1.36, 2.02) |
| Digoxin | 0.5 single dose | 150 once daily | 22 | 1.41 (1.29, 1.55) | 1.08 (1.00, 1.17) |
| Drospirenone/ ethinyl estradiol | 3 drospirenone single dose | 150 once daily | 14 | 1.12† (1.05, 1.19) | 2.30† (2.00, 2.64) |
| 0.02 ethinyl estradiol single dose | 0.82† (0.76, 0.89) | 0.78† (0.73, 0.85) | |||
| 3 drospirenone single dose | 150 once daily | 15 | 1.15‡ (1.05, 1.26) | 1.58‡ (1.47, 1.71) | |
| 0.02 ethinyl estradiol single dose | 0.86‡ (0.77, 0.95) | 0.70‡ (0.63, 0.77) | |||
| Efavirenz | 600 single dose | 150 once daily | 17 | 0.87 (0.80, 0.94) | 0.93 (0.89, 0.97) |
| Rosuvastatin | 10 single dose | 150 once daily | 16 | 10.58† (8.72, 12.83) | 3.42† (2.87, 4.07) |
| 3.77‡ (3.29, 4.32) | 1.93‡ (1.70, 2.20) | ||||
* All interaction studies conducted in healthy subjects.
† Study conducted in the presence of 300 mg atazanavir.
‡ Study conducted in the presence of 800 mg darunavir.
12.4. Microbiology
Antiviral Activity
Cobicistat does not inhibit recombinant HIV-1 protease in a biochemical assay and has no detectable antiviral activity in cell culture against HIV-1, HBV, or HCV. The antiviral activity in cell culture of selected HIV-1 antiretroviral drugs was not antagonized by cobicistat.
Resistance
In an analysis of treatment-failure adult subjects who received TYBOST coadministered with atazanavir and TRUVADA in Trial 114 through Week 144, evaluable genotypic data from paired baseline and treatment-failure isolates from subjects who had HIV-1 RNA greater than or equal to 400 copies/mL were available for all 21 virologic failures in the TYBOST group (6%, 21/344). Among the 21 subjects, 3 developed the emtricitabine resistance-associated substitution M184V. No subject developed the tenofovir resistance-associated substitution K65R or K70E, or any primary resistance substitution associated with protease inhibitors. In the ritonavir group, evaluable genotypic data were available for all 19 virologic failures (5%, 19/348). Among the 19 patients, 1 developed the emtricitabine resistance-associated substitution M184V with no tenofovir or protease inhibitor resistance-associated substitutions.
In an as-treated analysis of pediatric subjects between the ages of 12 to less than 18 years who received TYBOST coadministered with atazanavir or darunavir plus two NRTIs in Trial 128, 3 of 20 subjects qualified for resistance analysis through Week 48; all 3 subjects were receiving TYBOST coadministered with atazanavir and 1 had evaluable data and no significant resistance-associated substitutions in protease or reverse transcriptase [see Clinical Studies (14.2)].
13.1. Carcinogenesis, Mutagenesis, Impairment of Fertility
Carcinogenesis
In a long-term carcinogenicity study in mice, no drug-related increases in tumor incidence were observed at doses up to 50 and 100 mg/kg/day (males and females, respectively). Cobicistat exposures at these doses were approximately 7 (male) and 16 (females) times, respectively, the human systemic exposure at the therapeutic daily dose. In a long-term carcinogenicity study of cobicistat in rats, an increased incidence of follicular cell adenomas and/or carcinomas in the thyroid gland was observed at doses of 25 and 50 mg/kg/day in males, and at 30 mg/kg/day in females. The follicular cell findings are considered to be rat-specific, secondary to hepatic microsomal enzyme induction and thyroid hormone imbalance, and are not relevant for humans. At the highest doses tested in the rat carcinogenicity study, systemic exposures were approximately 2 times the human systemic exposure at the therapeutic daily dose.
Mutagenesis
Cobicistat was not genotoxic in the reverse mutation bacterial test (Ames test), mouse lymphoma, or rat micronucleus assays.
Impairment of Fertility
Cobicistat did not affect fertility in male or female rats at daily exposures (AUC) approximately 3-fold higher than human exposures at the recommended 150 mg daily dose.
Fertility was normal in the offspring of rats exposed daily from before birth (in utero) through sexual maturity at daily exposures (AUC) of approximately similar human exposures at the recommended 150 mg daily dose.
14. Clinical Studies
14.1 Clinical Trial Results in HIV-1 Infected Treatment-Naïve Adult Subjects – Trial 114
The activity of TYBOST as a CYP3A inhibitor to increase the systemic exposures of atazanavir or darunavir has been demonstrated in pharmacokinetic trials. In these trials, the exposure of atazanavir or darunavir coadministered with TYBOST 150 mg was consistent with those observed with ritonavir 100 mg [see Clinical Pharmacology (12.2)]. For clinical efficacy of darunavir/ritonavir 800/100 mg once daily, refer to the prescribing information for darunavir.
The safety and efficacy of TYBOST coadministered with atazanavir were evaluated in a randomized, double-blind, active-controlled trial (Trial 114) in HIV-1 infected treatment-naïve subjects with baseline estimated creatinine clearance above 70 mL/min (N=692). In Trial 114, subjects were randomized in a 1:1 ratio to receive either atazanavir 300 mg + TYBOST 150 mg once daily or atazanavir 300 mg + ritonavir 100 mg once daily. All subjects received concomitant treatment with 300 mg of TDF and 200 mg of emtricitabine once a day administered as single tablet TRUVADA. Randomization was stratified by screening HIV-1 RNA level (≤100,000 copies/mL or >100,000 copies/mL).
The mean age of subjects was 37 years (range 19–70); 83% were male, 60% were White, 18% were Black, and 12% were Asian. The mean baseline plasma HIV-1 RNA was 4.8 log10 copies/mL (range 3.2–6.4). Forty percent of patients had baseline viral loads >100,000 copies/mL. The mean baseline CD4+ cell count was 352 cells/mm³ (range 1–1455) and 17% had CD4+ cell counts ≤200 cells/mm³.
Virologic outcomes in Trial 114 through Week 144 are presented in Table 12. In Trial 114, the mean increase from baseline in CD4+ cell count at Week 144 was 281 cells/mm³ in the TYBOST group and 297 cells/mm³ in the ritonavir group.
Table 12. Virologic Outcome of Randomized Treatment of Trial 114 in HIV-1 Infected Treatment Naïve Adults at Week 144*:
| TYBOST + Atazanavir + TRUVADA (N=344) | Ritonavir + Atazanavir + TRUVADA (N=348) | |
|---|---|---|
| HIV-1 RNA <50 copies/mL | 72% | 74% |
| Treatment Difference | −2.1% (95% CI = −8.7%, 4.5%) | |
| HIV RNA ≥50 copies/mL† | 8% | 5% |
| No Virologic Data at Week 144 Window | 20% | 21% |
| Discontinued Study Drug Due to AE or Death‡ | 11% | 11% |
| Discontinued Study Drug Due to Other Reasons and Last Available HIV-1 RNA <50 copies/mL§ | 8% | 10% |
| Missing Data During Window but on Study Drug | <1% | <1% |
* Week 144 window was between Day 967 and 1050 (inclusive).
† Included subjects who had ≥50 copies/mL in the Week 144 window; subjects who discontinued early due to lack or loss of efficacy; subjects who discontinued for reasons other than an adverse event (AE), death, or lack or loss of efficacy and at the time of discontinuation had a viral value of ≥50 copies/mL.
‡ Includes subjects who discontinued due to AE or death at any time point from Day 1 through the time window if this resulted in no virologic data on treatment during the specified window.
§ Includes subjects who discontinued for reasons other than an AE, death, or lack or loss of efficacy; e.g., withdrew consent, lost to follow-up, etc.
14.2 Clinical Trial Results in HIV-1 Infected Virologically Suppressed Pediatric Subjects – Trial 128
Trial 128 was a Phase ⅔ multicenter, open-label trial to evaluate the pharmacokinetics, safety, and efficacy of TYBOST coadministered with atazanavir or darunavir in HIV-1 infected virologically suppressed pediatric subjects ages 12 years and older with baseline estimated creatinine clearance ≥90 mL/min/1.73 m². Subjects were on a stable antiretroviral regimen (for at least 3 months), consisting of atazanavir or darunavir, both administered with ritonavir, combined with 2 nucleotide reverse transcriptase inhibitors (NRTIs). They were switched from ritonavir to TYBOST 150 mg once daily and continued atazanavir (N=14) or darunavir once daily (N=7) and 2 NRTIs.
The mean age of subjects was 14 years (range 12–17 years); median weight was 55 kg; 62% were male, 38% were Asian, 33% were White, 19% were Black, and 67% were not Hispanic or Latino. At baseline, 20/21 subjects had plasma HIV-1 RNA <50 copies/mL and 1 subject had plasma HIV-1 RNA of 50 copies/mL.
In subjects who switched to TYBOST coadministered with atazanavir, 93% (13/14) of subjects remained suppressed (HIV-1 RNA <50 copies/mL), and 1 subject experienced virologic failure at Week 48. From a median baseline CD4+ cell count and CD4+% of 770 cells/mm³ (range 486 to 1765 cells/mm³) and 33% (range 23% to 45%), respectively, the median change from baseline in CD4+ cell count and CD4+% at Week 48 was -60 cells/mm³ (range -500 to 705 cells/mm³) and -0.3% (range -6% to 8%), respectively.
In subjects who switched to TYBOST coadministered with darunavir, 86% (6/7) of subjects remained suppressed (HIV-1 RNA <50 copies/mL), and 1 subject had missing data at Week 48. From a median baseline CD4+ cell count and CD4+% of 1117 cells/mm³ (range 658 to 2416 cells/mm³) and 45% (range 28% to 56%), respectively, the median change from baseline in CD4+ cell count and CD4+% at Week 48 was -342 cells/mm³ (range -1389 to 219 cells/mm³) and -6% (range -12% to 5%), respectively. All 6 subjects with available data had CD4+ cell counts above 800 cells/mm³ at Week 48.
© All content on this website, including data entry, data processing, decision support tools, "RxReasoner" logo and graphics, is the intellectual property of RxReasoner and is protected by copyright laws. Unauthorized reproduction or distribution of any part of this content without explicit written permission from RxReasoner is strictly prohibited. Any third-party content used on this site is acknowledged and utilized under fair use principles.