VABYSMO Solution for injection Ref.[50239] Active ingredients: Faricimab
Source: European Medicines Agency (EU) Revision Year: 2024 Publisher: Roche Registration GmbH, Emil-Barell-Strasse 1, 79639 Grenzach-Wyhlen, Germany
5.1. Pharmacodynamic properties
Pharmacotherapeutic group: Ophthalmologicals, antineovascularisation agents
ATC code: S01LA09
Mechanism of action
Faricimab is a humanised bispecific immunoglobulin G1 (IgG1) antibody that acts through inhibition of two distinct pathways by neutralisation of both angiopoietin-2 (Ang-2) and vascular endothelial growth factor A (VEGF-A).
Ang-2 causes vascular instability by promoting endothelial destabilisation, pericyte loss, and pathological angiogenesis, thus potentiating vascular leakage and inflammation. It also sensitises blood vessels to the activity of VEGF-A resulting in further vascular destabilisation. Ang-2 and VEGF-A synergistically increase vascular permeability and stimulate neovascularisation.
By dual inhibition of Ang-2 and VEGF-A, faricimab reduces vascular permeability and inflammation, inhibits pathological angiogenesis and restores vascular stability.
Pharmacodynamic effects
A suppression from baseline of median ocular free Ang-2 and free VEGF-A concentrations was observed from day 7 onwards in the six Phase III studies described hereafter.
nAMD
In TENAYA and LUCERNE, objective, pre-specified visual and anatomic criteria, as well as treating physician clinical assessment, were used to guide treatment decisions at the disease activity assessment time points (week 20 and week 24).
The mean central subfield thickness (CST) reduction from baseline at the primary endpoint visits (averaged at weeks 40-48) was comparable to those observed with aflibercept, with -137 μm and -137 μm in patients treated with faricimab dosed up to every 16 weeks (Q16W) as compared to -129 μm and -131 μm with aflibercept, in TENAYA and LUCERNE, respectively. These mean CST reductions were maintained through year 2.
At week 48, in both studies there was a comparable effect of faricimab and aflibercept on the reduction of intraretinal fluid (IRF), subretinal fluid (SRF), and PED. These effects in IRF, SRF, and PED were maintained at year 2. There were also comparable changes in total CNV lesion area and reductions in CNV leakage area from baseline for patients in the faricimab and aflibercept treatment arms.
DME
In YOSEMITE and RHINE, anatomic parameters related to macular oedema were part of the disease activity assessments guiding treatment decisions.
The mean CST reduction from baseline at the primary endpoint visits (averaged at weeks 48-56) was numerically greater than those observed with aflibercept, with -207 μm and -197 μm in patients treated with faricimab Q8W and faricimab up to Q16W adjustable dosing as compared to -170 μm in aflibercept Q8W patients in YOSEMITE; results were 196 μm, 188 μm, and 170 μm, respectively in RHINE. Consistent reductions in CST were observed through year 2. Greater proportions of patients in both faricimab arms achieved absence of IRF and absence of DME (defined as reaching CST below 325 μm) over time through year 2 as compared to aflibercept in both studies.
RVO
In Phase III studies in patients with branch retinal vein occlusion (BRVO; BALATON) and central/hemiretinal vein occlusion (C/HRVO; COMINO), reductions in mean CST were observed from baseline to week 24 with faricimab Q4W and were comparable to those seen with aflibercept Q4W. The mean CST reduction from baseline to week 24 was 311.4 μm for faricimab Q4W versus 304.4 μm for aflibercept Q4W, in BALATON, and 461.6 μm versus 448.8 μm in COMINO for faricimab and aflibercept, respectively. CST reductions were maintained through week 72 when patients moved to a faricimab up to Q16W adjustable dosing regimen.
Comparable proportions of patients in both faricimab Q4W and aflibercept Q4W arms achieved absence of IRF, absence of SRF, and absence of macular edema (defined as reaching CST below 325 μm) over time through week 24, in both studies. These results were maintained through week 72 when patients moved to a faricimab up to Q16W adjustable dosing regimen.
Clinical efficacy and safety
nAMD
The safety and efficacy of faricimab were assessed in two randomised, multi-centre, double-masked, active comparator-controlled, 2-year non-inferiority studies in patients with nAMD, TENAYA and LUCERNE. A total of 1 329 patients were enrolled, with 1 135 (85%) patients completing the studies through week 112. A total of 1 326 patients received at least one dose (664 with faricimab). Patient ages ranged from 50 to 99 years with a mean [standard deviation; SD] of 75.9 [8.6] years.
In both studies, patients were randomised in a 1:1 ratio to one of two treatment arms:
- Faricimab 6 mg up to Q16W after four initial monthly doses
- Aflibercept 2 mg Q8W after three initial monthly doses
After the first four monthly doses (weeks 0, 4, 8, and 12) patients randomised to the faricimab arm received Q16W, every 12 weeks (Q12W) or Q8W dosing based on an assessment of disease activity at weeks 20 and 24. Disease activity was assessed using objective pre-specified visual (BCVA) and anatomic (CST) criteria, as well as treating physician clinical assessment of the presence of macular haemorrhage or nAMD disease activity requiring treatment (week 24 only). Patients remained on these fixed dosing intervals until week 60 without supplemental therapy. From week 60 onwards, patients in the faricimab arm moved to an adjustable dosing regimen, where their treatment interval could be modified by up to 4 week interval extensions (up to Q16W) or reduced by up to 8 week intervals (up to Q8W) based on an automated objective assessment of pre-specified visual (BCVA) and anatomic (CST and macular haemorrhage) disease activity criteria. Patients in the aflibercept arm remained on Q8W dosing throughout the study period. Both studies were 112 weeks in duration.
Results
Both studies showed efficacy in the primary endpoint, defined as the mean change from baseline in BCVA when averaged over the week 40, 44, and 48 visits and measured by the Early Treatment Diabetic Retinopathy Study (ETDRS) letter score (Table 2 and Table 3). In both studies, faricimab up to Q16W treated patients had a non-inferior mean change from baseline in BCVA, as the patients treated with aflibercept Q8W at year 1, and these vision gains were maintained through week 112. Improvements from baseline BCVA at week 112 are shown in Figure 1.
The proportion of patients on each of the different treatment intervals at week 112 in TENAYA and LUCERNE, respectively was:
- Q16W: 59% and 67%
- Q12W: 15% and 14%
- Q8W: 26% and 19%
Table 2. Efficacy outcomes at the primary endpoint visitsa and at year 2b in TENAYA:
| Efficacy Outcomes | TENAYA | |||
|---|---|---|---|---|
| Year 1 | Year 2 | |||
| Faricimab up to Q16W N=334 | Aflibercept Q8W N=337 | Faricimab up to Q16W N=334 | Aflibercept Q8W N=337 | |
| Mean change in BCVA as measured by ETDRS letter score from baseline (95% CI) | 5.8 (4.6, 7.1) | 5.1 (3.9, 6.4) | 3.7 (2.1, 5.4) | 3.3 (1.7, 4.9) |
| Difference in LS mean (95% CI) | 0.7 (-1.1, 2.5) | 0.4 (-1.9, 2.8) | ||
| Proportion of patients with ≥ 15 letter gain from baseline (CMH weighted proportion, 95% CI) | 20.0% (15.6%, 24.4%) | 15.7% (11.9%, 19.6%) | 22.5% (17.8%, 27.2%) | 16.9% (12.7%, 21.1%) |
| Difference in CMH weighted % (95% CI) | 4.3% (-1.6%, 10.1%) | 5.6% (-0.7%,11.9%) | ||
| Proportion of patients avoiding ≥ 15 letter loss from baseline (CMH weighted proportion, 95% CI) | 95.4% (93.0%, 97.7%) | 94.1% (91.5%, 96.7%) | 92.1% (89.1%, 95.1%) | 88.6% (85.1%, 92.2%) |
| Difference in CMH weighted % (95% CI) | 1.3% (-2.2%, 4.8%) | 3.4% (-1.2%, 8.1%) | ||
a Average of weeks 40, 44, and 48
b Average of weeks 104, 108, 112
BCVA: Best Corrected Visual Acuity
ETDRS: Early Treatment Diabetic Retinopathy Study
CI: Confidence Interval
LS: Least Square
CMH: Cochran–Mantel–Haenszel method; a statistical test that generates an estimate of an association with a binary outcome and is used for assessment of categorical variables.
Table 3. Efficacy outcomes at the primary endpoint visitsa and at year 2b in LUCERNE:
| Efficacy Outcomes | LUCERNE | |||
|---|---|---|---|---|
| Year 1 | Year 2 | |||
| Faricimab up to Q16W N=331 | Aflibercept Q8W N=327 | Faricimab up to Q16W N=331 | Aflibercept Q8W N=327 | |
| Mean change in BCVA as measured by ETDRS letter score from baseline (95% CI) | 6.6 (5.3, 7.8) | 6.6 (5.3, 7.8) | 5.0 (3.4, 6.6) | 5.2 (3.6, 6.8) |
| Difference in LS mean (95% CI) | 0.0 (-1.7, 1.8) | -0.2 (-2.4, 2.1) | ||
| Proportion of patients with ≥ 15 letter gain from baseline (CMH weighted proportion, 95% CI) | 20.2% (15.9%, 24.6%) | 22.2% (17.7%, 26.8%) | 22.4% (17.8%, 27.1%) | 21.3% (16.8%, 25.9%) |
| Difference in CMH weighted % (95% CI) | -2.0% (-8.3%, 4.3%) | 1.1% (-5.4%, 7.6%) | ||
| Proportion of patients avoiding ≥ 15 letter loss from baseline (CMH weighted proportion, 95% CI) | 95.8% (93.6%, 98.0%) | 97.3% (95.5%, 99.1%) | 92.9% (90.1%, 95.8%) | 93.2% (90.2%, 96.2%) |
| Difference in CMH weighted % (95% CI) | -1.5% (-4.4%, 1.3%) | -0.2% (-4.4%, 3.9%) | ||
a Average of weeks 40, 44, and 48
b Average of weeks 104, 108, 112
BCVA: Best Corrected Visual Acuity
ETDRS: Early Treatment Diabetic Retinopathy Study
CI: Confidence Interval
LS: Least Square
CMH: Cochran–Mantel–Haenszel method; a statistical test that generates an estimate of an association with a binary outcome and is used for assessment of categorical variables.
Figure 1. Mean change in visual acuity from baseline to year 2 (week 112); combined data from TENAYA and LUCERNE studies:
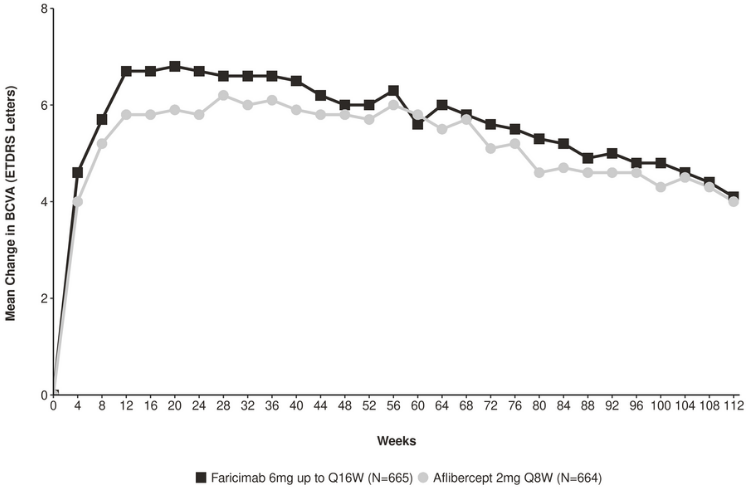
In both TENAYA and LUCERNE, improvements from baseline in BCVA and CST at week 60 were comparable across the two treatment arms and consistent with those seen at week 48.
At week 60, 46% of patients in both TENAYA and LUCERNE were on a Q16W interval. Of these, 69% of patients in both studies maintained Q16W through week 112 without interval reduction.
At week 60, 80% and 78% of patients in TENAYA and LUCERNE, respectively, were on a ≥ Q12W interval (Q16W or Q12W). Of these, 67% and 75% of patients, respectively, maintained a ≥ Q12W interval through week 112 without an interval reduction below Q12W.
At week 60, 33% of patients in both TENAYA and LUCERNE were on a Q12W interval. Of these, 3.2% and 0% of patients in TENAYA and LUCERNE, respectively, maintained Q12W through week 112.
At week 60, 20% and 22% of patients in TENAYA and LUCERNE, respectively, were on a Q8W interval. Of these, 34% and 30% of patients in TENAYA and LUCERNE, respectively, maintained Q8W therapy through week 112.
Efficacy results in all evaluable subgroups (e.g. age, gender, race, baseline visual acuity, lesion type, lesion size) in each study, and in the pooled analysis, were consistent with the results in the overall populations.
Across studies, faricimab up to Q16W showed improvement in pre-specified efficacy endpoint of mean change from baseline to week 48 in the National Eye Institute Visual Function Questionnaire (NEI VFQ-25) composite score that was comparable to aflibercept Q8W, and exceeded the threshold of 4 points. The magnitude of these changes corresponds to a 15-letter gain in BCVA.
The incidence of ocular adverse events in the study eye was 53.9% and 52.1% and non-ocular adverse events was 73.3% and 74.3%, through week 112 in the faricimab and aflibercept arms, respectively (see section 4.4 and 4.8).
DME
The safety and efficacy of faricimab were assessed in two randomised, multi-centre, double-masked, active comparator-controlled 2-year non-inferiority studies (YOSEMITE and RHINE) in patients with DME. A total of 1 891 patients were enrolled in the two studies with 1 622 (86%) patients completing the studies through week 100. A total of 1 887 patients were treated with at least one dose through week 56 (1 262 with faricimab). Patient ages ranged from 24 to 91 with a mean [SD] of 62.2 [9.9] years. The overall population included both anti-VEGF naive patients (78%) and patients who had been previously treated with a VEGF inhibitor prior to study participation (22%). In both studies, patients were randomised in a 1:1:1 ratio to one of the three treatment regimens:
- Faricimab 6 mg Q8W after the first 6 monthly doses.
- Faricimab 6 mg up to Q16W adjustable dosing administered in 4, 8, 12 or 16-week intervals after the first 4 monthly doses.
- Aflibercept 2 mg Q8W after the first 5 monthly doses.
In the Q16W adjustable dosing arm, the dosing followed a standardised treat-and-extend approach. The interval could be increased in 4-week increments or decreased in 4- or 8-week increments based on anatomic and/or visual outcomes, using data obtained only at study drug dosing visits.
Results
Both studies showed efficacy in the primary endpoint, defined as the mean change from baseline in BCVA at year 1 (average of the week 48, 52, and 56 visits), measured by the ETDRS Letter Score. In both studies, faricimab up to Q16W treated patients had a non-inferior mean change from baseline in BCVA, as the patients treated with aflibercept Q8W at year 1, and these vision gains were maintained through year 2.
After 4 initial monthly doses, the patients in the faricimab up to Q16W adjustable dosing arm could have received between the minimum of 6 and the maximum of 21 total injections through week 96. At week 52, 74% and 71% of patients in the faricimab up to Q16W adjustable dosing arm achieved a Q16W or Q12W dosing interval in YOSEMITE and RHINE, respectively (53% and 51% on Q16W, 21% and 20% on Q12W). Of these patients, 75% and 84% maintained ≥ Q12W dosing without an interval reduction below Q12W through week 96; of the patients on Q16W at week 52, 70% and 82% of patients maintained Q16W dosing without an interval reduction through week 96 in YOSEMITE and RHINE, respectively. At week 96, 78% of patients in the faricimab up to Q16W adjustable dosing arm achieved a Q16W or Q12W dosing interval in both studies (60% and 64% on Q16W, 18% and 14% on Q12W). 4% and 6% of patients were extended to Q8W and stayed on ≤ Q8W dosing intervals through week 96; 3% and 5% received only Q4W dosing in YOSEMITE and RHINE through week 96, respectively.
Detailed results from the analyses of YOSEMITE and RHINE studies are listed in Table 4, Table 5, and Figure 2 below.
Table 4. Efficacy outcomes at the year 1 primary endpoint visitsa and at year 2b in YOSEMITE:
| Efficacy Outcomes | YOSEMITE | |||||
|---|---|---|---|---|---|---|
| Year 1 | Year 2 | |||||
| Faricimab Q8W N=315 | Faricimab up to Q16W adjustable dosing N=313 | Aflibercept Q8W N=312 | Faricimab Q8W N=262 | Faricimab up to Q16W adjustable dosing N=270 | Aflibercept Q8W N=259 | |
| Mean change in BCVA as measured by ETDRS letter score from baseline (97.5% CI year 1 and 95% CI year 2) | 10.7 (9.4, 12.0) | 11.6 (10.3, 12.9) | 10.9 (9.6, 12.2) | 10.7 (9.4, 12.1) | 10.7 (9.4, 12.1) | 11.4 (10.0, 12.7) |
| Difference in LS mean (97.5% CI year 1, 95% CI year 2) | -0.2 (-2.0, 1.6) | 0.7 (-1.1, 2.5) | -0.7 (-2.6, 1.2) | -0.7 (-2.5, 1.2) | ||
| Proportion of patients who gained at least 15 letters in BCVA from baseline (CMH weighted proportion, 95% CI year 1 and year 2) | 29.2% (23.9%, 34.5%) | 35.5% (30.1%, 40.9%) | 31.8% (26.6%, 37.0%) | 37.2% (31.4%, 42.9%) | 38.2% (32.8%, 43.7%) | 37.4% (31.7%, 43.0%) |
| Difference in CMH weighted % (95% CI year 1 and year 2) | -2.6% (-10.0%, 4.9%) | 3.5% (-4.0%, 11.1%) | -0.2% (-8.2%, 7.8%) | 0.2% (-7.6%, 8.1%) | ||
| Proportion of patients who avoided loss of at least 15 letters in BCVA from baseline (CMH weighted proportion, 95% CI year 1 and year 2) | 98.1% (96.5%, 99.7%) | 98.6% (97.2%, 100.0%) | 98.9% (97.6%, 100.0%) | 97.6% (95.7%, 99.5%) | 97.8% (96.1%, 99.5%) | 98.0% (96.2%, 99.7%) |
| Difference in CMH weighted % (95% CI year 1 and year 2) | -0.8% (-2.8%, 1.3%) | -0.3% (-2.2%, 1.5%) | -0.4% (-2.9%, 2.2%) | -0.2% (-2.6%, 2.2%) | ||
a Average of weeks 48, 52, 56
b Average of weeks 92, 96, 100
BCVA: Best Corrected Visual Acuity
ETDRS: Early Treatment Diabetic Retinopathy Study
LS: Least Square
CI: Confidence Interval
CMH: Cochran–Mantel–Haenszel method; a statistical test that generates an estimate of an association with a binary outcome and is used for assessment of categorical variables.
Note: CMH weighted % for aflibercept arm presented for faricimab Q8W vs. aflibercept comparison, however the corresponding CMH weighted % for faricimab adjustable vs. aflibercept comparison is similar to the one shown above.
Table 5. Efficacy outcomes at the year 1 primary endpoint visitsa and at year 2b in RHINE:
| Efficacy Outcomes | RHINE | |||||
|---|---|---|---|---|---|---|
| Year 1 | Year 2 | |||||
| Faricimab Q8W N=317 | Faricimab up to Q16W adjustable dosing N=319 | Aflibercept Q8W N=315 | Faricimab Q8W N=259 | Faricimab up to Q16W adjustable dosing N=282 | Aflibercept Q8W N=254 | |
| Mean change in BCVA as measured by ETDRS letter score from baseline (97.5% CI year 1 and 95% CI year 2) | 11.8 (10.6, 13.0) | 10.8 (9.6, 11.9) | 10.3 (9.1, 11.4) | 10.9 (9.5, 12.3) | 10.1 (8.7, 11.5) | 9.4 (7.9, 10.8) |
| Difference in LS mean (97.5% CI year 1, 95% CI year 2) | 1.5 (-0.1, 3.2) | 0.5 (-1.1, 2.1) | 1.5 (-0.5, 3.6) | 0.7 (-1.3, 2.7) | ||
| Proportion of patients who gained at least 15 letters in BCVA from baseline (CMH weighted proportion, 95% CI year 1 and year 2) | 33.8% (28.4%, 39.2%) | 28.5% (23.6%, 33.3%) | 30.3% (25.0%, 35.5%) | 39.8% (34.0%, 45.6%) | 31.1% (26.1%, 36.1%) | 39.0% (33.2%, 44.8%) |
| Difference in CMH weighted % (95% CI year 1 and year 2) | 3.5% (-4.0%, 11.1%) | -2.0% (-9.1%, 5.2%) | 0.8% (-7.4%, 9.0%) | -8% (-15.7%, -0.3%) | ||
| Proportion of patients who avoided loss of at least 15 letters in BCVA from baseline (CMH weighted proportion, 95% CI year 1 and year 2) | 98.9% (97.6%, 100.0%) | 98.7% (97.4%, 100.0%) | 98.6% (97.2%, 99.9%) | 96.6% (94.4%, 98.8%) | 96.8% (94.8%, 98.9%) | 97.6% (95.7%, 99.5%) |
| Difference in CMH weighted % (95% CI year 1 and year 2) | 0.3% (-1.6%, 2.1%) | 0.0% (-1.8%, 1.9%) | -1.0% (-3.9%, 1.9%) | -0.7% (-3.5%, 2.0%) | ||
a Average of weeks 48, 52, 56
b Average of weeks 92, 96, 100
BCVA: Best Corrected Visual Acuity
ETDRS: Early Treatment Diabetic Retinopathy Study
LS: Least Square
CI: Confidence Interval
CMH: Cochran–Mantel–Haenszel method; a statistical test that generates an estimate of an association with a binary outcome and is used for assessment of categorical variables.
Note: CMH weighted % for aflibercept arm presented for faricimab Q8W vs. aflibercept comparison, however the corresponding CMH weighted % for faricimab adjustable vs. aflibercept comparison is similar to the one shown above.
Figure 2. Mean change in visual acuity from baseline to year 2 (week 100); combined data from YOSEMITE and RHINE studies:
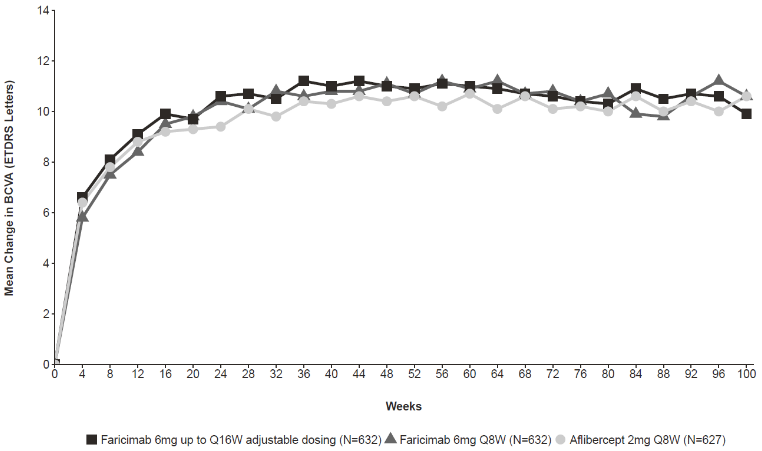
Efficacy results in patients who were anti-VEGF treatment naive prior to study participation and in all the other evaluable subgroups (e.g. by age, gender, race, baseline HbA1c, baseline visual acuity) in each study were consistent with the results in the overall populations.
Across studies, faricimab Q8W and up to Q16W adjustable dosing showed improvements in the pre-specified efficacy endpoint of mean change from baseline to week 52 in the NEI VFQ-25 composite score that was comparable to aflibercept Q8W and exceeded the threshold of 4 points. Faricimab Q8W and up to Q16W adjustable dosing also demonstrated clinically meaningful improvements in the pre- specified efficacy endpoint of change from baseline to week 52 in the NEI VFQ-25 near activities, distance activities, and driving scores, that were comparable to aflibercept Q8W. The magnitude of these changes corresponds to a 15-letter gain in BCVA. Comparable proportions of patients treated with faricimab Q8W, faricimab up to Q16W adjustable dosing, and aflibercept Q8W experienced a clinically meaningful improvement of ≥ 4-points from baseline to week 52 in the NEI VFQ-25 composite score, a pre-specified efficacy endpoint. These results were maintained at week 100.
An additional key efficacy outcome in DME studies was the change in the Early Treatment Diabetic Retinopathy Study Diabetic Retinopathy Severity Scale (ETDRS-DRSS) from baseline to week 52. Of the 1 891 patients enrolled in Studies YOSEMITE and RHINE, 708 and 720 patients were evaluable for DR endpoints, respectively.
The ETDRS-DRSS scores ranged from 10 to 71 at baseline.
The majority of patients, approximately 60%, had moderate to severe non-proliferative DR (DRSS 43/47/53) at baseline.
The proportion of patients who achieved ≥ 2-step and ≥ 3-step improvement from baseline in ETDRS-DRSS at week 52 and at week 96 are shown in Table 6 and Table 7 below.
Table 6. Proportion of patients who achieved ≥ 2-step and ≥ 3-step improvement from baseline in ETDRS-DRSS score at week 52 and at week 96 in YOSEMITE (DR evaluable population):
| YOSEMITE | ||||||
|---|---|---|---|---|---|---|
| 52 Weeks | 96 Weeks | |||||
| Faricimab Q8W n=237 | Faricimab up to Q16W adjustable dosing n=242 | Aflibercept Q8W n=229 | Faricimab Q8W n=220 | Faricimab up to Q16W adjustable dosing n=234 | Aflibercept Q8W n=221 | |
| Proportion of patients with ≥ 2-step ETDRS- DRSS improvement from baseline (CMH weighted proportion) | 46.0% | 42.5% | 35.8% | 51.4% | 42.8% | 42.2% |
| Weighted Difference (97.5% CI year 1, 95% year 2) | 10.2% (0.3%, 20.0%) | 6.1% (-3.6%, 15.8%) | 9.1% (0.0%, 18.2%) | 0.0% (-8.9%, 8.9%) | ||
| Proportion of patients with ≥ 3-step ETDRS- DRSS improvement from baseline (CMH weighted proportion) | 16.8% | 15.5% | 14.7% | 22.4% | 14.6% | 20.9% |
| Weighted Difference (95% CI year 1 and year 2) | 2.1% (-4.3%, 8.6%) | 0.6% (-5.8%, 6.9%) | 1.5% (-6.0%, 9.0%) | -6.7% (-13.6%, 0.1%) | ||
ETDRS-DRSS: Early Treatment Diabetic Retinopathy Study Diabetic Retinopathy Severity Scale
CI: Confidence Interval
CMH: Cochran–Mantel–Haenszel method; a statistical test that generates an estimate of an association with a binary outcome
and is used for assessment of categorical variables.
Note: CMH weighted % for aflibercept arm presented for faricimab Q8W vs. aflibercept comparison, however the
corresponding CMH weighted % for faricimab adjustable vs. aflibercept comparison is similar to the one shown above.
Table 7. Proportion of patients who achieved ≥ 2-step and ≥ 3-step improvement from baseline in ETDRS-DRSS score at week 52 and at week 96 in RHINE (DR evaluable population):
| RHINE | ||||||
|---|---|---|---|---|---|---|
| 52 Weeks | 96 Weeks | |||||
| Faricimab Q8W n=231 | Faricimab up to Q16W adjustable dosing n=251 | Aflibercept Q8W n=238 | Faricimab Q8W n=214 | Faricimab up to Q16W adjustable dosing n=228 | Aflibercept Q8W n=203 | |
| Proportion of patients with ≥ 2-step ETDRS- DRSS improvement from baseline (CMH weighted proportion) | 44.2% | 43.7% | 46.8% | 53.5% | 44.3% | 43.8% |
| Weighted Difference (97.5% CI year 1, 95% year 2) | -2.6% (-12.6%,7.4%) | -3.5% (-13.4%, 6.3%) | 9.7% (0.4%, 19.1%) | 0.3% (-8.9%, 9.5%) | ||
| Proportion of patients with ≥ 3-step ETDRS- DRSS improvement from baseline (CMH weighted proportion) | 16.7% | 18.9% | 19.4% | 25.1% | 19.3% | 21.8% |
| Weighted Difference (95% CI year 1 and year 2) | -0.2% (-5.8%, 5.3%) | -1.1% (-8.0%, 5.9%) | 3.3% (-4.6%, 11.3%) | -2.7% (-10.2%, 4.8%) | ||
ETDRS-DRSS: Early Treatment Diabetic Retinopathy Study Diabetic Retinopathy Severity Scale
CI: Confidence Interval
CMH: Cochran–Mantel–Haenszel method; a statistical test that generates an estimate of an association with a binary outcome and is used for assessment of categorical variables.
Note: CMH weighted % for aflibercept arm presented for faricimab Q8W vs. aflibercept comparison, however the corresponding CMH weighted % for faricimab adjustable vs. aflibercept comparison is similar to the one shown above.
Treatment effects in evaluable subgroups (e.g. by previous anti-VEGF treatment, age, gender, race, baseline HbA1c, and baseline visual acuity) in each study were generally consistent with the results in the overall population.
Treatment effects in subgroups by DR severity at baseline were different and showed the greatest ≥ 2-step DRSS improvements among patients with moderately severe and severe non-proliferative DR with approximately 90% of patients achieving improvements consistently across all treatment arms in both studies.
The incidence of ocular adverse events in the study eye was 49.7%, 49.2%, and 45.4% and non-ocular adverse events was 73.0%, 74.2%, and 75.7% through week 100, in the faricimab Q8W, faricimab up to Q16W, and aflibercept Q8W arms, respectively (see section 4.4 and 4.8).
RVO
The safety and efficacy of faricimab were assessed in two randomised, multi-centre, double-masked, 72-week long studies in patients with macular oedema secondary to BRVO (BALATON) or CRVO/HRVO (COMINO). Active comparator-controlled data are available through month 6.
A total of 1 282 patients (553 in BALATON and 729 in COMINO) were enrolled in the two studies, with 1 276 patients treated with at least one dose through week 24 (641 with faricimab). Patient ages ranged from 28 to 93 with a mean [SD] of 64 [10.7] years, and 22 to 100 with a mean [SD] of 65 [13.2] years in BALATON and COMINO, respectively.
A total of 489 out of 553 patients randomised in BALATON completed the study at week 72; 263 patients initially randomised to faricimab ('prior faricimab') and 267 patients initially randomised to aflibercept ('prior aflibercept') received at least one dose of faricimab during the faricimab adjustable dosing phase.
A total of 656 out of 729 patients randomised in COMINO completed the study at week 72; 353 prior faricimab and 342 prior aflibercept patients received at least one dose of faricimab during the faricimab adjustable dosing phase.
In both studies, patients were randomised in a 1:1 ratio to one of two treatment arms until week 24:
- Faricimab 6 mg Q4W for 6 consecutive monthly doses
- Aflibercept 2 mg Q4W for 6 consecutive monthly doses
After 6 initial monthly doses, patients initially randomised to the aflibercept 2 mg arm moved to faricimab 6 mg, and could have received faricimab 6 mg up to Q16W adjustable dosing, where the dosing interval could be increased in 4-week increments or decreased by 4-, 8- or 12-weeks based on an automated objective assessment of pre-specified visual and anatomic disease activity criteria.
Results
Both studies showed efficacy in the primary endpoint, defined as the change from baseline in BCVA at week 24, measured by the ETDRS Letter Score. In both studies, faricimab Q4W treated patients had a non-inferior mean change from baseline in BCVA, compared to patients treated with aflibercept Q4W, and these vision gains were maintained through week 72 when patients moved to a faricimab up to Q16W adjustable dosing regimen.
Between week 24 and week 68, 81.5% and 74.0% of the patients receiving faricimab up to Q16W adjustable dosing regimen achieved a ≥ Q12W (Q16W or Q12W) dosing interval in BALATON and COMINO, respectively. Of these patients, 72.1% and 61.6% completed at least one cycle of Q12W and maintained ≥ Q12W dosing without an interval reduction below Q12W through week 68 in BALATON and COMINO, respectively; 1.2% and 2.5% of the patients received only Q4W dosing through week 68 in BALATON and COMINO, respectively.
Across studies, at week 24 patients in the faricimab Q4W arm showed improvement in the pre-specified efficacy endpoint of change from baseline to week 24 in the NEI VFQ-25 composite score that was comparable to aflibercept Q4W. Faricimab Q4W also demonstrated improvement in the pre-specified efficacy endpoint of change from baseline to week 24 in the NEI VFQ-25 near activities and distance activities, that were comparable to aflibercept Q4W. These results were maintained through week 72 when all patients were on faricimab up to Q16W adjustable dosing regimen.
Table 8. Efficacy outcomes at the week 24 primary endpoint visit and at the end of the studya in BALATON:
| Efficacy Outcomes | BALATON | |||
|---|---|---|---|---|
| 24 Weeks | 72 Weeksa | |||
| Faricimab Q4W N=276 | Aflibercept Q4W N=277 | Faricimab Q4W to Faricimab Adjustable N=276 | Aflibercept Q4W to Faricimab Adjustable N=277 | |
| Mean change in BCVA as measured by ETDRS letter score from baseline (95% CI) | 16.9 (15.7, 18.1) | 17.5 (16.3, 18.6) | 18.1 (16.9, 19.4) | 18.8 (17.5, 20.0) |
| Difference in LS mean (95% CI) | -0.6 (-2.2, 1.1) | |||
| Proportion of patients with ≥ 15 letter gain from baseline (CMH weighted proportion, 95% CI) | 56.1% (50.4%, 61.9%) | 60.4% (54.7%, 66.0%) | 61.5% (56.0%, 67.0%) | 65.8% (60.3%, 71.2%) |
| Difference in CMH weighted % (95% CI) | -4.3% (-12.3%, 3.8%) | |||
a Average of weeks 64, 68, 72
BCVA: Best Corrected Visual Acuity
ETDRS: Early Treatment Diabetic Retinopathy Study
CI: Confidence Interval
LS: Least Square
CMH: Cochran–Mantel–Haenszel method; a statistical test that generates an estimate of an association with a binary outcome and is used for assessment of categorical variables
Table 9. Efficacy outcomes at the week 24 primary endpoint visit and at the end of the study a in COMINO:
| Efficacy Outcomes | COMINO | |||
|---|---|---|---|---|
| 24 Weeks | 72 Weeksa | |||
| Faricimab Q4W N=366 | Aflibercept Q4W N=363 | Faricimab Q4W to Faricimab Adjustable N=366 | Aflibercept Q4W to Faricimab Adjustable N=363 | |
| Mean change in BCVA as measured by ETDRS letter score from baseline (95% CI) | 16.9 (15.4, 18.3) | 17.3 (15.9, 18.8) | 16.9 (15.2, 18.6) | 17.1 (15.4, 18.8) |
| Difference in LS mean (95% CI) | -0.4 (-2.5, 1.6) | |||
| Proportion of patients with ≥ 15 letter gain from baseline (CMH weighted proportion, 95% CI) | 56.6% (51.7%, 61.5%) | 58.1% (53.3%, 62.9%) | 57.6% (52.8%, 62.5%) | 59.5% (54.7%, 64.3%) |
| Difference in CMH weighted % (95% CI) | -1.5% (-8.4%, 5.3%) | |||
a Average of weeks 64, 68, 72
BCVA: Best Corrected Visual Acuity
ETDRS: Early Treatment Diabetic Retinopathy Study
CI: Confidence Interval
LS: Least Square
CMH: Cochran–Mantel–Haenszel method; a statistical test that generates an estimate of an association with a binary outcome and is used for assessment of categorical variables.
Figure 3. Mean change in visual acuity from baseline to week 72 in BALATON:
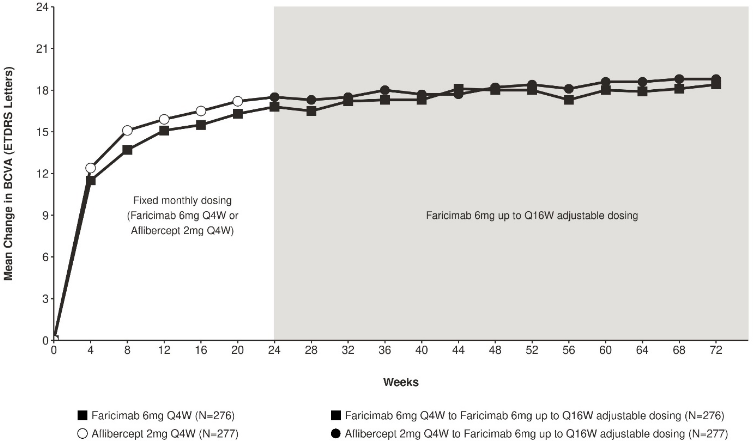
Faricimab 6 mg up to Q16W adjustable dosing started at week 24 but not all patients received faricimab at week 24.
Figure 4. Mean change in visual acuity from baseline to week 72 in COMINO:
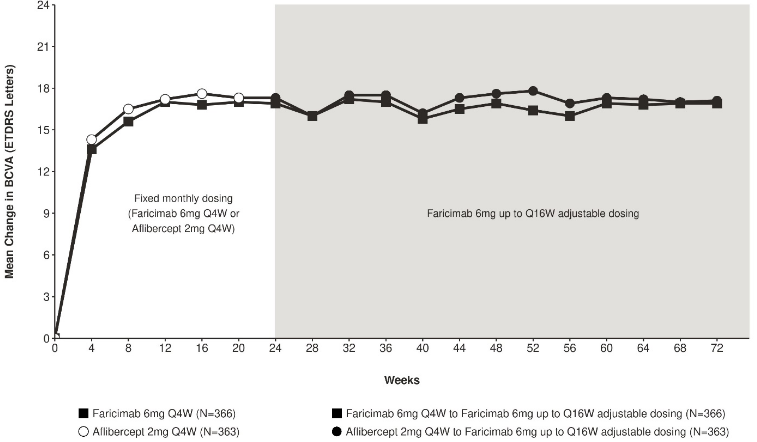
Faricimab 6 mg up to Q16W adjustable dosing started at week 24 but not all patients received faricimab at week 24.
The incidence of ocular adverse events in the study eye was 20.1% and 24.6%, and non-ocular adverse events was 32.9% and 36.4%, through week 24 in the faricimab Q4W and aflibercept Q4W arms, respectively (see section 4.8).
Paediatric population
The European Medicines Agency has waived the obligation to submit the results of studies with faricimab in all subsets of the paediatric population in nAMD, DME, and RVO (see section 4.2 for information on paediatric use).
5.2. Pharmacokinetic properties
Faricimab is administered intravitreally to exert local effects in the eye.
Absorption and distribution
Based on a population pharmacokinetic analysis (including nAMD and DME N=2 246), maximum free (unbound to VEGF-A and Ang-2) faricimab plasma concentrations (Cmax) are estimated to occur approximately 2 days post-dose. Mean (±SD [standard deviation]) plasma Cmax are estimated 0.23 (0.07) μg/mL and 0.22 (0.07) μg/mL respectively in nAMD and in DME patients. After repeated administrations, mean plasma free faricimab trough concentrations are predicted to be 0.002-0.003 μg/mL for Q8W dosing.
Faricimab exhibited dose-proportional pharmacokinetics (based on Cmax and AUC) over the dose range 0.5 mg-6 mg. No accumulation of faricimab was apparent in the vitreous or in plasma following monthly dosing.
Maximum plasma free faricimab concentrations are predicted to be approximately 600 and 6 000-fold lower than in aqueous and vitreous humour respectively. Therefore, systemic pharmacodynamic effects are unlikely, further supported by the absence of significant changes in free VEGF and Ang-2 concentration in plasma upon faricimab treatment in clinical studies.
Population pharmacokinetic analysis has shown an effect of age and body weight on ocular or systemic pharmacokinetics of faricimab respectively. Both effects were considered not clinically meaningful; no dose adjustment is needed.
Biotransformation and elimination
Faricimab is a protein-based therapeutic hence its metabolism and elimination have not been fully characterised. Faricimab is expected to be catabolised in lysosomes to small peptides and amino acids, which may be excreted renally, in a similar manner to the elimination of endogenous IgG.
The faricimab plasma concentration-time profile declined in parallel with the vitreous and aqueous concentration-time profiles. The estimated mean ocular half-life and apparent systemic half-life of faricimab is approximately 7.5 days.
Pharmacokinetic analysis of patients with nAMD, DME, and RVO (N=2 977) has shown that the pharmacokinetics of faricimab are comparable in nAMD, DME, and RVO patients.
Special populations
Elderly
In the six Phase III clinical studies, approximately 58% (1,496/2,571) of patients randomised to treatment with faricimab were ≥65 years of age. Population pharmacokinetic analysis has shown an effect of age on ocular pharmacokinetics of faricimab. The effect was considered not clinically meaningful. No dose adjustment is required in patients 65 years and above (see section 4.2).
Renal impairment
No specific studies in patients with renal impairment have been conducted with faricimab. Pharmacokinetic analysis of patients in all clinical studies of which 63% had renal impairment (mild 38%, moderate 23%, and severe 2%), revealed no differences with respect to systemic pharmacokinetics of faricimab after intravitreal administration of faricimab. No dose adjustment is required in patients with renal impairment (see section 4.2).
Hepatic impairment
No specific studies in patients with hepatic impairment have been conducted with faricimab. However, no special considerations are needed in this population because metabolism occurs via proteolysis and does not depend on hepatic function. No dose adjustment is required in patients with hepatic impairment (see section 4.2).
Other special populations
The systemic pharmacokinetics of faricimab are not influenced by race. Gender was not shown to have a clinically relevant influence on systemic pharmacokinetics of faricimab. No dose adjustment is needed.
5.3. Preclinical safety data
No studies have been conducted on the carcinogenic or mutagenic potential of faricimab.
In pregnant cynomolgus monkeys, IV injections of faricimab resulting in serum exposure (Cmax) more than 500-times the maximum human exposure did not elicit developmental toxicity or teratogenicity, and had no effect on weight or structure of the placenta, although, based on its pharmacological effect faricimab should be regarded as potentially teratogenic and embryo-/foetotoxic.
Systemic exposure after ocular administration of faricimab is very low.
© All content on this website, including data entry, data processing, decision support tools, "RxReasoner" logo and graphics, is the intellectual property of RxReasoner and is protected by copyright laws. Unauthorized reproduction or distribution of any part of this content without explicit written permission from RxReasoner is strictly prohibited. Any third-party content used on this site is acknowledged and utilized under fair use principles.