VANRAFIA Film-coated tablet Ref.[115500] Active ingredients: Atrasentan
Source: FDA, National Drug Code (US) Revision Year: 2025
12.1. Mechanism of Action
Atrasentan is an ETA receptor antagonist (Ki = 0.034 nM) with >1800-fold selectivity for the ETA receptor compared to the endothelin type B receptor (Ki = 63.3 nM). Endothelin (ET)-1 is thought to contribute to the pathogenesis of IgAN via the ETAR.
12.2. Pharmacodynamics
Dose-response information is not available. At the recommended dose regimen, no statistically significant exposure-response (E-R) relationship was identified between atrasentan exposure and the percentage reduction from baseline in UPCR at Week 36 over the observed atrasentan exposure range. Increased atrasentan exposure was associated with an increased incidence of anemia, but no association was observed between atrasentan exposure and hypotension or peripheral edema.
Cardiac Electrophysiology
At exposures 40% higher than the clinical exposure at the maximum recommended dose, clinically significant QTc interval prolongation was not observed.
12.3. Pharmacokinetics
Atrasentan area under the time concentration curve (AUC) is dose proportional across the 0.35 mg to 30 mg (0.47 to 40 times the approved recommended dosage) dose range. Atrasentan steady state plasma concentrations are reached within 7 days with 2- to 3-fold accumulation.
Absorption
Atrasentan time to peak plasma concentration (Tmax) is approximately 0.5 hour.
Effect of Food
No clinically significant differences in atrasentan pharmacokinetics were observed following administration with a high-fat meal (800 to 1000 Kcal, >50% fat) in healthy subjects.
Distribution
Atrasentan steady-state apparent (oral) volume of distribution (Vd/F) is 1180 L. Atrasentan is >99% bound to human plasma proteins, in vitro.
Elimination
Atrasentan effective half-life is approximately 24 to 41 hours with an apparent (oral) clearance (CL/F) of 19 L/h.
Metabolism
Atrasentan is extensively metabolized by CYP3A and multiple uridine 5'-diphospho-glucuronosyltransferases (UGTs) with approximately half via CYP3A and the remaining half via glucuronidation by multiple UGTs.
Excretion
After a single dose of radiolabeled atrasentan 10 mg to healthy subjects, approximately 86% of the dose was recovered in feces (5.5% as parent atrasentan). Renal excretion was minimal, with < 4% recovered in urine (negligible amounts of parent atrasentan).
Specific Populations
No clinically significant differences in the pharmacokinetics of atrasentan were observed based on age (19 to 77 years), sex, race, mild to severe renal impairment (eGFR 15 to 90 mL/min/1.73 m², estimated by CKD-EPI), or mild to moderate hepatic impairment (Child-Pugh class A or B). The effect of severe hepatic impairment (Child-Pugh class C) or end-stage renal disease (eGFR <15 mL/min/1.73 m²) on atrasentan pharmacokinetics is unknown.
Drug Interaction Studies
Clinical Studies and Model-Informed Approaches
Strong and moderate CYP3A inducers: Atrasentan Ctrough decreased by 90% following coadministration of a single dose of 10 mg VANRAFIA with rifampin (strong CYP3A inducer).
OATP1B1/1B3 inhibitors: Atrasentan Cmax was 4.3 times as high and AUC was 3.8 times as high following coadministration of a single dose of 0.75 mg VANRAFIA with cyclosporine (OATP1B1/1B3 inhibitor).
Strong CYP3A inhibitors: Atrasentan AUC increased by 90% following coadministration of a single dose of 10 mg VANRAFIA with ketoconazole (strong CYP3A inhibitor).
Other Drugs: No clinically significant differences in the pharmacokinetics of midazolam (CYP3A4 substrate), losartan (CYP2C9 and CYP3A4 substrate) or fexofenadine (P-gp substrate) were observed or expected when used concomitantly with VANRAFIA.
In Vitro Studies
CYP450 Enzymes: Atrasentan is a CYP3A substrate. Atrasentan inhibits in vitro CYP3A, CYP2B6, CYP2C8 and CYP2C9 and induces CYP3A and CYP2B6, but is not expected to cause clinically significant interactions with these CYP450 enzymes in the liver. Atrasentan does not inhibit CYP1A2, CYP2C19, or CYP2D6 and is not an inducer of CYP1A2.
Transporter Systems: Atrasentan is a substrate of P-gp and OATP1B1/1B3 but not a substrate of BCRP, MRP2/4, NTCP, OCT1, or OATP2B1. Atrasentan inhibits P-gp, OATP1B1, and OATP1B3, but not expected to cause clinically significant interactions. Atrasentan does not inhibit MRP, NTCP, OCT, OAT1, MATE1, or MATE2K.
13.1. Carcinogenesis, Mutagenesis, Impairment of Fertility
Carcinogenesis
In female rats orally administered atrasentan for 2 years, no atrasentan-related tumor findings were observed at exposures approximately 12 times the AUC at the MRHD. At a higher exposure (approximately 24 times the AUC at the MRHD, or 2 mg/kg/day), an increased incidence of benign uterine stromal polyps considered of low human relevance was observed. In male rats, no carcinogenic effects were observed at exposures approximately 100 times the AUC at the MRHD.
There were no atrasentan-related tumor findings observed in male and female transgenic mice administered atrasentan for 6 months at doses up to 60 mg/kg/day.
Mutagenesis
There was no evidence of mutagenicity or clastogenicity for atrasentan in in vitro bacteria reverse mutation and chromosomal aberration assays, or in an in vivo mouse micronucleus study.
Impairment of Fertility
In a fertility study, male rats were treated with atrasentan at doses of 5, 20, and 60 mg/kg/day and mated with untreated female rats. No adverse effects on male fertility were observed at 5 mg/kg/day, approximately 53 times the AUC at the MRHD. At higher doses, decreased numbers of implantation sites, reduced viable fetuses, and increased pre-implantation loss were observed in the untreated female rats mated with the treated male rats. These effects were reversible at 20 mg/kg/day, approximately 422 times the AUC at MRHD. In rats and dogs, testicular degeneration, dilatation of seminiferous tubules, interstitial edema of the testes, and prostate inflammation were observed at all doses tested, and a no adverse effect dose level could not be determined.
In a female rat fertility study, no reproductive toxicity was observed following oral administration during premating, mating, and early gestation at doses up to 100 mg/kg/day.
In female rats, cystic endometrial hyperplasia was observed at the lowest dose tested of 0.8 mg/kg/day.
14. Clinical Studies
14.1 IgA Nephropathy
The effect of VANRAFIA on proteinuria was assessed in a randomized, double-blind, placebo-controlled, multicenter, global study (ALIGN, NCT04573478) in adults with biopsy-proven primary IgAN, an eGFR ≥30 mL/min/1.73 m², and urine protein ≥1 g/day on a stable dose of maximally tolerated renin angiotensin system inhibitor. The study included two cohorts: a main cohort of 340 patients and an exploratory cohort of 64 patients who were also on a stable dose of sodium glucose co-transporter 2 inhibitor (SGLT2i) at baseline. Patients with chronic kidney disease due to another condition in addition to IgAN or those who had been recently treated with systemic immunosuppressants were excluded. Patients were randomized (1:1) to receive either VANRAFIA 0.75 mg or placebo once daily. RAS inhibitor therapy was continued throughout the study. Rescue immunosuppressive treatment could be initiated per investigator discretion during the trial.
The efficacy analysis included the first 270 patients in the main cohort who reached the Week 36 visit. At baseline, the mean age was 45 years (range: 19 to 77 years); 59% were male, 36% White, 57% Asian, 2% Black or African American and 5% other or not specified. At baseline, 60% had a history of hypertension, 1.5% had a history of type 2 diabetes, and 45% had hematuria based on urine dipstick. The mean baseline eGFR was 59 mL/min/1.73 m². The geometric mean baseline UPCR was 1.5 g/g sampled from a 24-hour urine and 15% of patients had proteinuria >3.5 g/day.
The primary endpoint was the percent reduction in UPCR at Week 36 relative to baseline (see Table 2).
Table 2. Percent Reduction in UPCR at Week 36 Relative to Baseline in ALIGN:
| VANRAFIA on top of supportive carea (N=135) | Placebo on top of supportive carea (N=135) | |
|---|---|---|
| % Reduction in UPCR (95% CI) at Week 36 relative to baselineb,d | 38% (32%, 44%) | 3% (-7%, 12%) |
| VANRAFIA versus placebo: % reduction in UPCR (95% CI) at Week 36 relative to baseline compared on a relative scalec,d | 36% (26%, 45%) | |
| p-valuee | <0.0001 | |
a Supportive care: primarily a stable dose of maximally-tolerated RAS inhibitor therapy.
b Least squares geometric mean ratio in UPCR (sampled from a 24-hr urine collection) to baseline was reported as a percent reduction along with the respective 95% confidence interval.
c The estimate of the ratio of least squares geometric mean ratio in UPCR (sampled from a 24-hr urine collection) to baseline comparing VANRAFIA with placebo was reported as a relative percent reduction along with the respective 95% confidence interval and 2-sided p-value.
d Mixed model repeated measures analysis included all observed UPCR data except for subjects with intercurrent events (i.e., restricted medication use, chronic dialysis, kidney transplant). These subjects had UPCR data excluded beginning at the start date of the earliest event. The only intercurrent events observed were restricted medication use, which occurred in 3.0% and 5.2% of VANRAFIA and placebo treated subjects, respectively.
e Two-sided p-value statistically significant at the 0.01 level.
Abbreviations: CI, confidence interval; N, number of randomized subjects in each group in the main cohort; UPCR, urine protein-to-creatinine ratio; RAS, renin-angiotensin system.
The adjusted geometric mean percent change from baseline in UPCR over time is displayed in Figure 1.
Figure 1. Geometric Mean Percent Change from Baseline in UPCR by Visit in ALIGN:
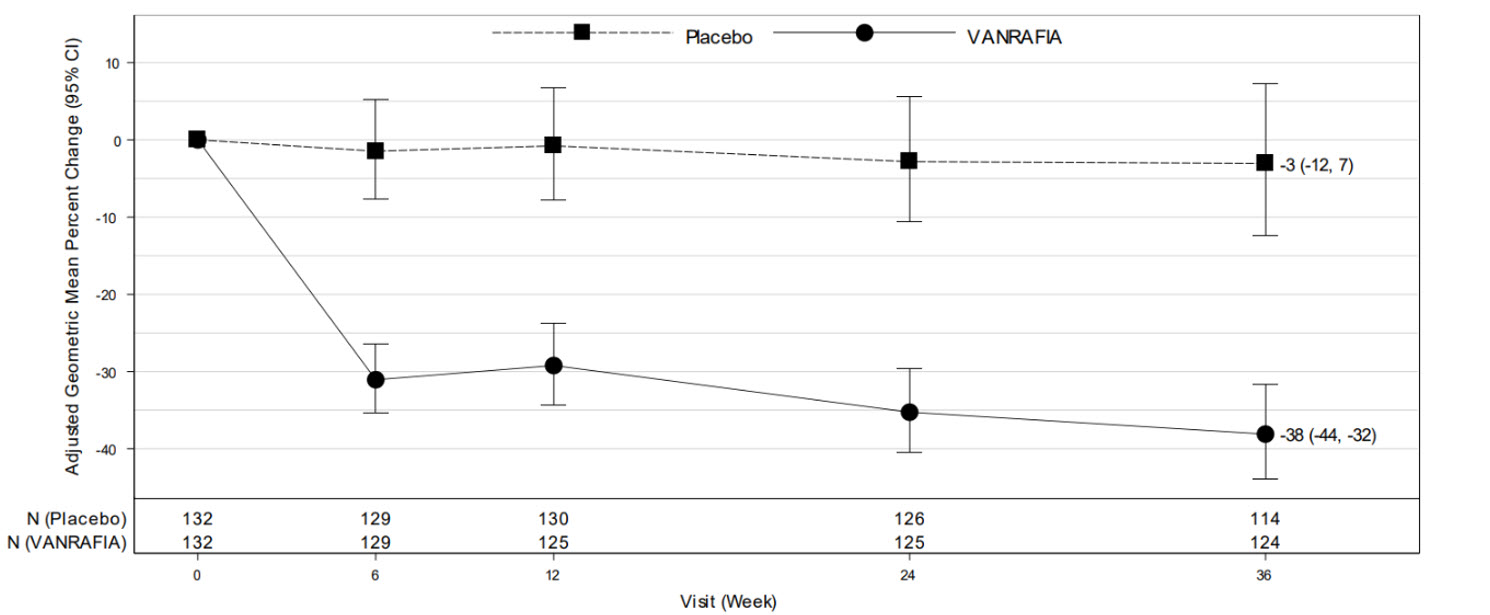
Adjusted % change relative to baseline in UPCR (sampled from a 24-hr urine collection) was estimated based on the MMRM analysis in Table 2.
N represents the number of evaluable subjects included in the analysis (i.e., with non-missing UPCR values and baseline covariates, and did not initiate restricted medication use, chronic dialysis, or kidney transplant) for each visit and treatment group.
Values reported in the figure were expressed as percent change from baseline and 95% CI, estimated from the regression model in Table 2.
Abbreviations: CI, confidence interval; MMRM, mixed model repeated measures; UPCR, urine protein-to-creatinine ratio.
The treatment effect on UPCR at Week 36 was consistent across subgroups including age, sex, race, baseline disease characteristics (such as baseline eGFR and proteinuria levels) within the main cohort. The treatment effect on UPCR at Week 36 was also consistent in the exploratory SGLT2i cohort.
© All content on this website, including data entry, data processing, decision support tools, "RxReasoner" logo and graphics, is the intellectual property of RxReasoner and is protected by copyright laws. Unauthorized reproduction or distribution of any part of this content without explicit written permission from RxReasoner is strictly prohibited. Any third-party content used on this site is acknowledged and utilized under fair use principles.