Source: FDA, National Drug Code (US) Revision Year: 2020
Tocilizumab binds to both soluble and membrane-bound IL-6 receptors (sIL-6R and mIL-6R), and has been shown to inhibit IL-6-mediated signaling through these receptors. IL-6 is a pleiotropic pro-inflammatory cytokine produced by a variety of cell types including T- and B-cells, lymphocytes, monocytes and fibroblasts. IL-6 has been shown to be involved in diverse physiological processes such as T-cell activation, induction of immunoglobulin secretion, initiation of hepatic acute phase protein synthesis, and stimulation of hematopoietic precursor cell proliferation and differentiation. IL-6 is also produced by synovial and endothelial cells leading to local production of IL-6 in joints affected by inflammatory processes such as rheumatoid arthritis.
In clinical studies in RA patients with the 4 mg per kg and 8 mg per kg intravenous doses or the 162 mg weekly and every other weekly subcutaneous doses of ACTEMRA, decreases in levels of C-reactive protein (CRP) to within normal ranges were seen as early as week 2. Changes in pharmacodynamic parameters were observed (i.e., decreases in rheumatoid factor, erythrocyte sedimentation rate (ESR), serum amyloid A, fibrinogen and increases in hemoglobin) with doses, however the greatest improvements were observed with 8 mg per kg ACTEMRA. Pharmacodynamic changes were also observed to occur after ACTEMRA administration in GCA, PJIA, and SJIA patients (decreases in CRP, ESR, and increases in hemoglobin). The relationship between these pharmacodynamic findings and clinical efficacy is not known.
In healthy subjects administered ACTEMRA in doses from 2 to 28 mg per kg intravenously and 81 to 162 mg subcutaneously, absolute neutrophil counts decreased to the nadir 3 to 5 days following ACTEMRA administration. Thereafter, neutrophils recovered towards baseline in a dose dependent manner. Rheumatoid arthritis and GCA patients demonstrated a similar pattern of absolute neutrophil counts following ACTEMRA administration [see Warnings and Precautions (5.4)].
PK of tocilizumab is characterized by nonlinear elimination which is a combination of linear clearance and Michaelis-Menten elimination. The nonlinear part of tocilizumab elimination leads to an increase in exposure that is more than dose-proportional. The pharmacokinetic parameters of tocilizumab do not change with time. Due to the dependence of total clearance on tocilizumab serum concentrations, the half-life of tocilizumab is also concentration-dependent and varies depending on the serum concentration level. Population pharmacokinetic analyses in any patient population tested so far indicate no relationship between apparent clearance and the presence of anti-drug antibodies.
The pharmacokinetics in healthy subjects and RA patients suggest that PK is similar between the two populations.
The population PK model was developed from an analysis dataset composed of an IV dataset of 1793 patients from Study I, Study III, Study IV, and Study V, and from an IV and SC dataset of 1759 patients from Studies SC-I and SC-II. Cmean is included in place of AUCtau, since for dosing regimens with different inter-dose intervals, the mean concentration over the dosing period characterizes the comparative exposure better than AUCtau.
At high serum concentrations, when total clearance of tocilizumab is dominated by linear clearance, a terminal half-life of approximately 21.5 days was derived from the population parameter estimates.
For doses of 4 mg/kg tocilizumab given every 4 weeks intravenously, the estimated median (range) Cmax, Ctrough, and Cmean of tocilizumab at steady state were 86.1 (44.8–202) mcg/mL, 0.1 (0.0–14.6) mcg/mL, and 18.0 (8.9–50.7) mcg/mL, respectively. For doses of 8 mg/kg tocilizumab given every 4 weeks intravenously, the estimated median (range) Cmax, Ctrough, and Cmean of tocilizumab were 176 (75.4–557) mcg/mL, 13.4 (0.1–154) mcg/mL, and 54.0 (17–260) mcg/mL, respectively. Cmax increased dose-proportionally between doses of 4 and 8 mg/kg IV every 4 weeks, while a greater than dose-proportional increase was observed in Cmean and Ctrough. At steady-state, Cmean and Ctrough were 3.0 and 134 fold higher at 8 mg/kg as compared to 4 mg/kg, respectively.
The accumulation ratios for AUC and Cmax after multiple doses of 4 and 8 mg/kg IV Q4W are low, while the accumulation ratios for Ctrough are higher (2.62 and 2.47, respectively). For Cmax, greater than 90% of the steady-state value was reached after the 1st IV infusion. For AUCtau and Cmean, 90% of the steady-state value was reached after the 1st and 3rd infusion for 4 mg/kg and 8 mg/kg IV, while for Ctrough, approximately 90% of the steady-state value was reached after the 4th IV infusion after both doses.
For doses of 162 mg given every other week subcutaneously, the estimated median (range) steady-state Cmax, Ctrough, and Cmean of tocilizumab were 12.1 (0.4–49.3) mcg/mL, 4.1 (0.0–34.2) mcg/mL, and 9.2 (0.2–43.6) mcg/mL, respectively.
For doses of 162 mg given every week subcutaneously, the estimated median (range) steady-state Cmax, Ctrough, and Cmean of tocilizumab were 49.8 (3–150) mcg/mL, 42.9 (1.3–144) mcg/mL, and 47.3 (2.4–147) mcg/mL, respectively. Exposures after the 162 mg SC QW regimen were greater by 5.1 (Cmean) to 10.5 fold (Ctrough) compared to the 162 SC Q2W regimen.
Accumulation ratios after multiple doses of either SC regimen were higher than after IV regimen with the highest ratios for Ctrough (6.02 and 6.30, for 162 mg SC Q2W and 162 mg SC QW, respectively). The higher accumulation for Ctrough was expected based on the nonlinear clearance contribution at lower concentrations. For Cmax, greater than 90% of the steady-state value was reached after the 5th SC and the 12th SC injection with the Q2W and QW regimens, respectively. For AUCtau and Cmean, 90% of the steady-state value was reached after the 6th and 12th injections for the 162 mg SC Q2W and QW regimens, respectively. For Ctrough, approximately 90% of the steady-state value was reached after the 6th and 12th injections for the 162 mg SC Q2W and QW regimens, respectively.
Population PK analysis identified body weight as a significant covariate impacting the pharmacokinetics of tocilizumab. When given IV on a mg/kg basis, individuals with body weight ≥100 kg are predicted to have mean steady-state exposures higher than mean values for the patient population. Therefore, tocilizumab doses exceeding 800 mg per infusion are not recommended in patients with RA (see section 2.1 Dosage and Administration). Due to the flat dosing employed for SC administration of tocilizumab, no modifications are necessary by this dosing route.
The pharmacokinetics of tocilizumab in GCA patients was determined using a population pharmacokinetic analysis on a dataset composed of 149 GCA patients treated with 162 mg subcutaneously every week or with 162 mg subcutaneously every other week.
For the 162 mg every week dose, the estimated median (range) steady-state Cmax, Ctrough and Cmean of tocilizumab were 72.1 (12.2–151) mcg/mL, 67.2 (10.7–145) mcg/mL, and 70.6 (11.7–149) mcg/mL, respectively. The accumulation ratios for Cmean or AUCtau, Ctrough, and Cmax were 10.9, 9.6, and 8.9, respectively. Steady state was reached after 17 weeks. For the 162 mg every other week dose, the estimated median (range) steady-state Cmax, Ctrough, and Cmean of tocilizumab were 17.2 (1.1–56.2) mcg/mL, 7.7 (0.1–37.3) mcg/mL, and 13.7 (0.5–49) mcg/mL, respectively. The accumulation ratios for Cmean or AUCtau, Ctrough, and Cmax were 2.8, 5.6, and 2.3 respectively. Steady-state was reached after 14 weeks.
The pharmacokinetics of tocilizumab (TCZ) in PJIA patients was characterized by a population pharmacokinetic analysis which included 188 patients who were treated with TCZ IV or 52 patients treated with TCZ SC.
For doses of 8 mg/kg tocilizumab (patients with a body weight at or above 30 kg) given every 4 weeks intravenously, the estimated median (range) Cmax, Ctrough, and Cmean of tocilizumab at steady state were 181 (114–331) mcg/mL, 3.28 (0.02–35.4) mcg/mL, and 38.6 (22.2–83.8) mcg/mL, respectively. For doses of 10 mg/kg tocilizumab (patients with a body weight less than 30 kg) given every 4 weeks intravenously, the estimated median (range) Cmax, Ctrough, and Cmean of tocilizumab were 167 (125–220) mcg/mL, 0.35 (0–11.8) mcg/mL, and 30.8 (16.0–48.0) mcg/mL, respectively.
The accumulation ratios were 1.05 and 1.16 for AUC4weeks, and 1.43 and 2.22 for Ctrough for 10 mg/kg (BW less than 30 kg) and 8 mg/kg (BW at or above 30 kg) intravenous doses, respectively. No accumulation for Cmax was observed. Following 10 mg/kg and 8 mg/kg TCZ IV every 4 weeks doses in PJIA patients (aged 2 to 17 years), steady state concentrations (trough and average) were within the range of exposures in adult RA patients following 4 mg/kg and 8 mg/kg every 4 weeks, and steady state peak concentrations in PJIA patients were comparable to those following 8 mg/kg every 4 weeks in adult RA patients.
For doses of 162 mg tocilizumab (patients with a body weight at or above 30 kg) given every 2 weeks subcutaneously, the estimated median (range) Cmax, Ctrough, and Cmean of tocilizumab were 29.7 (7.56–50.3) mcg/mL, 12.7 (0.19–23.8) mcg/mL, and 23.0 (3.86–36.9) mcg/mL, respectively. For doses of 162 mg tocilizumab (patients with a body weight less than 30 kg) given every 3 weeks subcutaneously, the estimated median (range) Cmax, Ctrough, and Cmean of tocilizumab were 62.4 (39.4–121) mcg/mL, 13.4 (0.21–52.3) mcg/mL, and 35.7 (17.4–91.8) mcg/mL, respectively.
The accumulation ratios were 1.46 and 2.04 for AUC4weeks, 2.08 and 3.58 for Ctrough, and 1.32 and 1.72 for Cmax, for 162 mg given every 3 weeks (BW less than 30 kg) and 162 mg given every 2 weeks (BW at or above 30 kg) subcutaneous doses, respectively. Following subcutaneous dosing, steady state Ctrough was comparable for patients in the two body weight groups, while steady-state Cmax and Cmean were higher for patients in the less than 30 kg group compared to the group at or above 30 kg. All patients treated with TCZ SC had steady-state Ctrough at or higher than that achieved with TCZ IV across the spectrum of body weights. The average and trough concentrations in patients after subcutaneous dosing were within the range of those achieved in adult patients with RA following the subcutaneous administration of the recommended regimens.
The pharmacokinetics of tocilizumab (TCZ) in SJIA patients was characterized by a population pharmacokinetic analysis which included 89 patients who were treated with TCZ IV or 51 patients treated with TCZ SC.
For doses of 8 mg/kg tocilizumab (patients with a body weight at or above 30 kg) given every 2 weeks intravenously, the estimated median (range) Cmax, Ctrough, and Cmean of tocilizumab were 253 (120–404) mcg/mL, 70.7 (5.26–127) mcg/mL, and 117 (37.6–199) mcg/mL, respectively. For doses of 12 mg/kg tocilizumab (patients with a body weight less than 30 kg) given every 2 weeks intravenously, the estimated median (range) Cmax, Ctrough, and Cmean of tocilizumab were 274 (149–444) mcg/mL, 65.9 (19.0–135) mcg/mL, and 124 (60–194) mcg/mL, respectively.
The accumulation ratios were 1.95 and 2.01 for AUC4weeks, and 3.41 and 3.20 for Ctrough for 12 mg/kg (BW less than 30 kg) and 8 mg/kg (BW at or above 30 kg) intravenous doses, respectively. Accumulation data for Cmax were 1.37 and 1.42 for 12 mg/kg (BW less than 30 kg) and 8 mg/kg (BW at or above 30 kg) intravenous doses, respectively. Following every other week dosing with tocilizumab IV, steady state was reached by 8 weeks for both body weight groups. Mean estimated tocilizumab exposure parameters were similar between the two dose groups defined by body weight.
For doses of 162 mg tocilizumab (patients with a body weight at or above 30 kg) given every week subcutaneously, the estimated median (range) Cmax, Ctrough, and Cmean of tocilizumab were 89.8 (26.4–190) mcg/mL, 72.4 (19.5–158) mcg/mL, and 82.4 (23.9–169) mcg/mL, respectively. For doses of 162 mg tocilizumab (patients with a body weight less than 30 kg) given every 2 weeks subcutaneously, the estimated median (range) Cmax, Ctrough, and Cmean of tocilizumab were 127 (51.7–266) mcg/mL, 64.2 (16.6–136) mcg/mL, and 92.7 (38.5–199) mcg/mL, respectively.
The accumulation ratios were 2.27 and 4.28 for AUC4weeks, 3.21 and 4.39 for Ctrough, and 1.88 and 3.66 for Cmax, for 162 mg given every 2 weeks (BW less than 30 kg) and 162 mg given every week (BW at or above 30 kg) subcutaneous doses, respectively. Following subcutaneous dosing, steady state was reached by 12 weeks for both body weight groups. All patients treated with tocilizumab SC had steady-state Cmax lower than that achieved with tocilizumab IV across the spectrum of body weights. Trough and mean concentrations in patients after SC dosing were similar to those achieved with tocilizumab IV across body weights.
Following subcutaneous dosing in RA and GCA patients, the absorption half-life was around 4 days. The bioavailability for the subcutaneous formulation was 80%.
Following subcutaneous dosing in PJIA patients, the absorption half-life was around 2 days, and the bioavailability for the subcutaneous formulation in PJIA patients was 96%.
Following subcutaneous dosing in SJIA patients, the absorption half-life was around 2 days, and the bioavailability for the SC formulation in SJIA patients was 95%.
In RA patients the median values of Tmax were 2.8 days after the tocilizumab every week dose and 4.7 days after the tocilizumab every other week dose.
In GCA patients, the median values of Tmax were 3 days after the tocilizumab every week dose and 4.5 days after the tocilizumab every other week dose.
Following intravenous dosing, tocilizumab undergoes biphasic elimination from the circulation. In rheumatoid arthritis patients the central volume of distribution was 3.5 L and the peripheral volume of distribution was 2.9 L, resulting in a volume of distribution at steady state of 6.4 L.
In GCA patients, the central volume of distribution was 4.09 L, the peripheral volume of distribution was 3.37 L resulting in a volume of distribution at steady state of 7.46 L.
In pediatric patients with PJIA, the central volume of distribution was 1.98 L, the peripheral volume of distribution was 2.1 L, resulting in a volume of distribution at steady state of 4.08 L.
In pediatric patients with SJIA, the central volume of distribution was 1.87 L, the peripheral volume of distribution was 2.14 L resulting in a volume of distribution at steady state of 4.01 L.
ACTEMRA is eliminated by a combination of linear clearance and nonlinear elimination. The concentration-dependent nonlinear elimination plays a major role at low tocilizumab concentrations. Once the nonlinear pathway is saturated, at higher tocilizumab concentrations, clearance is mainly determined by the linear clearance. The saturation of the nonlinear elimination leads to an increase in exposure that is more than dose-proportional. The pharmacokinetic parameters of ACTEMRA do not change with time.
Population pharmacokinetic analyses in any patient population tested so far indicate no relationship between apparent clearance and the presence of anti-drug antibodies.
The linear clearance in the population pharmacokinetic analysis was estimated to be 12.5 mL per h in RA patients, 6.7 mL per h in GCA patients, 5.8 mL per h in pediatric patients with PJIA, and 5.7 mL per h in pediatric patients with SJIA.
Due to the dependence of total clearance on ACTEMRA serum concentrations, the half-life of ACTEMRA is also concentration-dependent and varies depending on the serum concentration level.
For intravenous administration in RA patients, the concentration-dependent apparent t1/2 is up to 11 days for 4 mg per kg and up to 13 days for 8 mg per kg every 4 weeks in patients with RA at steady-state. For subcutaneous administration in RA patients, the concentration-dependent apparent t1/2 is up to 13 days for 162 mg every week and 5 days for 162 mg every other week in patients with RA at steady-state.
In GCA patients at steady state, the effective t1/2 of tocilizumab varied between 18.3 and 18.9 days for 162 mg subcutaneously every week dosing regimen and between 4.2 and 7.9 days for 162 mg subcutaneously every other week dosing regimen.
The t1/2 of tocilizumab in children with PJIA is up to 17 days for the two body weight categories (8 mg/kg for body weight at or above 30 kg or 10 mg/kg for body weight below 30 kg) during a dosing interval at steady state. For subcutaneous administration, the t1/2 of tocilizumab in PJIA patients is up to 10 days for the two body weight categories (every other week regimen for body weight at or above 30 kg or every 3 week regimen for body weight less than 30 kg) during a dosing interval at steady state.
The t1/2 of tocilizumab intravenous in pediatric patients with SJIA is up to 16 days for the two body weight categories (8 mg/kg for body weight at or above 30 kg and 12 mg/kg for body weight below 30 kg every other week) during a dosing interval at steady-state. Following subcutaneous administration, the effective t1/2 of tocilizumab subcutaneous in SJIA patients is up to 14 days for both the body weight categories (162 mg every week for body weight at or above 30 kg and 162 mg every two weeks for body weight below 30 kg) during a dosing interval at steady state.
Population pharmacokinetic analyses in adult rheumatoid arthritis patients and GCA patients showed that age, gender and race did not affect the pharmacokinetics of tocilizumab. Linear clearance was found to increase with body size. In RA patients, the body weight-based dose (8 mg per kg) resulted in approximately 86% higher exposure in patients who are greater than 100 kg in comparison to patients who are less than 60 kg. There was an inverse relationship between tocilizumab exposure and body weight for flat dose subcutaneous regimens.
In GCA patients, higher exposure was observed in patients with lower body weight. For the 162 mg every week dosing regimen, the steady-state Cmean was 51% higher in patients with body weight less than 60 kg compared to patients weighing between 60 to 100 kg. For the 162 mg every other week regimen, the steady-state Cmean was 129% higher in patients with body weight less than 60 kg compared to patients weighing between 60 to 100 kg. There is limited data for patients above 100 kg (n=7).
No formal study of the effect of hepatic impairment on the pharmacokinetics of tocilizumab was conducted.
No formal study of the effect of renal impairment on the pharmacokinetics of tocilizumab was conducted.
Most of the RA and GCA patients in the population pharmacokinetic analysis had normal renal function or mild renal impairment. Mild renal impairment (estimated creatinine clearance less than 80 mL per min and at or above 50 mL per min based on Cockcroft-Gault formula) did not impact the pharmacokinetics of tocilizumab.
Approximately one-third of the patients in the GCA clinical trial had moderate renal impairment at baseline (estimated creatinine clearance of 30-59 mL/min). No impact on tocilizumab exposure was noted in these patients.
No dose adjustment is required in patients with mild or moderate renal impairment.
In vitro data suggested that IL-6 reduced mRNA expression for several CYP450 isoenzymes including CYP1A2, CYP2B6, CYP2C9, CYP2C19, CYP2D6 and CYP3A4, and this reduced expression was reversed by co-incubation with tocilizumab at clinically relevant concentrations. Accordingly, inhibition of IL-6 signaling in RA patients treated with tocilizumab may restore CYP450 activities to higher levels than those in the absence of tocilizumab leading to increased metabolism of drugs that are CYP450 substrates. Its effect on CYP2C8 or transporters (e.g., P-gp) is unknown. This is clinically relevant for CYP450 substrates with a narrow therapeutic index, where the dose is individually adjusted. Upon initiation of ACTEMRA, in patients being treated with these types of medicinal products, therapeutic monitoring of the effect (e.g., warfarin) or drug concentration (e.g., cyclosporine or theophylline) should be performed and the individual dose of the medicinal product adjusted as needed. Caution should be exercised when ACTEMRA is coadministered with drugs where decrease in effectiveness is undesirable, e.g., oral contraceptives (CYP3A4 substrates) [see Drug Interactions (7.2)].
Simvastatin is a CYP3A4 and OATP1B1 substrate. In 12 RA patients not treated with ACTEMRA, receiving 40 mg simvastatin, exposures of simvastatin and its metabolite, simvastatin acid, was 4- to 10-fold and 2-fold higher, respectively, than the exposures observed in healthy subjects. One week following administration of a single infusion of ACTEMRA (10 mg per kg), exposure of simvastatin and simvastatin acid decreased by 57% and 39%, respectively, to exposures that were similar or slightly higher than those observed in healthy subjects. Exposures of simvastatin and simvastatin acid increased upon withdrawal of ACTEMRA in RA patients. Selection of a particular dose of simvastatin in RA patients should take into account the potentially lower exposures that may result after initiation of ACTEMRA (due to normalization of CYP3A4) or higher exposures after discontinuation of ACTEMRA.
Omeprazole is a CYP2C19 and CYP3A4 substrate. In RA patients receiving 10 mg omeprazole, exposure to omeprazole was approximately 2 fold higher than that observed in healthy subjects. In RA patients receiving 10 mg omeprazole, before and one week after ACTEMRA infusion (8 mg per kg), the omeprazole AUCinf decreased by 12% for poor (N=5) and intermediate metabolizers (N=5) and by 28% for extensive metabolizers (N=8) and were slightly higher than those observed in healthy subjects.
Dextromethorphan is a CYP2D6 and CYP3A4 substrate. In 13 RA patients receiving 30 mg dextromethorphan, exposure to dextromethorphan was comparable to that in healthy subjects. However, exposure to its metabolite, dextrorphan (a CYP3A4 substrate), was a fraction of that observed in healthy subjects. One week following administration of a single infusion of ACTEMRA (8 mg per kg), dextromethorphan exposure was decreased by approximately 5%. However, a larger decrease (29%) in dextrorphan levels was noted after ACTEMRA infusion.
No long-term animal studies have been performed to establish the carcinogenicity potential of tocilizumab. Literature indicates that the IL-6 pathway can mediate anti-tumor responses by promoting increased immune cell surveillance of the tumor microenvironment. However, available published evidence also supports that IL-6 signaling through the IL-6 receptor may be involved in pathways that lead to tumorigenesis. The malignancy risk in humans from an antibody that disrupts signaling through the IL-6 receptor, such as tocilizumab, is presently unknown.
Fertility and reproductive performance were unaffected in male and female mice that received a murine analogue of tocilizumab administered by the intravenous route at a dose of 50 mg/kg every three days.
The efficacy and safety of intravenously administered ACTEMRA was assessed in five randomized, double-blind, multicenter studies in patients greater than 18 years with active rheumatoid arthritis diagnosed according to American College of Rheumatology (ACR) criteria. Patients had at least 8 tender and 6 swollen joints at baseline. ACTEMRA was given intravenously every 4 weeks as monotherapy (Study I), in combination with methotrexate (MTX) (Studies II and III) or other disease-modifying anti-rheumatic drugs (DMARDs) (Study IV) in patients with an inadequate response to those drugs, or in combination with MTX in patients with an inadequate response to TNF antagonists (Study V).
Study I (NCT00109408) evaluated patients with moderate to severe active rheumatoid arthritis who had not been treated with MTX within 24 weeks prior to randomization, or who had not discontinued previous methotrexate treatment as a result of clinically important toxic effects or lack of response. In this study, 67% of patients were MTX-naïve, and over 40% of patients had rheumatoid arthritis less than 2 years. Patients received ACTEMRA 8 mg per kg monotherapy or MTX alone (dose titrated over 8 weeks from 7.5 mg to a maximum of 20 mg weekly). The primary endpoint was the proportion of ACTEMRA patients who achieved an ACR 20 response at Week 24.
Study II (NCT00106535) was a 104-week study with an optional 156-week extension phase that evaluated patients with moderate to severe active rheumatoid arthritis who had an inadequate clinical response to MTX. Patients received ACTEMRA 8 mg per kg, ACTEMRA 4 mg per kg, or placebo every four weeks, in combination with MTX (10 to 25 mg weekly). Upon completion of 52-weeks, patients received open-label treatment with ACTEMRA 8 mg per kg through 104 weeks or they had the option to continue their double-blind treatment if they maintained a greater than 70% improvement in swollen/tender joint count. Two pre-specified interim analyses at week 24 and week 52 were conducted. The primary endpoint at week 24 was the proportion of patients who achieved an ACR 20 response. At weeks 52 and 104, the primary endpoints were change from baseline in modified total Sharp-Genant score and the area under the curve (AUC) of the change from baseline in HAQ-DI score.
Study III (NCT00106548) evaluated patients with moderate to severe active rheumatoid arthritis who had an inadequate clinical response to MTX. Patients received ACTEMRA 8 mg per kg, ACTEMRA 4 mg per kg, or placebo every four weeks, in combination with MTX (10 to 25 mg weekly). The primary endpoint was the proportion of patients who achieved an ACR 20 response at week 24.
Study IV (NCT00106574) evaluated patients who had an inadequate response to their existing therapy, including one or more DMARDs. Patients received ACTEMRA 8 mg per kg or placebo every four weeks, in combination with the stable DMARDs. The primary endpoint was the proportion of patients who achieved an ACR 20 response at week 24.
Study V (NCT00106522) evaluated patients with moderate to severe active rheumatoid arthritis who had an inadequate clinical response or were intolerant to one or more TNF antagonist therapies. The TNF antagonist therapy was discontinued prior to randomization. Patients received ACTEMRA 8 mg per kg, ACTEMRA 4 mg per kg, or placebo every four weeks, in combination with MTX (10 to 25 mg weekly). The primary endpoint was the proportion of patients who achieved an ACR 20 response at week 24.
The percentages of intravenous ACTEMRA-treated patients achieving ACR 20, 50 and 70 responses are shown in Table 3. In all intravenous studies, patients treated with 8 mg per kg ACTEMRA had higher ACR 20, ACR 50, and ACR 70 response rates versus MTX- or placebo-treated patients at week 24.
During the 24 week controlled portions of Studies I to V, patients treated with ACTEMRA at a dose of 4 mg per kg in patients with inadequate response to DMARDs or TNF antagonist therapy had lower response rates compared to patients treated with ACTEMRA 8 mg per kg.
Table 3. Clinical Response at Weeks 24 and 52 in Active and Placebo Controlled Trials of Intravenous ACTEMRA (Percent of Patients):
| Percent of Patients | |||||||||||||
|---|---|---|---|---|---|---|---|---|---|---|---|---|---|
| Response Rate | Study I | Study II | Study III | Study IV | Study V | ||||||||
| MTX | ACTEMRA 8 mg per kg | Placebo + MTX | ACTEMRA 4 mg per kg + MTX | ACTEMRA 8 mg per kg + MTX | Placebo + MTX | ACTEMRA 4 mg per kg + MTX | ACTEMRA 8 mg per kg + MTX | Placebo + DMARDs | ACTEMRA 8 mg per kg + DMARDs | Placebo + MTX | ACTEMRA 4 mg per kg + MTX | ACTEMRA 8 mg per kg + MTX | |
| N=284 | N=286 | N=393 | N=399 | N=398 | N=204 | N=213 | N=205 | N=413 | N=803 | N=158 | N=161 | N=170 | |
| (95% CI)* | (95% CI)* | (95% CI)* | (95% CI)* | (95% CI)* | (95% CI)* | (95% CI)* | (95% CI)* | ||||||
| ACR 20 | |||||||||||||
| Week 24 | 53% | 70% (0.11, 0.27) | 27% | 51% (0.17, 0.29) | 56% (0.23, 0.35) | 27% | 48% (0.15, 0.32) | 59% (0.23, 0.41) | 24% | 61% (0.30, 0.40) | 10% | 30% (0.15, 0.36) | 50% (0.36, 0.56) |
| Week 52 | N/A | N/A | 25% | 47% (0.15, 0.28) | 56% (0.25, 0.38) | N/A | N/A | N/A | N/A | N/A | N/A | N/A | N/A |
| ACR 50 | |||||||||||||
| Week 24 | 34% | 44% (0.04, 0.20) | 10% | 25% (0.09, 0.20) | 32% (0.16, 0.28) | 11% | 32% (0.13, 0.29) | 44% (0.25, 0.41) | 9% | 38% (0.23, 0.33) | 4% | 17% (0.05, 0.25) | 29% (0.21, 0.41) |
| Week 52 | N/A | N/A | 10% | 29% (0.14, 0.25) | 36% (0.21, 0.32) | N/A | N/A | N/A | N/A | N/A | N/A | N/A | N/A |
| ACR 70 | |||||||||||||
| Week 24 | 15% | 28% (0.07, 0.22) | 2% | 11% (0.03, 0.13) | 13% (0.05, 0.15) | 2% | 12% (0.04, 0.18) | 22% (0.12, 0.27) | 3% | 21% (0.13, 0.21) | 1% | 5% (-0.06, 0.14) | 12% (0.03, 0.22) |
| Week 52 | N/A | N/A | 4% | 16% (0.08, 0.17) | 20% (0.12, 0.21) | N/A | N/A | N/A | N/A | N/A | N/A | N/A | N/A |
| Major Clinical Responses† | |||||||||||||
| Week 52 | N/A | N/A | 1% | 4% (0.01, 0.06) | 7% (0.03, 0.09) | N/A | N/A | N/A | N/A | N/A | N/A | N/A | N/A |
* CI: 95% confidence interval of the weighted difference to placebo adjusted for site (and disease duration for Study I only)
† Major clinical response is defined as achieving an ACR 70 response for a continuous 24 week period
In study II, a greater proportion of patients treated with 4 mg per kg and 8 mg per kg ACTEMRA + MTX achieved a low level of disease activity as measured by a DAS 28-ESR less than 2.6 compared with placebo +MTX treated patients at week 52. The proportion of ACTEMRA-treated patients achieving DAS 28-ESR less than 2.6, and the number of residual active joints in these responders in Study II are shown in Table 4.
Table 4. Proportion of Patients with DAS28-ESR Less Than 2.6 with Number of Residual Active Joints in Trials of Intravenous ACTEMRA:
| Study II | |||
|---|---|---|---|
| Placebo + MTX N=393 | ACTEMRA 4 mg per kg + MTX N=399 | ACTEMRA 8 mg per kg + MTX N=398 | |
| DAS28-ESR less than 2.6 | |||
| Proportion of responders at week 52 (n) 95% confidence interval | 3% (12) | 18% (70) 0.10, 0.19 | 32% (127) 0.24, 0.34 |
| Of responders, proportion with 0 active joints (n) | 33% (4) | 27% (19) | 21% (27) |
| Of responders, proportion with 1 active joint (n) | 8% (1) | 19% (13) | 13% (16) |
| Of responders, proportion with 2 active joints (n) | 25% (3) | 13% (9) | 20% (25) |
| Of responders, proportion with 3 or more active joints (n) | 33% (4) | 41% (29) | 47% (59) |
* n denotes numerator of all the percentage. Denominator is the intent-to-treat population. Not all patients received DAS28 assessments at Week 52.
The results of the components of the ACR response criteria for Studies III and V are shown in Table 5. Similar results to Study III were observed in Studies I, II and IV.
Table 5. Components of ACR Response at Week 24 in Trials of Intravenous ACTEMRA:
| Study III | Study V | |||||||||||
|---|---|---|---|---|---|---|---|---|---|---|---|---|
| ACTEMRA 4 mg per kg + MTX | ACTEMRA 8 mg per kg + MTX | Placebo + MTX | ACTEMRA 4 mg per kg + MTX | ACTEMRA 8 mg per kg + MTX | Placebo + MTX | |||||||
| N=213 | N=205 | N=204 | N=161 | N=170 | N=158 | |||||||
| Component (mean) | Baseline | Week 24* | Baseline | Week 24* | Baseline | Week 24 | Baseline | Week 24* | Baseline | Week 24* | Baseline | Week 24 |
| Number of tender joints (0-68) | 33 | 19 -7.0 (-10.0, -4.1) | 32 | 14.5 -9.6 (-12.6, -6.7) | 33 | 25 | 31 | 21 -10.8 (-14.6, -7.1) | 32 | 17 -15.1 (-18.8, -11.4) | 30 | 30 |
| Number of swollen joints (0-66) | 20 | 10 -4.2 (-6.1, -2.3) | 19.5 | 8 -6.2 (-8.1, -4.2) | 21 | 15 | 19.5 | 13 -6.2 (-9.0, -3.5) | 19 | 11 -7.2 (-9.9, -4.5) | 19 | 18 |
| Pain† | 61 | 33 -11.0 (-17.0, -5.0) | 60 | 30 -15.8 (-21.7, -9.9) | 57 | 43 | 63.5 | 43 -12.4 (-22.1, -2.1) | 65 | 33 -23.9 (-33.7, -14.1) | 64 | 48 |
| Patient global assessment† | 66 | 34 -10.9 (-17.1, -4.8) | 65 | 31 -14.9 (-20.9, -8.9) | 64 | 45 | 70 | 46 -10.0 (-20.3, 0.3) | 70 | 36 -17.4 (-27.8, -7.0) | 71 | 51 |
| Physician global assessment† | 64 | 26 -5.6 (-10.5, -0.8) | 64 | 23 -9.0 (-13.8, -4.2) | 64 | 32 | 66.5 | 39 -10.5 (-18.6, -2.5) | 66 | 28 -18.2 (-26.3, -10.0) | 67.5 | 43 |
| Disability index (HAQ)‡ | 1.64 | 1.01 -0.18 (-0.34, -0.02) | 1.55 | 0.96 -0.21 (-0.37, -0.05) | 1.55 | 1.21 | 1.67 | 1.39 -0.25 (-0.42, -0.09) | 1.75 | 1.34 -0.34 (-0.51, -0.17) | 1.70 | 1.58 |
| CRP (mg per dL) | 2.79 | 1.17 -1.30 (-2.0, -0.59) | 2.61 | 0.25 -2.156 (-2.86, -1.46) | 2.36 | 1.89 | 3.11 | 1.77 -1.34 (-2.5, -0.15) | 2.80 | 0.28 -2.52 (-3.72, -1.32) | 3.705 | 3.06 |
* Data shown is mean at week 24, difference in adjusted mean change from baseline compared with placebo + MTX at week 24 and 95% confidence interval for that difference
† Visual analog scale: 0 = best, 100 = worst
‡ Health Assessment Questionnaire: 0 = best, 3 = worst; 20 questions; 8 categories: dressing and grooming, arising, eating, walking, hygiene, reach, grip, and activities
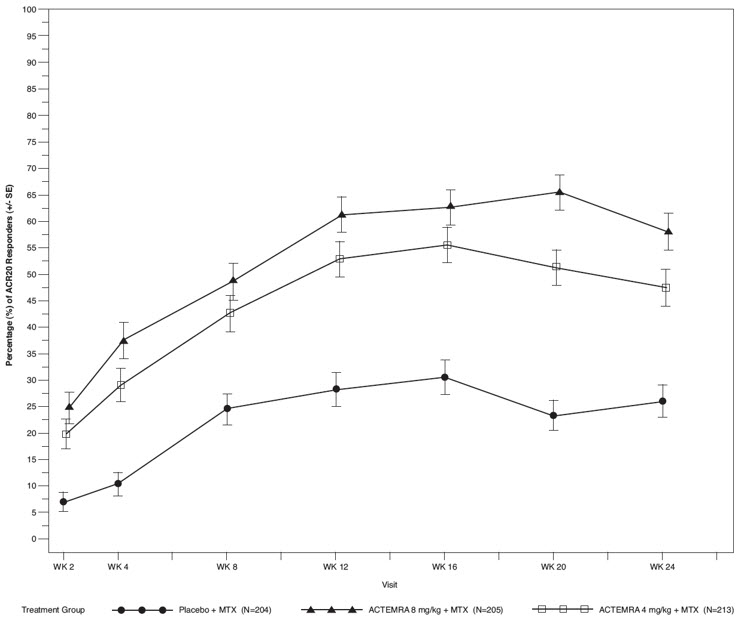
The percent of ACR 20 responders by visit for Study III is shown in Figure 1. Similar response curves were observed in studies I, II, IV, and V.
Figure 1. Percent of ACR 20 Responders by Visit for Study III (Inadequate Response to MTX)*:
In Study II, structural joint damage was assessed radiographically and expressed as change in total Sharp-Genant score and its components, the erosion score and joint space narrowing score. Radiographs of hands/wrists and forefeet were obtained at baseline, 24 weeks, 52 weeks, and 104 weeks and scored by readers unaware of treatments group and visit number. The results from baseline to week 52 are shown in Table 6. ACTEMRA 4 mg per kg slowed (less than 75% inhibition compared to the control group) and ACTEMRA 8 mg per kg inhibited (at least 75% inhibition compared to the control group) the progression of structural damage compared to placebo plus MTX at week 52.
Table 6. Mean Radiographic Change from Baseline to Week 52 in Study II:
| Placebo + MTX | ACTEMRA 4 mg per kg + MTX | ACTEMRA 8 mg per kg + MTX | |
|---|---|---|---|
| N=294 | N=343 | N=353 | |
| Week 52* | |||
| Total Sharp-Genant Score, Mean (SD) | 1.17 (3.14) | 0.33 (1.30) | 0.25 (0.98) |
| Adjusted Mean difference† (95%CI) | -0.83 (-1.13, -0.52) | -0.90 (-1.20, -0.59) | |
| Erosion Score, Mean (SD) | 0.76 (2.14) | 0.20 (0.83) | 0.15 (0.77) |
| Adjusted Mean difference† (95%CI) | -0.55 (-0.76, -0.34) | -0.60 (-0.80, -0.39) | |
| Joint Space Narrowing Score, Mean (SD) | 0.41 (1.71) | 0.13 (0.72) | 0.10 (0.49) |
| Adjusted Mean difference† (95%CI) | -0.28 (-0.44, -0.11) | -0.30 (-0.46, -0.14) | |
SD = standard deviation
* Week 52 analysis employs linearly extrapolated data for patients after escape, withdrawal, or loss to follow up.
† Difference between the adjusted means (ACTEMRA + MTX – Placebo + MTX)
The mean change from baseline to week 104 in Total Sharp-Genant Score for the ACTEMRA 4 mg per kg groups was 0.47 (SD = 1.47) and for the 8 mg per kg groups was 0.34 (SD = 1.24). By the week 104, most patients in the control (placebo + MTX) group had crossed over to active treatment, and results are therefore not included for comparison. Patients in the active groups may have crossed over to the alternate active dose group, and results are reported per original randomized dose group.
In the placebo group, 66% of patients experienced no radiographic progression (Total Sharp-Genant Score change ≤ 0) at week 52 compared to 78% and 83% in the ACTEMRA 4 mg per kg and 8 mg per kg, respectively. Following 104 weeks of treatment, 75% and 83% of patients initially randomized to ACTEMRA 4 mg per kg and 8 mg per kg, respectively, experienced no progression of structural damage compared to 66% of placebo treated patients.
In Study II, physical function and disability were assessed using the Health Assessment Questionnaire Disability Index (HAQ-DI). Both dosing groups of ACTEMRA demonstrated a greater improvement compared to the placebo group in the AUC of change from baseline in the HAQ-DI through week 52. The mean change from baseline to week 52 in HAQ-DI was 0.6, 0.5, and 0.4 for ACTEMRA 8 mg per kg, ACTEMRA 4 mg per kg, and placebo treatment groups, respectively. Sixty-three percent (63%) and sixty percent (60%) of patients in the ACTEMRA 8 mg per kg and ACTEMRA 4 mg per kg treatment groups, respectively, achieved a clinically relevant improvement in HAQ-DI (change from baseline of ≥ 0.3 units) at week 52 compared to 53% in the placebo treatment group.
General health status was assessed by the Short Form Health Survey (SF-36) in Studies I – V. Patients receiving ACTEMRA demonstrated greater improvement from baseline compared to placebo in the Physical Component Summary (PCS), Mental Component Summary (MCS), and in all 8 domains of the SF-36.
Study WA25204 (NCT01331837) was a randomized, open-label (sponsor-blinded), 2-arm parallel-group, multi-center, non-inferiority, cardiovascular (CV) outcomes trial in patients with a diagnosis of moderate to severe RA. This CV safety study was designed to exclude a moderate increase in CV risk in patients treated with ACTEMRA compared with a TNF inhibitor standard of care (etanercept).
The study included 3,080 seropositive RA patients with active disease and an inadequate response to non-biologic disease-modifying anti-rheumatic drugs, who were aged ≥50 years with at least one additional CV risk factor beyond RA. Patients were randomized 1:1 to IV ACTEMRA 8 mg/kg Q4W or SC etanercept 50 mg QW and followed for an average of 3.2 years. The primary endpoint was the comparison of the time-to-first occurrence of any component of a composite of major adverse CV events (MACE; non-fatal myocardial infarction, non-fatal stroke, or CV death), with the final intent-to-treat analysis based on a total of 161 confirmed CV events (83/1538 [5.4%] for ACTEMRA; 78/1542 [5.1%] for etanercept) reviewed by an independent and blinded adjudication committee.
Non-inferiority of ACTEMRA to etanercept for cardiovascular risk was determined by excluding >80% relative increase in the risk of MACE. The estimated hazard ratio (HR) for the risk of MACE comparing ACTEMRA to etanercept was 1.05; 95% CI (0.77, 1.43).
The efficacy and safety of subcutaneously administered ACTEMRA was assessed in two double-blind, controlled, multicenter studies in patients with active RA. One study, SC-I (NCT01194414), was a non-inferiority study that compared the efficacy and safety of ACTEMRA 162 mg administered every week subcutaneously to 8 mg per kg intravenously every four weeks. The second study, SC-II (NCT01232569), was a placebo controlled superiority study that evaluated the safety and efficacy of ACTEMRA 162 mg administered every other week subcutaneously to placebo. Both SC-I and SC-II required patients to be >18 years of age with moderate to severe active rheumatoid arthritis diagnosed according to ACR criteria who had at least 4 tender and 4 swollen joints at baseline (SC-I) or at least 8 tender and 6 swollen joints at baseline (SC-II), and an inadequate response to their existing DMARD therapy, where approximately 20% also had a history of inadequate response to at least one TNF inhibitor. All patients in both SC studies received background non-biologic DMARD.
In SC-I, 1262 patients were randomized 1:1 to receive ACTEMRA-SC 162 mg every week or intravenous ACTEMRA 8 mg/kg every four weeks in combination with DMARD. In SC-II, 656 patients were randomized 2:1 to ACTEMRA-SC 162 mg every other week or placebo, in combination with DMARD. The primary endpoint in both studies was the proportion of patients who achieved an ACR20 response at Week 24.
The clinical response to 24 weeks of ACTEMRA-SC therapy is shown in Table 7. In SC-I, the primary outcome measure was ACR20 at Week 24. The pre-specified non-inferiority margin was a treatment difference of 12%. The study demonstrated non-inferiority of ACTEMRA with respect to ACR20 at Week 24; ACR50, ACR70, and DAS28 responses are also shown in Table 7. In SC-II, a greater portion of patients treated with ACTEMRA 162 mg subcutaneously every other week achieved ACR20, ACR50, and ACR70 responses compared to placebo-treated patients (Table 7). Further, a greater proportion of patients treated with ACTEMRA 162 mg subcutaneously every other week achieved a low level of disease activity as measured by a DAS28-ESR less than 2.6 at Week 24 compared to those treated with placebo (Table 7).
Table 7. Clinical Response at Week 24 in Trials of Subcutaneous ACTEMRA (Percent of Patients):
| SC-I* | SC-II† | |||
|---|---|---|---|---|
| TCZ SC 162 mg every week + DMARD | TCZ IV 8mg/kg + DMARD | TCZ SC 162 mg every other week + DMARD | Placebo + DMARD | |
| N=558 | N=537 | N=437 | N=219 | |
| ACR20 | ||||
| Week 24 | 69% | 73.4% | 61% | 32% |
| Weighted difference (95% CI) | -4% (-9.2, 1.2) | 30% (22.0, 37.0) | ||
| ACR50 | ||||
| Week 24 | 47% | 49% | 40% | 12% |
| Weighted difference (95% CI) | -2% (-7.5, 4.0) | 28% (21.5, 34.4) | ||
| ACR70 | ||||
| Week 24 | 24% | 28% | 20% | 5% |
| Weighted difference (95% CI) | -4% (-9.0, 1.3) | 15% (9.8, 19.9) | ||
| Change in DAS28 [Adjusted mean] | ||||
| Week 24 | -3.5 | -3.5 | -3.1 | -1.7 |
| Adjusted mean difference (95% CI) | 0 (-0.2, 0.1) | -1.4 (-1.7; -1.1) | ||
| DAS28 <2.6 | ||||
| Week 24 | 38.4% | 36.9% | 32.0% | 4.0% |
| Weighted difference (95% CI) | 0.9 (-5.0, 6.8) | 28.6 (22.0, 35.2) | ||
TCZ = tocilizumab
The results of the components of the ACR response criteria and the percent of ACR20 responders by visit for ACTEMRA-SC in Studies SC-I and SC-II were consistent with those observed for ACTEMRA-IV.
In study SC-II, the progression of structural joint damage was assessed radiographically and expressed as a change from baseline in the van der Heijde modified total Sharp score (mTSS). At week 24, significantly less radiographic progression was observed in patients receiving ACTEMRA-SC every other week plus DMARD compared to placebo plus DMARD; mean change from baseline in mTSS of 0.62 vs. 1.23, respectively, with an adjusted mean difference of -0.60 (-1.1, -0.1). These results are consistent with those observed in patients treated with intravenous ACTEMRA.
In studies SC-I and SC-II, the mean decrease from baseline to week 24 in HAQ-DI was 0.6, 0.6, 0.4 and 0.3, and the proportion of patients who achieved a clinically relevant improvement in HAQ-DI (change from baseline of ≥0.3 units) was 65%, 67%, 58% and 47%, for the subcutaneous every week, intravenous 8 mg/kg, subcutaneous every other week, and placebo treatment groups, respectively.
General health status was assessed by the SF-36 in Studies SC-I and SC-II. In Study SC-II, patients receiving ACTEMRA every other week demonstrated greater improvement from baseline compared to placebo in the PCS, MCS, and in all 8 domains of the SF-36. In Study SC-I, improvements in these scores were similar between ACTEMRA-SC every week and ACTEMRA-IV 8 mg/kg.
The efficacy and safety of subcutaneously administered ACTEMRA was assessed in a single, randomized, double-blind, multicenter study in patients with active GCA. In Study WA28119 (NCT01791153), 251 screened patients with new-onset or relapsing GCA were randomized to one of four treatment arms. Two subcutaneous doses of ACTEMRA (162 mg every week and 162 mg every other week) were compared to two different placebo control groups (pre-specified prednisone-taper regimen over 26 weeks and 52 weeks) randomized 2:1:1:1. The study consisted of a 52-week blinded period, followed by a 104-week open-label extension.
All patients received background glucocorticoid (prednisone) therapy. Each of the ACTEMRA-treated groups and one of the placebo-treated groups followed a pre-specified prednisone-taper regimen with the aim to reach 0 mg by 26 weeks, while the second placebo-treated group followed a pre-specified prednisone-taper regimen with the aim to reach 0 mg by 52 weeks designed to be more in keeping with standard practice.
The primary efficacy endpoint was the proportion of patients achieving sustained remission from Week 12 through Week 52. Sustained remission was defined by a patient attaining a sustained (1) absence of GCA signs and symptoms from Week 12 through Week 52, (2) normalization of erythrocyte sedimentation rate (ESR) (to <30 mm/hr without an elevation to ≥ 30 mm/hr attributable to GCA) from Week 12 through Week 52, (3) normalization of C-reactive protein (CRP) (to <1 mg/dL, with an absence of successive elevations to ≥1mg/dL) from Week 12 through Week 52, and (4) successful adherence to the prednisone taper defined by not more than 100 mg of excess prednisone from Week 12 through Week 52. ACTEMRA 162 mg weekly and 162 mg every other week + 26 weeks prednisone taper both showed superiority in achieving sustained remission from Week 12 through Week 52 compared with placebo + 26 weeks prednisone taper (Table 8). Both ACTEMRA treatment arms also showed superiority compared to the placebo + 52 weeks prednisone taper (Table 8).
Table 8. Efficacy Results from Study WA28119:
| PBO + 26 weeks prednisone taper N=50 | PBO + 52 weeks prednisone taper N=51 | TCZ 162mg SC QW + 26 weeks prednisone taper N=100 | TCZ 162 mg SC Q2W + 26 weeks prednisone taper N=49 | |
|---|---|---|---|---|
| Sustained remission* | ||||
| Responders, n (%) | 7 (14.0%) | 9 (17.6%) | 56 (56.0%) | 26 (53.1%) |
| Unadjusted difference in proportions vs PBO + 26 weeks taper (99.5% CI) | N/A | N/A | 42.0% (18.0, 66.0) | 39.1% (12.5 , 65.7) |
| Unadjusted difference in proportions vs PBO + 52 weeks taper (99.5% CI) | N/A | N/A | 38.4% (14.4, 62.3) | 35.4% (8.6, 62.2) |
| Components of Sustained Remission | ||||
| Sustained absence of GCA signs and symptoms†, n (%) | 20 (40.0%) | 23 (45.1%) | 69 (69.0%) | 28 (57.1%) |
| Sustained ESR<30 mm/hr‡, n (%) | 20 (40.0%) | 22 (43.1%) | 83 (83.0%) | 37 (75.5%) |
| Sustained CRP normalization§, n (%) | 17 (34.0%) | 13 (25.5%) | 72 (72.0%) | 34 (69.4%) |
| Successful prednisone tapering¶, n (%) | 10 (20.0%) | 20 (39.2%) | 60 (60.0%) | 28 (57.1%) |
Patients not completing the study to week 52 were classified as non-responders in the primary and key secondary analysis:
PBO+26: 6 (12.0%), PBO+52: 5 (9.8%), TCZ QW: 15 (15.0%), TCZ Q2W: 9 (18.4%).
CRP = C-reactive protein
ESR = erythrocyte sedimentation rate
PBO = placebo
Q2W = every other week dose
QW = every week dose
TCZ = tocilizumab
* Sustained remission was achieved by a patient meeting all of the following components: absence of GCA signs and symptoms, normalization of ESR, normalization of CRP and adherence to the prednisone taper regimen
† Patients who did not have any signs or symptoms of GCA recorded from Week 12 up to Week 52.
‡ Patients who did not have an elevated ESR ≥30 mm/hr which was classified as attributed to GCA from Week 12 up to Week 52.
§ Patients who did not have two or more consecutive CRP records of ≥1mg/dL from Week 12 up to Week 52.
¶ Patients who did not enter escape therapy and received ≤100mg of additional concomitant prednisone from Week 12 up to Week 52.
The estimated annual cumulative prednisone dose was lower in the two ACTEMRA dose groups (medians of 1887 mg and 2207 mg on ACTEMRA QW and Q2W, respectively) relative to the placebo arms (medians of 3804 mg and 3902 mg on placebo + 26 weeks prednisone and placebo + 52 weeks prednisone taper, respectively).
The efficacy of ACTEMRA was assessed in a three-part study, WA19977 (NCT00988221), including an open-label extension in children 2 to 17 years of age with active polyarticular juvenile idiopathic arthritis (PJIA), who had an inadequate response to methotrexate or inability to tolerate methotrexate. Patients had at least 6 months of active disease (mean disease duration of 4.2 ± 3.7 years), with at least five joints with active arthritis (swollen or limitation of movement accompanied by pain and/or tenderness) and/or at least 3 active joints having limitation of motion (mean, 20 ± 14 active joints). The patients treated had subtypes of JIA that at disease onset included Rheumatoid Factor Positive or Negative Polyarticular JIA, or Extended Oligoarticular JIA. Treatment with a stable dose of methotrexate was permitted but was not required during the study. Concurrent use of disease modifying antirheumatic drugs (DMARDs), other than methotrexate, or other biologics (e.g., TNF antagonists or T cell costimulation modulator) were not permitted in the study.
Part I consisted of a 16-week active ACTEMRA treatment lead-in period (n=188) followed by Part II, a 24-week randomized double-blind placebo-controlled withdrawal period, followed by Part III, a 64-week open-label period. Eligible patients weighing at or above 30 kg received ACTEMRA at 8 mg/kg intravenously once every four weeks. Patients weighing less than 30 kg were randomized 1:1 to receive either ACTEMRA 8 mg/kg or 10 mg/kg intravenously every four weeks. At the conclusion of the open-label Part I, 91% of patients taking background MTX in addition to tocilizumab and 83% of patients on tocilizumab monotherapy achieved an ACR 30 response at week 16 compared to baseline and entered the blinded withdrawal period (Part II) of the study. The proportions of patients with JIA ACR 50/70 responses in Part I were 84.0%, and 64%, respectively for patients taking background MTX in addition to tocilizumab and 80% and 55% respectively for patients on tocilizumab monotherapy.
In Part II, patients (ITT, n=163) were randomized to ACTEMRA (same dose received in Part I) or placebo in a 1:1 ratio that was stratified by concurrent methotrexate use and concurrent corticosteroid use. Each patient continued in Part II of the study until Week 40 or until the patient satisfied JIA ACR 30 flare criteria (relative to Week 16) and qualified for escape.
The primary endpoint was the proportion of patients with a JIA ACR 30 flare at week 40 relative to week 16. JIA ACR 30 flare was defined as 3 or more of the 6 core outcome variables worsening by at least 30% with no more than 1 of the remaining variables improving by more than 30% relative to Week 16.
ACTEMRA treated patients experienced significantly fewer disease flares compared to placebo-treated patients (26% [21/82] versus 48% [39/81]; adjusted difference in proportions -21%, 95% CI: -35%, -8%).
During the withdrawal phase (Part II), more patients treated with ACTEMRA showed JIA ACR 30/50/70 responses at Week 40 compared to patients withdrawn to placebo.
Subcutaneously administered ACTEMRA in pediatric patients with polyarticular juvenile idiopathic arthritis (PJIA) was assessed in WA28117 (NCT01904279), a 52-week, open-label, multicenter, PK-PD and safety study to determine the appropriate subcutaneous dose of ACTEMRA that achieved comparable PK/PD profiles to the ACTEMRA-IV regimen. PJIA patients aged 1 to 17 years with an inadequate response or inability to tolerate MTX, including patients with well-controlled disease on treatment with ACTEMRA-IV and ACTEMRA-naïve patients with active disease, were treated with subcutaneous ACTEMRA based on body weight.
Patients weighing at or above 30 kg (n=25) were treated with 162 mg of ACTEMRA-SC every 2 weeks and patients weighing less than 30 kg (n=27) received 162 mg of ACTEMRA-SC every 3 weeks for 52 weeks. Of these 52 patients, 37 (71%) were naive to ACTEMRA and 15 (29%) had been receiving ACTEMRA-IV and switched to ACTEMRA-SC at baseline.
The efficacy of subcutaneous ACTEMRA in children 2 to 17 years of age is based on pharmacokinetic exposure and extrapolation of the established efficacy of intravenous ACTEMRA in polyarticular JIA patients and subcutaneous ACTEMRA in patients with RA [see Clinical Pharmacology (12.3) and Clinical Studies (14.2 and 14.4)].
The efficacy of ACTEMRA for the treatment of active SJIA was assessed in WA18221 (NCT00642460), a 12-week randomized, double blind, placebo-controlled, parallel group, 2-arm study. Patients treated with or without MTX, were randomized (ACTEMRA:placebo = 2:1) to one of two treatment groups: 75 patients received ACTEMRA infusions every two weeks at either 8 mg per kg for patients at or above 30 kg or 12 mg per kg for patients less than 30 kg and 37 were randomized to receive placebo infusions every two weeks. Corticosteroid tapering could occur from week six for patients who achieved a JIA ACR 70 response. After 12 weeks or at the time of escape, due to disease worsening, patients were treated with ACTEMRA in the open-label extension phase at weight appropriate dosing.
The primary endpoint was the proportion of patients with at least 30% improvement in JIA ACR core set (JIA ACR 30 response) at Week 12 and absence of fever (no temperature at or above 37.5°C in the preceding 7 days). JIA ACR (American College of Rheumatology) responses are defined as the percentage improvement (e.g., 30%, 50%, 70%) in 3 of any 6 core outcome variables compared to baseline, with worsening in no more than 1 of the remaining variables by 30% or more. Core outcome variables consist of physician global assessment, parent per patient global assessment, number of joints with active arthritis, number of joints with limitation of movement, erythrocyte sedimentation rate (ESR), and functional ability (childhood health assessment questionnaire-CHAQ).
Primary endpoint result and JIA ACR response rates at Week 12 are shown in Table 9.
Table 9. Efficacy Findings at Week 12:
| ACTEMRA N=75 | Placebo N=37 | |
|---|---|---|
| Primary Endpoint: JIA ACR 30 response + absence of fever | ||
| Responders | 85% | 24% |
| Weighted difference (95% CI) | 62 (45, 78) | - |
| JIA ACR Response Rates at Week 12 | ||
| JIA ACR 30 | ||
| Responders | 91% | 24% |
| Weighted difference* (95% CI)† | 67 (51, 83) | - |
| JIA ACR 50 | ||
| Responders | 85% | 11% |
| Weighted difference* (95% CI)† | 74 (58, 90) | - |
| JIA ACR 70 | ||
| Responders | 71% | 8% |
| Weighted difference* (95% CI)† | 63 (46, 80) | - |
* The weighted difference is the difference between the ACTEMRA and Placebo response rates, adjusted for the stratification factors (weight, disease duration, background oral corticosteroid dose and background methotrexate use).
† CI: confidence interval of the weighted difference.
The treatment effect of ACTEMRA was consistent across all components of the JIA ACR response core variables. JIA ACR scores and absence of fever responses in the open label extension were consistent with the controlled portion of the study (data available through 44 weeks).
Of patients with fever or rash at baseline, those treated with ACTEMRA had fewer systemic features; 35 out of 41 (85%) became fever free (no temperature recording at or above 37.5°C in the preceding 14 days) compared to 5 out of 24 (21%) of placebo-treated patients, and 14 out of 22 (64%) became free of rash compared to 2 out of 18 (11%) of placebo-treated patients. Responses were consistent in the open label extension (data available through 44 weeks).
Of the patients receiving oral corticosteroids at baseline, 8 out of 31 (26%) placebo and 48 out of 70 (69%), ACTEMRA patients achieved a JIA ACR 70 response at week 6 or 8 enabling corticosteroid dose reduction. Seventeen (24%) ACTEMRA patients versus 1 (3%) placebo patient were able to reduce the dose of corticosteroid by at least 20% without experiencing a subsequent JIA ACR 30 flare or occurrence of systemic symptoms to week 12. In the open label portion of the study, by week 44, there were 44 out of 103 (43%) ACTEMRA patients off oral corticosteroids. Of these 44 patients 50% were off corticosteroids 18 weeks or more.
Physical function and disability were assessed using the Childhood Health Assessment Questionnaire Disability Index (CHAQ-DI). Seventy-seven percent (58 out of 75) of patients in the ACTEMRA treatment group achieved a minimal clinically important improvement in CHAQ-DI (change from baseline of ≥0.13 units) at week 12 compared to 19% (7 out of 37) in the placebo treatment group.
Subcutaneously administered ACTEMRA in pediatric patients with systemic juvenile idiopathic arthritis (SJIA) was assessed in WA28118 (NCT01904292), a 52-week, open-label, multicenter, PK-PD and safety study to determine the appropriate subcutaneous dose of ACTEMRA that achieved comparable PK/PD profiles to the ACTEMRA-IV regimen.
Eligible patients received ACTEMRA subcutaneously dosed according to body weight, with patients weighing at or above 30 kg (n=26) dosed with 162 mg of ACTEMRA every week and patients weighing below 30 kg (n=25) dosed with 162 mg of ACTEMRA every 10 days (n=8) or every 2 weeks (n=17) for 52 weeks. Of these 51 patients, 26 (51%) were naive to subcutaneous ACTEMRA and 25 (49%) had been receiving ACTEMRA intravenously and switched to subcutaneous ACTEMRA at baseline.
The efficacy of subcutaneous ACTEMRA in children 2 to 17 years of age is based on pharmacokinetic exposure and extrapolation of the established efficacy of intravenous ACTEMRA in systemic JIA patients [see Clinical Pharmacology (12.3) and Clinical Studies (14.6)].
The efficacy of ACTEMRA for the treatment of CRS was assessed in a retrospective analysis of pooled outcome data from clinical trials of CAR T-cell therapies for hematological malignancies. Evaluable patients had been treated with tocilizumab 8 mg/kg (12 mg/kg for patients <30 kg) with or without additional high-dose corticosteroids for severe or life-threatening CRS; only the first episode of CRS was included in the analysis. The study population included 24 males and 21 females (total 45 patients) of median age 12 years (range, 3–23 years); 82% were Caucasian. The median time from start of CRS to first dose of tocilizumab was 4 days (range, 0-18 days). Resolution of CRS was defined as lack of fever and off vasopressors for at least 24 hours. Patients were considered responders if CRS resolved within 14 days of the first dose of tocilizumab, if no more than 2 doses of tocilizumab were needed, and if no drugs other than tocilizumab and corticosteroids were used for treatment. Thirty-one patients (69%; 95% CI: 53%–82%) achieved a response. Achievement of resolution of CRS within 14 days was confirmed in a second study using an independent cohort that included 15 patients (range: 9–75 years old) with CAR T cell-induced CRS.
© All content on this website, including data entry, data processing, decision support tools, "RxReasoner" logo and graphics, is the intellectual property of RxReasoner and is protected by copyright laws. Unauthorized reproduction or distribution of any part of this content without explicit written permission from RxReasoner is strictly prohibited. Any third-party content used on this site is acknowledged and utilized under fair use principles.