AVANDIA Film-coated tablet Ref.[10540] Active ingredients: Rosiglitazone
Source: FDA, National Drug Code (US) Revision Year: 2020
12.1. Mechanism of Action
Rosiglitazone, a member of the thiazolidinedione class of antidiabetic agents, improves glycemic control by improving insulin sensitivity. Rosiglitazone is a highly selective and potent agonist for the peroxisome proliferator-activated receptor-gamma (PPARγ). In humans, PPAR receptors are found in key target tissues for insulin action such as adipose tissue, skeletal muscle, and liver. Activation of PPARγ nuclear receptors regulates the transcription of insulin-responsive genes involved in the control of glucose production, transport, and utilization. In addition, PPARγ-responsive genes also participate in the regulation of fatty acid metabolism.
Insulin resistance is a common feature characterizing the pathogenesis of type 2 diabetes. The antidiabetic activity of rosiglitazone has been demonstrated in animal models of type 2 diabetes in which hyperglycemia and/or impaired glucose tolerance is a consequence of insulin resistance in target tissues. Rosiglitazone reduces blood glucose concentrations and reduces hyperinsulinemia in the ob/ob obese mouse, db/db diabetic mouse, and fa/fa fatty Zucker rat.
In animal models, the antidiabetic activity of rosiglitazone was shown to be mediated by increased sensitivity to insulin's action in the liver, muscle, and adipose tissues. Pharmacological studies in animal models indicate that rosiglitazone inhibits hepatic gluconeogenesis. The expression of the insulin-regulated glucose transporter GLUT-4 was increased in adipose tissue. Rosiglitazone did not induce hypoglycemia in animal models of type 2 diabetes and/or impaired glucose tolerance.
12.2. Pharmacodynamics
Patients with lipid abnormalities were not excluded from clinical trials of AVANDIA. In all 26-week controlled trials, across the recommended dose range, AVANDIA as monotherapy was associated with increases in total cholesterol, LDL, and HDL, and decreases in free fatty acids. These changes were statistically significantly different from placebo or glyburide controls (Table 7).
Increases in LDL occurred primarily during the first 1 to 2 months of therapy with AVANDIA and LDL levels remained elevated above baseline throughout the trials. In contrast, HDL continued to rise over time. As a result, the LDL/HDL ratio peaked after 2 months of therapy and then appeared to decrease over time. Because of the temporal nature of lipid changes, the 52-week, glyburide-controlled trial is most pertinent to assess long-term effects on lipids. At baseline, Week 26, and Week 52, mean LDL/HDL ratios were 3.1, 3.2, and 3.0, respectively, for AVANDIA 4 mg twice daily. The corresponding values for glyburide were 3.2, 3.1, and 2.9. The differences in change from baseline between AVANDIA and glyburide at Week 52 were statistically significant.
The pattern of LDL and HDL changes following therapy with AVANDIA in combination with other hypoglycemic agents were generally similar to those seen with AVANDIA as monotherapy.
The changes in triglycerides during therapy with AVANDIA were variable and were generally not statistically different from placebo or glyburide controls.
Table 7. Summary of Mean Lipid Changes in 26-Week, Placebo-Controlled and 52-Week, Glyburide-Controlled Monotherapy Trials:
| Parameter | Placebo-Controlled Trials Week 26 | Glyburide-Controlled Trial Week 26 and Week 52 | |||||
|---|---|---|---|---|---|---|---|
| Placebo | AVANDIA | Glyburide Titration | AVANDIA 8 mg | ||||
| 4 mg Dailya | 8 mg Dailya | Week 26 | Week 52 | Week 26 | Week 52 | ||
| Free fatty acids | |||||||
| n | 207 | 428 | 436 | 181 | 168 | 166 | 145 |
| Baseline (mean) | 18.1 | 17.5 | 17.9 | 26.4 | 26.4 | 26.9 | 26.6 |
| % Change from baseline (mean) | +0.2% | -7.8% | -14.7% | -2.4% | -4.7% | -20.8% | -21.5% |
| LDL | |||||||
| n | 190 | 400 | 374 | 175 | 160 | 161 | 133 |
| Baseline (mean) | 123.7 | 126.8 | 125.3 | 142.7 | 141.9 | 142.1 | 142.1 |
| % Change from baseline (mean) | +4.8% | +14.1% | +18.6% | -0.9% | -0.5% | +11.9% | +12.1% |
| HDL | |||||||
| n | 208 | 429 | 436 | 184 | 170 | 170 | 145 |
| Baseline (mean) | 44.1 | 44.4 | 43.0 | 47.2 | 47.7 | 48.4 | 48.3 |
| % Change from baseline (mean) | +8.0% | +11.4% | +14.2% | +4.3% | +8.7% | +14.0% | +18.5% |
a Once-daily and twice-daily dosing groups were combined.
12.3. Pharmacokinetics
Maximum plasma concentration (Cmax) and the area under the curve (AUC) of rosiglitazone increase in a dose-proportional manner over the therapeutic dose range (Table 8). The elimination half-life is 3 to 4 hours and is independent of dose.
Table 8. Mean (SD) Pharmacokinetic Parameters for Rosiglitazone following Single Oral Doses (N=32):
| Parameter | 1 mg Fasting | 2 mg Fasting | 8 mg Fasting | 8 mg Fed |
|---|---|---|---|---|
| AUC0-inf (ng.h/mL) | 358 (112) | 733 (184) | 2,971 (730) | 2,890 (795) |
| Cmax (ng/mL) | 76 (13) | 156 (42) | 598 (117) | 432 (92) |
| t½ (h) | 3.16 (0.72) | 3.15 (0.39) | 3.37 (0.63) | 3.59 (0.70) |
| CL/F (L/h) | 3.03 (0.87) | 2.89 (0.71) | 2.85 (0.69) | 2.97 (0.81) |
AUC = area under the curve; Cmax = maximum concentration; t½ = terminal half-life; CL/F = Oral clearance.
Absorption
The absolute bioavailability of rosiglitazone is 99%. Peak plasma concentrations are observed about 1 hour after dosing. Administration of rosiglitazone with food resulted in no change in overall exposure (AUC), but there was an approximately 28% decrease in Cmax and a delay in Tmax (1.75 hours). These changes are not likely to be clinically significant; therefore, AVANDIA may be administered with or without food.
Distribution
The mean (CV%) oral volume of distribution (Vss/F) of rosiglitazone is approximately 17.6 (30%) liters, based on a population pharmacokinetic analysis. Rosiglitazone is approximately 99.8% bound to plasma proteins, primarily albumin.
Metabolism
Rosiglitazone is extensively metabolized with no unchanged drug excreted in the urine. The major routes of metabolism were N-demethylation and hydroxylation, followed by conjugation with sulfate and glucuronic acid. All the circulating metabolites are considerably less potent than parent and, therefore, are not expected to contribute to the insulin-sensitizing activity of rosiglitazone.
In vitro data demonstrate that rosiglitazone is predominantly metabolized by cytochrome P450 (CYP) isoenzyme 2C8, with CYP2C9 contributing as a minor pathway.
Excretion
Following oral or intravenous administration of [ 14C]rosiglitazone maleate, approximately 64% and 23% of the dose was eliminated in the urine and in the feces, respectively. The plasma half-life of [ 14C]related material ranged from 103 to 158 hours.
Population Pharmacokinetics in Patients with Type 2 Diabetes
Population pharmacokinetic analyses from 3 large clinical trials including 642 men and 405 women with type 2 diabetes (aged 35 to 80 years) showed that the pharmacokinetics of rosiglitazone are not influenced by age, race, smoking, or alcohol consumption. Both oral clearance (CL/F) and oral steady-state volume of distribution (Vss/F) were shown to increase with increases in body weight. Over the weight range observed in these analyses (50 to 150 kg), the range of predicted CL/F and Vss/F values varied by <1.7-fold and <2.3-fold, respectively. Additionally, rosiglitazone CL/F was shown to be influenced by both weight and gender, being lower (about 15%) in female patients.
Specific Populations
Geriatric Patients
Results of the population pharmacokinetic analysis (n=716 <65 years; n=331 ≥65 years) showed that age does not significantly affect the pharmacokinetics of rosiglitazone.
Male and Female Patients
Results of the population pharmacokinetics analysis showed that the mean oral clearance of rosiglitazone in female patients (n=405) was approximately 6% lower compared with male patients of the same body weight (n=642).
As monotherapy and in combination with metformin, AVANDIA improved glycemic control in both males and females. In metformin combination trials, efficacy was demonstrated with no gender differences in glycemic response.
In monotherapy trials, a greater therapeutic response was observed in females; however, in more obese patients, gender differences were less evident. For a given BMI, females tend to have a greater fat mass than males. Since the molecular target PPARγ is expressed in adipose tissues, this differentiating characteristic may account, at least in part, for the greater response to AVANDIA in females. Since therapy should be individualized, no dose adjustments are necessary based on gender alone.
Patients with Hepatic Impairment
Unbound oral clearance of rosiglitazone was significantly lower in patients with moderate to severe liver disease (Child-Pugh Class B/C) compared with healthy subjects. As a result, unbound Cmax and AUC0-inf were increased 2- and 3-fold, respectively. Elimination half-life for rosiglitazone was about 2 hours longer in patients with liver disease, compared with healthy subjects.
Therapy with AVANDIA should not be initiated if the patient exhibits clinical evidence of active liver disease or increased serum transaminase levels (ALT >2.5X upper limit of normal) at baseline [see Warnings and Precautions (5.5)].
Pediatric Patients
Pharmacokinetic parameters of rosiglitazone in pediatric patients were established using a population pharmacokinetic analysis with sparse data from 96 pediatric patients in a single pediatric clinical trial including 33 males and 63 females with ages ranging from 10 to 17 years (weights ranging from 35 to 178.3 kg). Population mean CL/F and V/F of rosiglitazone were 3.15 L/h and 13.5 L, respectively. These estimates of CL/F and V/F were consistent with the typical parameter estimates from a prior adult population analysis.
Patients with Renal Impairment
There are no clinically relevant differences in the pharmacokinetics of rosiglitazone in patients with mild to severe renal impairment or in hemodialysis-dependent patients compared with subjects with normal renal function. No dosage adjustment is therefore required in such patients receiving AVANDIA. Since metformin is contraindicated in patients with renal impairment, coadministration of metformin with AVANDIA is contraindicated in these patients.
Racial and Ethnic Groups
Results of a population pharmacokinetic analysis including subjects of Caucasian, black, and other ethnic origins indicate that race has no influence on the pharmacokinetics of rosiglitazone.
Drug Interaction Studies
Drugs that Inhibit, Induce, or are Metabolized by Cytochrome P450
In vitro drug metabolism studies suggest that rosiglitazone does not inhibit any of the major P450 enzymes at clinically relevant concentrations. In vitro data demonstrate that rosiglitazone is predominantly metabolized by CYP2C8, and to a lesser extent, 2C9. AVANDIA (4 mg twice daily) was shown to have no clinically relevant effect on the pharmacokinetics of nifedipine and oral contraceptives (ethinyl estradiol and norethindrone), which are predominantly metabolized by CYP3A4.
Gemfibrozil
Concomitant administration of gemfibrozil (600 mg twice daily), an inhibitor of CYP2C8, and rosiglitazone (4 mg once daily) for 7 days increased rosiglitazone AUC by 127%, compared with the administration of rosiglitazone (4 mg once daily) alone. Given the potential for dose-related adverse events with rosiglitazone, a decrease in the dose of rosiglitazone may be needed when gemfibrozil is introduced [see Drug Interactions (7.1)].
Rifampin
Rifampin administration (600 mg once a day), an inducer of CYP2C8, for 6 days is reported to decrease rosiglitazone AUC by 66%, compared with the administration of rosiglitazone (8 mg) alone [see Drug Interactions (7.1)].1
Glyburide
AVANDIA (2 mg twice daily) taken concomitantly with glyburide (3.75 to 10 mg/day) for 7 days did not alter the mean steady-state 24-hour plasma glucose concentrations in diabetic patients stabilized on glyburide therapy. Repeat doses of AVANDIA (8 mg once daily) for 8 days in healthy adult Caucasian subjects caused a decrease in glyburide AUC and Cmax of approximately 30%. In Japanese subjects, glyburide AUC and Cmax slightly increased following coadministration of AVANDIA.
Glimepiride
Single oral doses of glimepiride in 14 healthy adult subjects had no clinically significant effect on the steady-state pharmacokinetics of AVANDIA. No clinically significant reductions in glimepiride AUC and Cmax were observed after repeat doses of AVANDIA (8 mg once daily) for 8 days in healthy adult subjects.
Metformin
Concurrent administration of AVANDIA (2 mg twice daily) and metformin (500 mg twice daily) in healthy volunteers for 4 days had no effect on the steady-state pharmacokinetics of either metformin or rosiglitazone.
Acarbose
Coadministration of acarbose (100 mg three times daily) for 7 days in healthy volunteers had no clinically relevant effect on the pharmacokinetics of a single oral dose of AVANDIA.
Digoxin
Repeat oral dosing of AVANDIA (8 mg once daily) for 14 days did not alter the steady-state pharmacokinetics of digoxin (0.375 mg once daily) in healthy volunteers.
Warfarin
Repeat dosing with AVANDIA had no clinically relevant effect on the steady-state pharmacokinetics of warfarin enantiomers.
Ethanol
A single administration of a moderate amount of alcohol did not increase the risk of acute hypoglycemia in patients with type 2 diabetes mellitus treated with AVANDIA.
Ranitidine
Pre-treatment with ranitidine (150 mg twice daily for 4 days) did not alter the pharmacokinetics of either single oral or intravenous doses of rosiglitazone in healthy volunteers. These results suggest that the absorption of oral rosiglitazone is not altered in conditions accompanied by increases in gastrointestinal pH.
13.1. Carcinogenesis, Mutagenesis, Impairment of Fertility
Carcinogenesis
A 2-year carcinogenicity study was conducted in CD-1 mice at doses of 0.4, 1.5, and 6 mg/kg/day in the diet (highest dose equivalent to approximately 12 times human AUC at the MRHD). Sprague-Dawley rats were dosed for 2 years by oral gavage at doses of 0.05, 0.3, and 2 mg/kg/day (highest dose equivalent to approximately 10 and 20 times human AUC at the MRHD for male and female rats, respectively).
Rosiglitazone was not carcinogenic in the mouse. There was an increase in incidence of adipose hyperplasia in the mouse at doses ≥1.5 mg/kg/day (approximately 2 times human AUC at the MRHD). In rats, there was a significant increase in the incidence of benign adipose tissue tumors (lipomas) at doses ≥0.3 mg/kg/day (approximately 2 times human AUC at the MRHD). These proliferative changes in both species are considered due to the persistent pharmacological overstimulation of adipose tissue.
Mutagenesis
Rosiglitazone was not mutagenic or clastogenic in the in vitro bacterial assays for gene mutation, the in vitro chromosome aberration test in human lymphocytes, the in vivo mouse micronucleus test, and the in vivo/in vitro rat UDS assay.
Impairment of Fertility
Rosiglitazone had no effects on mating or fertility of male rats given up to 40 mg/kg/day (approximately 116 times the MRHD based on AUC). Rosiglitazone altered estrous cyclicity (2 mg/kg/day) and reduced fertility (40 mg/kg/day) of female rats in association with lower plasma levels of progesterone and estradiol (approximately 20 and 200 times the MRHD based on AUC, respectively). No such effects were noted at 0.2 mg/kg/day (approximately 4 times the MRHD based on AUC). In monkeys, rosiglitazone (0.6 and 4.6 mg/kg/day; approximately 3 and 15 times the MRHD based on AUC, respectively) reversibly diminished the follicular phase rise in serum estradiol with consequential reduction in the luteinizing hormone surge, lower luteal phase progesterone levels, and amenorrhea. The mechanism for these effects appears to be direct inhibition of ovarian steroidogenesis.
13.2. Animal Toxicology and/or Pharmacology
Heart weights were increased in mice (3 mg/kg/day), rats (5 mg/kg/day), and dogs (2 mg/kg/day) with rosiglitazone treatment (approximately 5, 22, and 2 times the MRHD based on AUC, respectively). Morphometric measurement indicated cardiac ventricular hypertrophy, which may be due to increased cardiac work as a result of plasma volume expansion.
14. Clinical Studies
14.1 Monotherapy
In clinical trials, treatment with AVANDIA resulted in an improvement in glycemic control, as measured by FPG and HbA1c, with a concurrent reduction in insulin and C-peptide. Postprandial glucose and insulin were also reduced. This is consistent with the mechanism of action of AVANDIA as an insulin sensitizer.
The MRHD is 8 mg. Dose-ranging trials suggested that no additional benefit was obtained with a total daily dose of 12 mg.
Short-term Clinical Trials
A total of 2,315 patients with type 2 diabetes, previously treated with diet alone or antidiabetic medication(s), were treated with AVANDIA as monotherapy in 6 double-blind trials, which included two 26-week, placebo-controlled trials; one 52-week, glyburide-controlled trial; and 3 placebo-controlled, dose-ranging trials of 8 to 12 weeks' duration. Previous antidiabetic medication(s) were withdrawn, and patients entered a 2- to 4-week placebo run-in period prior to randomization.
Two 26-week, double-blind, placebo-controlled trials, in patients with type 2 diabetes (n=1,401) with inadequate glycemic control [mean baseline FPG approximately 228 mg/dL (101 to 425 mg/dL) and mean baseline HbA1c 8.9% (5.2% to 16.2%)], were conducted. Treatment with AVANDIA produced statistically significant improvements in FPG and HbA1c compared with baseline and relative to placebo. Data from one of these trials are summarized in Table 9.
Table 9. Glycemic Parameters in a 26-Week, Placebo-Controlled Trial:
| Parameter | Placebo | AVANDIA | AVANDIA | ||
|---|---|---|---|---|---|
| 4 mg Once Daily | 2 mg Twice Daily | 8 mg Once Daily | 4 mg Twice Daily | ||
| n=173 | n=180 | n=186 | n=181 | n=187 | |
| FPG (mg/dL) | |||||
| Baseline (mean) | 225 | 229 | 225 | 228 | 228 |
| Change from baseline (mean) | 8 | -25 | -35 | -42 | -55 |
| Difference from placebo (adjusted mean) | – | -31a | -43a | -49a | -62a |
| % of patients with ≥30 mg/dL decrease from baseline | 19% | 45% | 54% | 58% | 70% |
| HbA1c (%) | |||||
| Baseline (mean) | 8.9 | 8.9 | 8.9 | 8.9 | 9.0 |
| Change from baseline (mean) | 0.8 | 0.0 | -0.1 | -0.3 | -0.7 |
| Difference from placebo (adjusted mean) | – | -0.8a | -0.9a | -1.1a | -1.5a |
| % of patients with ≥0.7% decrease from baseline | 9% | 28% | 29% | 39% | 54% |
a P <0.0001 compared with placebo.
When administered at the same total daily dose, AVANDIA was generally more effective in reducing FPG and HbA1c when administered in divided doses twice daily compared with once-daily doses. However, for HbA1c, the difference between the 4-mg once-daily and 2-mg twice-daily doses was not statistically significant.
Long-term Clinical Trials
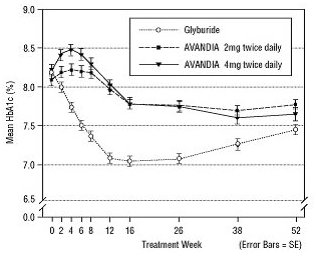
Long-term maintenance of effect was evaluated in a 52-week, double-blind, glyburide-controlled trial in patients with type 2 diabetes. Patients were randomized to treatment with AVANDIA 2 mg twice daily (n=195) or AVANDIA 4 mg twice daily (n=189) or glyburide (n=202) for 52 weeks. Patients receiving glyburide were given an initial dosage of either 2.5 mg/day or 5.0 mg/day. The dosage was then titrated in 2.5-mg/day increments over the next 12 weeks, to a maximum dosage of 15 mg/day in order to optimize glycemic control. Thereafter, the glyburide dose was kept constant.
The median titrated dose of glyburide was 7.5 mg. All treatments resulted in a statistically significant improvement in glycemic control from baseline (Figure 3 and Figure 4). At the end of Week 52, the reduction from baseline in FPG and HbA1c was -40.8 mg/dL and -0.53% with AVANDIA 4 mg twice daily; -25.4 mg/dL and -0.27% with AVANDIA 2 mg twice daily; and -30.0 mg/dL and -0.72% with glyburide. For HbA1c, the difference between AVANDIA 4 mg twice daily and glyburide was not statistically significant at Week 52. The initial fall in FPG with glyburide was greater than with AVANDIA; however, this effect was less durable over time. The improvement in glycemic control seen with AVANDIA 4 mg twice daily at Week 26 was maintained through Week 52 of the trial.
Figure 3. Mean FPG over Time in a 52‑Week, Glyburide‑Controlled Trial:
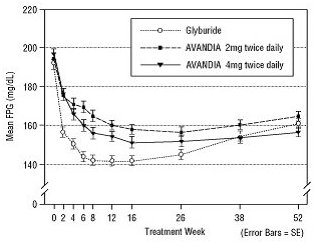
Figure 4. Mean HbA1c over Time in a 52‑Week, Glyburide‑Controlled Trial:
Hypoglycemia was reported in 12.1% of glyburide-treated patients versus 0.5% (2 mg twice daily) and 1.6% (4 mg twice daily) of patients treated with AVANDIA. The improvements in glycemic control were associated with a mean weight gain of 1.75 kg and 2.95 kg for patients treated with 2 mg and 4 mg twice daily of AVANDIA, respectively, versus 1.9 kg in glyburide-treated patients. In patients treated with AVANDIA, C-peptide, insulin, pro-insulin, and pro-insulin split products were significantly reduced in a dose-ordered fashion, compared with an increase in the glyburide-treated patients.
The ADOPT trial was a multicenter, double-blind, controlled trial (n=4,351) conducted over 4 to 6 years to compare the safety and efficacy of AVANDIA, metformin, and glyburide monotherapy in patients recently diagnosed with type 2 diabetes mellitus (≤3 years) inadequately controlled with diet and exercise. The mean age of patients in this trial was 57 years and the majority of patients (83%) had no known history of cardiovascular disease. The mean baseline FPG and HbA1c were 152 mg/dL and 7.4%, respectively. Patients were randomized to receive either AVANDIA 4 mg once daily, glyburide 2.5 mg once daily, or metformin 500 mg once daily, and doses were titrated to optimal glycemic control up to a maximum of 4 mg twice daily for AVANDIA, 7.5 mg twice daily for glyburide, and 1,000 mg twice daily for metformin. The primary efficacy outcome was time to consecutive FPG >180 mg/dL after at least 6 weeks of treatment at the maximum tolerated dose of study medication or time to inadequate glycemic control, as determined by an independent adjudication committee.
The cumulative incidence of the primary efficacy outcome at 5 years was 15% with AVANDIA, 21% with metformin, and 34% with glyburide (HR 0.68 [95% CI: 0.55, 0.85] versus metformin, HR 0.37 [95% CI: 0.30, 0.45] versus glyburide).
Cardiovascular and adverse event data (including effects on body weight and bone fracture) from ADOPT for AVANDIA, metformin, and glyburide are described in Warnings and Precautions (5.2, 5.4, and 5.7) and Adverse Reactions (6.1), respectively. As with all medications, efficacy results must be considered together with safety information to assess the potential benefit and risk for an individual patient.
14.2 Combination with Metformin or Sulfonylurea
The addition of AVANDIA to either metformin or sulfonylurea resulted in significant reductions in hyperglycemia compared with either of these agents alone. These results are consistent with an additive effect on glycemic control when AVANDIA is used as combination therapy.
Combination with Metformin
A total of 670 patients with type 2 diabetes participated in two 26-week, randomized, double-blind, placebo-/active-controlled trials designed to assess the efficacy of AVANDIA in combination with metformin. AVANDIA, administered in either once-daily or twice-daily dosing regimens, was added to the therapy of patients who were inadequately controlled on a maximum dose (2.5 grams/day) of metformin.
In one trial, patients inadequately controlled on 2.5 grams/day of metformin (mean baseline FPG 216 mg/dL and mean baseline HbA1c 8.8%) were randomized to receive 4 mg of AVANDIA once daily, 8 mg of AVANDIA once daily, or placebo in addition to metformin. A statistically significant improvement in FPG and HbA1c was observed in patients treated with the combinations of metformin and 4 mg of AVANDIA once daily and 8 mg of AVANDIA once daily, versus patients continued on metformin alone (Table 10).
Table 10. Glycemic Parameters in a 26-Week Combination Trial of AVANDIA plus Metformin:
| Parameter | Metformin | AVANDIA 4 mg Once Daily + Metformin | AVANDIA 8 mg Once Daily + Metformin |
|---|---|---|---|
| n=113 | n=116 | n=110 | |
| FPG (mg/dL) | |||
| Baseline (mean) | 214 | 215 | 220 |
| Change from baseline (mean) | 6 | -33 | -48 |
| Difference from metformin alone (adjusted mean) | – | -40a | -53a |
| % of patients with ≥30 mg/dL decrease from baseline | 20% | 45% | 61% |
| HbA1c (%) | |||
| Baseline (mean) | 8.6 | 8.9 | 8.9 |
| Change from baseline (mean) | 0.5 | -0.6 | -0.8 |
| Difference from metformin alone (adjusted mean) | – | -1.0a | -1.2a |
| % of patients with ≥0.7% decrease from baseline | 11% | 45% | 52% |
a P <0.0001 compared with metformin.
In a second 26-week trial, patients with type 2 diabetes inadequately controlled on 2.5 grams/day of metformin who were randomized to receive the combination of AVANDIA 4 mg twice daily and metformin (n=105) showed a statistically significant improvement in glycemic control with a mean treatment effect for FPG of -56 mg/dL and a mean treatment effect for HbA1c of -0.8% over metformin alone. The combination of metformin and AVANDIA resulted in lower levels of FPG and HbA1c than either agent alone.
Patients who were inadequately controlled on a maximum dose (2.5 grams/day) of metformin and who were switched to monotherapy with AVANDIA demonstrated loss of glycemic control, as evidenced by increases in FPG and HbA1c. In this group, increases in LDL and VLDL were also seen.
Combination with a Sulfonylurea
A total of 3,457 patients with type 2 diabetes participated in ten 24- to 26-week randomized, double-blind, placebo/active-controlled trials and one 2-year double-blind, active-controlled trial in elderly patients designed to assess the efficacy and safety of AVANDIA in combination with a sulfonylurea. AVANDIA 2 mg, 4 mg, or 8 mg daily was administered, either once daily (3 trials) or in divided doses twice daily (7 trials), to patients inadequately controlled on a submaximal or maximal dose of sulfonylurea.
In these trials, the combination of AVANDIA 4 mg or 8 mg daily (administered as a single dose or twice-daily divided doses) and a sulfonylurea significantly reduced FPG and HbA1c compared with placebo plus sulfonylurea or further up-titration of the sulfonylurea. Table 11 shows pooled data for 8 trials in which AVANDIA added to sulfonylurea was compared with placebo plus sulfonylurea.
Table 11. Glycemic Parameters in 24- to 26-Week Combination Trials of AVANDIA plus Sulfonylurea:
| Twice-Daily Divided Dosing (5 Trials) | Sulfonylurea n=397 | AVANDIA 2 mg Twice Daily + Sulfonylurea n=497 | Sulfonylurea n=248 | AVANDIA 4 mg Twice Daily + Sulfonylurea n=346 |
|---|---|---|---|---|
| FPG (mg/dL) | ||||
| Baseline (mean) | 204 | 198 | 188 | 187 |
| Change from baseline (mean) | 11 | -29 | 8 | -43 |
| Difference from sulfonylurea alone (adjusted mean) | – | -42a | – | -53a |
| % of patients with ≥30 mg/dL decrease from baseline | 17% | 49% | 15% | 61% |
| HbA1c (%) | ||||
| Baseline (mean) | 9.4 | 9.5 | 9.3 | 9.6 |
| Change from baseline (mean) | 0.2 | -1.0 | 0.0 | -1.6 |
| Difference from sulfonylurea alone (adjusted mean) | – | -1.1a | – | -1.4a |
| % of patients with ≥0.7% decrease from baseline | 21% | 60% | 23% | 75% |
| Once-Daily Dosing (3 Trials) | Sulfonylurean=172 | AVANDIA4 mg Once Daily + Sulfonylurean=172 | Sulfonylurean=173 | AVANDIA8 mg Once Daily + Sulfonylurean=176 |
| FPG (mg/dL) | ||||
| Baseline (mean) | 198 | 206 | 188 | 192 |
| Change from baseline (mean) | 17 | -25 | 17 | -43 |
| Difference from sulfonylurea alone (adjusted mean) | – | -47a | – | -66a |
| % of patients with ≥30 mg/dL decrease from baseline | 17% | 48% | 19% | 55% |
| HbA1c (%) | ||||
| Baseline (mean) | 8.6 | 8.8 | 8.9 | 8.9 |
| Change from baseline (mean) | 0.4 | -0.5 | 0.1 | -1.2 |
| Difference from sulfonylurea alone (adjusted mean) | – | -0.9a | – | -1.4a |
| % of patients with ≥0.7% decrease from baseline | 11% | 36% | 20% | 68% |
a P <0.0001 compared with sulfonylurea alone.
One of the 24- to 26-week trials included patients who were inadequately controlled on maximal doses of glyburide and switched to 4 mg of AVANDIA daily as monotherapy; in this group, loss of glycemic control was demonstrated, as evidenced by increases in FPG and HbA1c.
In a 2-year, double-blind trial, elderly patients (aged 59 to 89 years) on half-maximal sulfonylurea (glipizide 10 mg twice daily) were randomized to the addition of AVANDIA (n=115, 4 mg once daily to 8 mg as needed) or to continued up-titration of glipizide (n=110), to a maximum of 20 mg twice daily. Mean baseline FPG and HbA1c were 157 mg/dL and 7.72%, respectively, for the arm receiving AVANDIA plus glipizide and 159 mg/dL and 7.65%, respectively, for the glipizide up-titration arm. Loss of glycemic control (FPG ≥180 mg/dL) occurred in a significantly lower proportion of patients (2%) on AVANDIA plus glipizide compared with patients in the glipizide up-titration arm (28.7%). About 78% of the patients on combination therapy completed the 2 years of therapy while only 51% completed on glipizide monotherapy. The effect of combination therapy on FPG and HbA1c was durable over the 2-year trial period, with patients achieving a mean of 132 mg/dL for FPG and a mean of 6.98% for HbA1c compared with no change on the glipizide arm.
14.3 Combination with Sulfonylurea plus Metformin
In two 24- to 26-week, double-blind, placebo-controlled trials designed to assess the efficacy and safety of AVANDIA in combination with sulfonylurea plus metformin, AVANDIA 4 mg or 8 mg daily, was administered in divided doses twice daily, to patients inadequately controlled on submaximal (10 mg) and maximal (20 mg) doses of glyburide and maximal dose of metformin (2 g/day). A statistically significant improvement in FPG and HbA1c was observed in patients treated with the combinations of sulfonylurea plus metformin and 4 mg of AVANDIA and 8 mg of AVANDIA versus patients continued on sulfonylurea plus metformin, as shown in Table 12.
Table 12. Glycemic Parameters in a 26-Week Combination Trial of AVANDIA plus Sulfonylurea and Metformin:
| Parameter | Sulfonylurea + Metforminn=273 | AVANDIA 2 mg Twice Daily + Sulfonylurea + Metforminn=276 | AVANDIA 4 mg Twice Daily + Sulfonylurea + Metforminn=277 |
|---|---|---|---|
| FPG (mg/dL) | |||
| Baseline (mean) | 189 | 190 | 192 |
| Change from baseline (mean) | 14 | -19 | -40 |
| Difference from sulfonylurea plus metformin (adjusted mean) | – | -30a | -52a |
| % of patients with ≥30 mg/dL decrease from baseline | 16% | 46% | 62% |
| HbA1c (%) | |||
| Baseline (mean) | 8.7 | 8.6 | 8.7 |
| Change from baseline (mean) | 0.2 | -0.4 | -0.9 |
| Difference from sulfonylurea plus metformin (adjusted mean) | – | -0.6a | -1.1a |
| % of patients with ≥0.7% decrease from baseline | 16% | 39% | 63% |
a P <0.0001 compared with placebo.
© All content on this website, including data entry, data processing, decision support tools, "RxReasoner" logo and graphics, is the intellectual property of RxReasoner and is protected by copyright laws. Unauthorized reproduction or distribution of any part of this content without explicit written permission from RxReasoner is strictly prohibited. Any third-party content used on this site is acknowledged and utilized under fair use principles.