FILSPARI Film-coated tablet Ref.[107352] Active ingredients: Sparsentan
Source: FDA, National Drug Code (US) Revision Year: 2023
12.1. Mechanism of Action
Sparsentan is a single molecule with antagonism of the endothelin type A receptor (ETAR) and the angiotensin II type 1 receptor (AT1R). Sparsentan has high affinity for both the ETAR (Ki=12.8 nM) and the AT1R (Ki=0.36 nM), and greater than 500-fold selectivity for these receptors over the endothelin type B and angiotensin II subtype 2 receptors. Endothelin-1 and angiotensin II are thought to contribute to the pathogenesis of IgAN via the ETAR and AT1R, respectively.
12.2. Pharmacodynamics
Dose-response information is not available. At the recommended dose regimen, no statistically significant exposure-response (E-R) relationship was identified between sparsentan exposure and the percentage reduction from baseline in UPCR at Week 36 over the observed sparsentan exposure range. No clinically meaningful E-R relationships were observed for hypotension of any grade and peripheral edema worst grade. A statistically significant relationship was observed between sparsentan exposures and the incidence of hyperkalemia of any grade.
Cardiac Electrophysiology
In a randomized, positive-, and placebo-controlled study in healthy subjects, sparsentan caused QTcF prolongation with maximal mean effect of 8.8 msec (90% CI: 5.9, 11.8) at 800 mg and 8.1 msec (90% CI: 5.2, 11.0) at 1600 mg. The underlying mechanism behind the observed QTc prolongation is unknown but is unlikely to be mediated via direct inhibition of hERG channels. At the recommended dose, no clinically relevant QTc prolongation (i.e., >20 msec) is expected.
12.3. Pharmacokinetics
The pharmacokinetics of sparsentan are presented as geometric mean (% coefficient of variation) unless otherwise specified. The Cmax and AUC of sparsentan increase less than proportionally following administration of single doses of 200 mg to 1600 mg. Sparsentan showed time-dependent pharmacokinetics which may be related to the drug inducing its own metabolism over time. Steady-state plasma levels are reached within 7 days with no accumulation of exposure at the approved recommended dosage. Following a single oral dose of 400 mg sparsentan, the mean Cmax and AUC are 6.97 μg/mL and 83 μg×h/mL, respectively. Following daily doses of 400 mg sparsentan, the steady-state mean Cmax and AUC are 6.47 μg/mL and 63.6 μg×h/mL, respectively.
Absorption
Following a single oral dose of 400 mg sparsentan, the median (minimum to maximum) time to peak plasma concentration is approximately 3 hours (2 to 8 hours).
Effect of Food
Sparsentan AUC and Cmax increased by 22% and 108%, respectively, following administration of a single oral 800 mg dose with a high fat, high calorie meal (1000 kcal, 50% fat) [see Dosage and Administration (2.4)]. No clinically significant differences in sparsentan pharmacokinetics were observed following administration of a single 200 mg dose with a high fat, high calorie meal.
Distribution
The apparent volume of distribution at steady state is 61.4 L at the approved recommended dosage.
Sparsentan is >99% bound to human plasma proteins.
Elimination
The clearance of sparsentan is time-dependent which may be related to the drug inducing its own metabolism over time. The apparent clearance (CL/F) of sparsentan is 3.88 L/h following the initial 400 mg dose then increases to 5.11 L/h at steady state.
The half-life of sparsentan is estimated to be 9.6 hours at steady state.
Metabolism
Cytochrome P450 3A is the major isozyme responsible for the metabolism of sparsentan.
Excretion
After a single dose of radiolabeled sparsentan 400 mg to healthy subjects, approximately 80% of the dose was recovered in feces (9% unchanged) and 2% in urine (negligible amount unchanged). 82% of the dosed radioactivity was recovered within a 10-day collection period.
Specific Populations
No clinically significant differences in the pharmacokinetics of sparsentan were observed based on age (18–73 years), sex, race, mild to moderate renal impairment (eGFR 30 to 89 mL/min/1.73 m²), or mild to moderate hepatic impairment (Child-Pugh class A or B). Patients with severe hepatic impairment (Child-Pugh class C) and eGFR <30 mL/min/1.73 m² have not been studied.
Drug Interaction Studies
Clinical Studies and Model-Informed Approaches
Effect of Other Drugs on Sparsentan:
Strong CYP3A inhibitors: Concomitant use with itraconazole (strong CYP3A inhibitor) increased sparsentan Cmax by 25% and AUC by 174%.
Moderate CYP3A inhibitors: Concomitant use with cyclosporine (moderate CYP3A inhibitor) increased sparsentan Cmax by 41% and AUC by 70%.
Strong CYP3A inducers: Coadministration of rifampin (strong CYP3A inducer) is predicted to decrease sparsentan Cmax by 23% and AUC0-inf by 47% at steady state.
Effect of Sparsentan on Other Drugs:
No clinically significant differences in the pharmacokinetics of midazolam (sensitive CYP3A4 substrate) or pitavastatin (OATP1B1, OATP1B3, P-gp, and BCRP substrate) were observed when co-administered with sparsentan. In addition, sparsentan had no clinically significant effect on serum creatinine levels (an endogenous biomarker of OAT2, OCT2, MATE1, and MATE2K) or on 6β hydroxycortisol (an endogenous biomarker of OAT3).
CYP2B6 substrates: Concomitant use with sparsentan decreased the exposure of bupropion (CYP2B6 substrate) Cmax by 32% and AUC by 33%.
In vitro Studies
CYP Enzymes: Sparsentan is a substrate of CYP3A. Sparsentan is both an inhibitor and inducer of CYP3A and an inducer of CYP2B6, CYP2C9, and CYP2C19.
Transporters: Sparsentan is a substrate of P-gp and BCRP but is not a substrate of OATP1B1 or OATP1B3. Sparsentan is an inhibitor of P-gp, BCRP, OATP1B3 and OAT3 but does not inhibit MRP, OATP1B1, NTCP, OCT2, OAT1, MATE1, or MATE2K at relevant concentrations.
13.1. Carcinogenesis, Mutagenesis, Impairment of Fertility
Carcinogenesis
In the two-year rat carcinogenicity study, there was no evidence of increased incidence of neoplasia in male rats orally administered at 15 mg/kg/day (the only dose evaluated) and in female rats orally administered up to 240 mg/kg/day, which provided an exposure approximately 0.7 times and 26 times the AUC at the MRHD, respectively. In the 26-week transgenic mouse study, there was no evidence of increased incidence of neoplasia in male and female mice orally administered sparsentan at doses up to 600 mg/kg/day.
Mutagenesis
There was no evidence of mutagenicity or clastogenicity for sparsentan in in vitro bacteria reverse mutation and chromosomal aberration assays, or in an in vivo rat micronucleus study.
Impairment of fertility
In a fertility and early embryonic development study in rats, oral administration of sparsentan at doses of 20, 80, and 320 mg/kg/day for at least 36 (females) and 49 (males) days did not result in any adverse effects on estrous cycles, mating, fertility, sperm evaluation, or pregnancy incidence at doses up to 320 mg/kg/day, which provided approximately 10 and 14 times the AUC at the MRHD for males and females, respectively. Male reproductive organ toxicity was not evident in chronic toxicity studies with sparsentan at exposures up to 10 times and 1.3 times the AUC at the MRHD in rats and monkeys, respectively.
14. Clinical Studies
The effect of FILSPARI on proteinuria was assessed in a randomized, double-blind, active-controlled, multicenter, global study (PROTECT, NCT03762850) in adults with biopsy-proven IgAN, eGFR ≥30 mL/min/1.73 m², and total urine protein ≥1.0 g/day on a maximized stable dose of RAS inhibitor treatment that was at least 50% of maximum labeled dose. Patients with other glomerulopathies or those who had been recently treated with systemic immunosuppressants were excluded.
Patients were randomized (1:1) to either FILSPARI (400 mg once daily following 200 mg once daily for 14 days) or irbesartan (300 mg once daily following 150 mg once daily for 14 days). Rescue immunosuppressive treatment could be initiated per investigator discretion during the trial, but use of SGLT2 inhibitors was prohibited.
The 281 patients who reached week 36 had a mean age of 46 years (range 18 to 76 years); 69% were male, 62% White, 35% Asian, and 1% Black or African American. Approximately 77% had a history of hypertension, 12% diabetes or impaired fasting glucose, and 53% hematuria. Mean (SD) baseline eGFR was 56 (24) mL/min/1.73 m².
The primary endpoint was the relative change from baseline in UPCR at Week 36 (Table 3). The mean percent change from baseline over time is displayed in Figure 1.
Table 3. Ratio of Geometric Mean (GM) of UPCR at Week 36 Relative to Baseline (PROTECT, IAS):
| FILSPARI N=141 | Irbesartan N=140 | |
|---|---|---|
| Adjusted GM of UPCR*, g/g | ||
| Baseline | 1.2 (n=141) | 1.2 (n=140) |
| Week 36 | 0.7 (n=135) | 1.0 (n=128) |
| Adjusted GMPC from Baseline in UPCR at Week 36 (95% CI) | ‑45% (-51%, -38%) | ‑15% (-24%, -4%) |
| FILSPARI versus Irbesartan: Ratio of adjusted GM relative to baseline at week 36 (95% CI) | 0.65 (0.55, 0.77) | |
| p-value | <0.0001 | |
* Adjusted GM of UPCR was based on MMRM stratified by screening eGFR and total urine protein excretion. MMRM analysis includes UPCR data during the double-blind period up to week 36 from the first 281 randomized and treated subjects at the interim analysis. Baseline was defined as the last non-missing observation on or prior to the start of dosing.
Missing data were imputed using multiple imputation under the missing at random assumption. Data observed while on randomized treatment and after treatment discontinuation were included in the analysis regardless of treatment discontinuation and initiation of rescue therapy (treatment policy strategy). Rescue immunosuppressive treatment was initiated in 1.4% and 5.7% of FILSPARI and irbesartan patients, respectively.
Abbreviations: CI=confidence interval; GM=geometric mean; GMPC=geometric mean percent change; IAS=interim analysis set; MMRM=mixed model repeated measures; N=number of subjects in each group; n=number of subjects with available data at the time of analysis; UPCR=urine protein-to-creatinine ratio.
Figure 1. Percent Change from Baseline in UPCR by Visit (PROTECT, IAS):
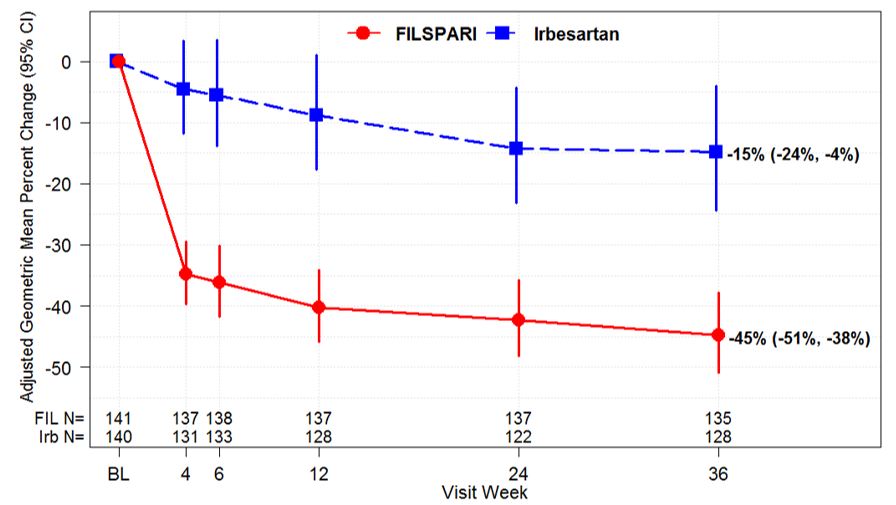
Adjusted GMPC of UPCR relative to baseline were based on the same MMRM analysis as used in Table 3. Counts in axis table represent number of subjects with UPCR data by visit and treatment group.
BL=baseline; CI=confidence interval; FIL=FILSPARI; GMPC=geometric mean percent change; Irb=irbesartan; IAS=interim analysis data set; MMRM=mixed model repeated measures; N=number of subjects in each group; UPCR=urine protein-to-creatinine ratio.
The treatment effect on UPCR at Week 36 was consistent across subgroups such as age, sex, race, and baseline eGFR and proteinuria levels.
© All content on this website, including data entry, data processing, decision support tools, "RxReasoner" logo and graphics, is the intellectual property of RxReasoner and is protected by copyright laws. Unauthorized reproduction or distribution of any part of this content without explicit written permission from RxReasoner is strictly prohibited. Any third-party content used on this site is acknowledged and utilized under fair use principles.