LIPITOR Film-coated tablet Ref.[51699] Active ingredients: Atorvastatin
Source: FDA, National Drug Code (US) Revision Year: 2022
12.1. Mechanism of Action
LIPITOR is a selective, competitive inhibitor of HMG-CoA reductase, the rate-limiting enzyme that converts 3-hydroxy-3-methylglutaryl-coenzyme A to mevalonate, a precursor of sterols, including cholesterol. In animal models, LIPITOR lowers plasma cholesterol and lipoprotein levels by inhibiting HMG-CoA reductase and cholesterol synthesis in the liver and by increasing the number of hepatic LDL receptors on the cell surface to enhance uptake and catabolism of LDL; LIPITOR also reduces LDL production and the number of LDL particles.
12.2. Pharmacodynamics
LIPITOR, as well as some of its metabolites, are pharmacologically active in humans. The liver is the primary site of action and the principal site of cholesterol synthesis and LDL clearance. Drug dosage, rather than systemic drug concentration, correlates better with LDL-C reduction. Individualization of drug dosage should be based on therapeutic response [see Dosage and Administration (2)].
12.3. Pharmacokinetics
Absorption
LIPITOR is rapidly absorbed after oral administration; maximum plasma concentrations occur within 1 to 2 hours. Extent of absorption increases in proportion to LIPITOR dose. The absolute bioavailability of atorvastatin (parent drug) is approximately 14% and the systemic availability of HMG-CoA reductase inhibitory activity is approximately 30%. The low systemic availability is attributed to presystemic clearance in gastrointestinal mucosa and/or hepatic first-pass metabolism. Although food decreases the rate and extent of drug absorption by approximately 25% and 9%, respectively, as assessed by Cmax and AUC, LDL-C reduction is similar whether LIPITOR is given with or without food. Plasma LIPITOR concentrations are lower (approximately 30% for Cmax and AUC) following evening drug administration compared with morning. However, LDL-C reduction is the same regardless of the time of day of drug administration.
Distribution
Mean volume of distribution of LIPITOR is approximately 381 liters. LIPITOR is ≥98% bound to plasma proteins. A blood/plasma ratio of approximately 0.25 indicates poor drug penetration into red blood cells.
Elimination
Metabolism
LIPITOR is extensively metabolized to ortho- and parahydroxylated derivatives and various beta-oxidation products. In vitro inhibition of HMG-CoA reductase by ortho- and parahydroxylated metabolites is equivalent to that of LIPITOR. Approximately 70% of circulating inhibitory activity for HMG-CoA reductase is attributed to active metabolites. In vitro studies suggest the importance of LIPITOR metabolism by cytochrome P450 3A4, consistent with increased plasma concentrations of LIPITOR in humans following co-administration with erythromycin, a known inhibitor of this isozyme [see Drug Interactions (7.1)]. In animals, the ortho-hydroxy metabolite undergoes further glucuronidation.
Excretion
LIPITOR and its metabolites are eliminated primarily in bile following hepatic and/or extra-hepatic metabolism; however, the drug does not appear to undergo enterohepatic recirculation. Mean plasma elimination half-life of LIPITOR in humans is approximately 14 hours, but the half-life of inhibitory activity for HMG-CoA reductase is 20 to 30 hours due to the contribution of active metabolites. Less than 2% of a dose of LIPITOR is recovered in urine following oral administration.
Specific Populations
Geriatric
Plasma concentrations of LIPITOR are higher (approximately 40% for Cmax and 30% for AUC) in healthy elderly subjects (age ≥65 years) than in young adults.
Pediatric
Apparent oral clearance of atorvastatin in pediatric subjects appeared similar to that of adults when scaled allometrically by body weight as the body weight was the only significant covariate in atorvastatin population PK model with data including pediatric HeFH patients (ages 10 years to 17 years of age, n=29) in an open-label, 8-week study.
Gender
Plasma concentrations of LIPITOR in women differ from those in men (approximately 20% higher for Cmax and 10% lower for AUC); however, there is no clinically significant difference in LDL-C reduction with LIPITOR between men and women.
Renal Impairment
Renal disease has no influence on the plasma concentrations or LDL-C reduction of LIPITOR [see Use in Specific Populations (8.6)].
While studies have not been conducted in patients with end-stage renal disease, hemodialysis is not expected to significantly enhance clearance of LIPITOR since the drug is extensively bound to plasma proteins.
Hepatic Impairment
In patients with chronic alcoholic liver disease, plasma concentrations of LIPITOR are markedly increased. Cmax and AUC are each 4-fold greater in patients with Childs-Pugh A disease. Cmax and AUC are approximately 16-fold and 11-fold increased, respectively, in patients with Childs-Pugh B disease [see Use in Specific Populations (8.7)].
Drug Interactions
Atorvastatin is a substrate of the hepatic transporters, OATP1B1 and OATP1B3 transporter. Metabolites of atorvastatin are substrates of OATP1B1. Atorvastatin is also identified as a substrate of the efflux transporter BCRP, which may limit the intestinal absorption and biliary clearance of atorvastatin.
Table 5. Effect of Co-administered Drugs on the Pharmacokinetics of Atorvastatin:
| Co-administered drug and dosing regimen | Atorvastatin | ||
|---|---|---|---|
| Dose (mg) | Ratio of AUC* | Ratio of Cmax* | |
| †Cyclosporine 5.2 mg/kg/day, stable dose | 10 mg QD‡ for 28 days | 8.69 | 10.66 |
| †Tipranavir 500 mg BID§/ritonavir 200 mg BID§, 7 days | 10 mg SD¶ | 9.36 | 8.58 |
| †Glecaprevir 400 mg QD‡/pibrentasvir 120 mg QD‡, 7 days | 10 mg QD‡ for 7 days | 8.28 | 22.00 |
| †Telaprevir 750 mg q8h#, 10 days | 20 mg SD¶ | 7.88 | 10.60 |
| †,ÞSaquinavir 400 mg BID§/ritonavir 400 mg BID§, 15 days | 40 mg QD‡ for 4 days | 3.93 | 4.31 |
| †Elbasvir 50 mg QD‡/grazoprevir 200 mg QD‡, 13 days | 10 mg SD¶ | 1.94 | 4.34 |
| †Simeprevir 150 mg QD‡, 10 days | 40 mg SD¶ | 2.12 | 1.70 |
| †Clarithromycin 500 mg BID§, 9 days | 80 mg QD‡ for 8 days | 4.54 | 5.38 |
| †Darunavir 300 mg BID§/ritonavir 100 mg BID§, 9 days | 10 mg QD‡ for 4 days | 3.45 | 2.25 |
| †Itraconazole 200 mg QD‡, 4 days | 40 mg SD¶ | 3.32 | 1.20 |
| †Letermovir 480 mg QD‡, 10 days | 20 mg SD¶ | 3.29 | 2.17 |
| †Fosamprenavir 700 mg BID§/ritonavir 100 mg BID§, 14 days | 10 mg QD‡ for 4 days | 2.53 | 2.84 |
| †Fosamprenavir 1400 mg BID§, 14 days | 10 mg QD‡ for 4 days | 2.30 | 4.04 |
| †Nelfinavir 1250 mg BID§, 14 days | 10 mg QD‡ for 28 days | 1.74 | 2.22 |
| †Grapefruit Juice, 240 mL QD‡,ß | 40 mg SD¶ | 1.37 | 1.16 |
| Diltiazem 240 mg QD‡, 28 days | 40 mg SD¶ | 1.51 | 1.00 |
| Erythromycin 500 mg QIDà, 7 days | 10 mg SD¶ | 1.33 | 1.38 |
| Amlodipine 10 mg, single dose | 80 mg SD¶ | 1.18 | 0.91 |
| Cimetidine 300 mg QIDà, 2 weeks | 10 mg QD‡for 2 weeks | 1.00 | 0.89 |
| Colestipol 10 g BID§, 24 weeks | 40 mg QD‡ for 8 weeks | NA | 0.74è |
| Maalox TC 30 mL QIDà, 17 days | 10 mg QD‡ for 15 days | 0.66 | 0.67 |
| Efavirenz 600 mg QD‡, 14 days | 10 mg for 3 days | 0.59 | 1.01 |
| †Rifampin 600 mg QD‡, 7 days (co‑administered)ð | 40 mg SD¶ | 1.12 | 2.90 |
| †Rifampin 600 mg QD‡, 5 days (doses separated)ð | 40 mg SD¶ | 0.20 | 0.60 |
| †Gemfibrozil 600 mg BID§, 7 days | 40 mg SD¶ | 1.35 | 1.00 |
| †Fenofibrate 160 mg QD‡, 7 days | 40 mg SD¶ | 1.03 | 1.02 |
| Boceprevir 800 mg TIDø, 7 days | 40 mg SD¶ | 2.32 | 2.66 |
* Represents ratio of treatments (co-administered drug plus atorvastatin vs. atorvastatin alone).
† See Sections 5.1 and 7 for clinical significance.
‡ Once daily
§ Twice daily
¶ Single dose
# Every 8 hours
Þ The dose of saquinavir plus ritonavir in this study is not the clinically used dose. The increase in atorvastatin exposure when used clinically is likely to be higher than what was observed in this study. Therefore, caution should be applied and the lowest dose necessary should be used.
ß Greater increases in AUC (ratio of AUC up to 2.5) and/or Cmax (ratio of Cmax up to 1.71) have been reported with excessive grapefruit consumption (≥750 mL-1.2 liters per day).
à Four times daily
è Ratio based on a single sample taken 8-16 h post dose.
ð Due to the dual interaction mechanism of rifampin, simultaneous co-administration of atorvastatin with rifampin is recommended, as delayed administration of atorvastatin after administration of rifampin has been associated with a significant reduction in atorvastatin plasma concentrations.
ø Three times daily
Table 6. Effect of Atorvastatin on the Pharmacokinetics of Co-administered Drugs:
| Atorvastatin | Co-administered drug and dosing regimen | ||
|---|---|---|---|
| Drug/Dose (mg) | Ratio of AUC | Ratio of Cmax | |
| 80 mg QD* for 15 days | Antipyrine, 600 mg SD† | 1.03 | 0.89 |
| 80 mg QD* for 10 days | ‡Digoxin 0.25 mg QD*, 20 days | 1.15 | 1.20 |
| 40 mg QD* for 22 days | Oral contraceptive QD*, 2 months -norethindrone 1 mg -ethinyl estradiol 35 µg | 1.28 1.19 | 1.23 1.30 |
| 10 mg SD† | Tipranavir 500 mg BID§/ritonavir 200 mg BID§, 7 days | 1.08 | 0.96 |
| 10 mg QD* for 4 days | Fosamprenavir 1400 mg BID§, 14 days | 0.73 | 0.82 |
| 10 mg QD‡ for 4 days | Fosamprenavir 700 mg BID§/ritonavir 100 mg BID§, 14 days | 0.99 | 0.94 |
* Once daily
† Single dose
‡ See Section 7 for clinical significance.
§ Twice daily
LIPITOR had no clinically significant effect on prothrombin time when administered to patients receiving chronic warfarin treatment.
13.1. Carcinogenesis, Mutagenesis, Impairment of Fertility
In a 2-year carcinogenicity study in rats at dose levels of 10, 30, and 100 mg/kg/day, 2 rare tumors were found in muscle in high-dose females: in one, there was a rhabdomyosarcoma and, in another, there was a fibrosarcoma. This dose represents a plasma AUC (0-24) value of approximately 16 times the mean human plasma drug exposure after an 80 mg oral dose.
A 2-year carcinogenicity study in mice given 100, 200, or 400 mg/kg/day resulted in a significant increase in liver adenomas in high-dose males and liver carcinomas in high-dose females. These findings occurred at plasma AUC (0-24) values of approximately 6 times the mean human plasma drug exposure after an 80 mg oral dose.
In vitro, atorvastatin was not mutagenic or clastogenic in the following tests with and without metabolic activation: the Ames test with Salmonella typhimurium and Escherichia coli, the HGPRT forward mutation assay in Chinese hamster lung cells, and the chromosomal aberration assay in Chinese hamster lung cells. Atorvastatin was negative in the in vivo mouse micronucleus test.
In female rats, atorvastatin at doses up to 225 mg/kg (56 times the human exposure) did not cause adverse effects on fertility. Studies in male rats performed at doses up to 175 mg/kg (15 times the human exposure) produced no changes in fertility. There was aplasia and aspermia in the epididymis of 2 of 10 rats treated with 100 mg/kg/day of atorvastatin for 3 months (16 times the human AUC at the 80 mg dose); testis weights were significantly lower at 30 and 100 mg/kg and epididymal weight was lower at 100 mg/kg. Male rats given 100 mg/kg/day for 11 weeks prior to mating had decreased sperm motility, spermatid head concentration, and increased abnormal sperm. Atorvastatin caused no adverse effects on semen parameters, or reproductive organ histopathology in dogs given doses of 10, 40, or 120 mg/kg for 2 years.
14. Clinical Studies
Prevention of Cardiovascular Disease
In the Anglo-Scandinavian Cardiac Outcomes Trial (ASCOT), the effect of LIPITOR on fatal and non-fatal coronary heart disease was assessed in 10,305 patients with hypertension, 40-80 years of age (mean of 63 years; 19% women; 95% White, 3% Black, 1% South Asian, 1% other), without a previous myocardial infarction and with total cholesterol (TC) levels ≤251 mg/dL. Additionally, all patients had at least 3 of the following cardiovascular risk factors: male gender (81%), age >55 years (85%), smoking (33%), diabetes (24%), history of CHD in a first-degree relative (26%), TC:HDL >6 (14%), peripheral vascular disease (5%), left ventricular hypertrophy (14%), prior cerebrovascular event (10%), specific ECG abnormality (14%), proteinuria/albuminuria (62%). In this double-blind, placebo-controlled trial, patients were treated with anti-hypertensive therapy (goal BP <140/90 mm Hg for patients without diabetes; <130/80 mm Hg for patients with diabetes) and allocated to either LIPITOR 10 mg daily (n=5168) or placebo (n=5137), using a covariate adaptive method which took into account the distribution of nine baseline characteristics of patients already enrolled and minimized the imbalance of those characteristics across the groups. Patients were followed for a median duration of 3.3 years.
The effect of 10 mg/day of LIPITOR on lipid levels was similar to that seen in previous clinical trials.
LIPITOR significantly reduced the rate of coronary events [either fatal coronary heart disease (46 events in the placebo group vs. 40 events in the LIPITOR group) or non-fatal MI (108 events in the placebo group vs. 60 events in the LIPITOR group)] with a relative risk reduction of 36% [(based on incidences of 1.9% for LIPITOR vs. 3.0% for placebo), p=0.0005 (see Figure 1)]. The risk reduction was consistent regardless of age, smoking status, obesity, or presence of renal dysfunction. The effect of LIPITOR was seen regardless of baseline LDL levels.
Figure 1. Effect of LIPITOR 10 mg/day on Cumulative Incidence of Non-Fatal Myocardial Infarction or Coronary Heart Disease Death (in ASCOT-LLA):
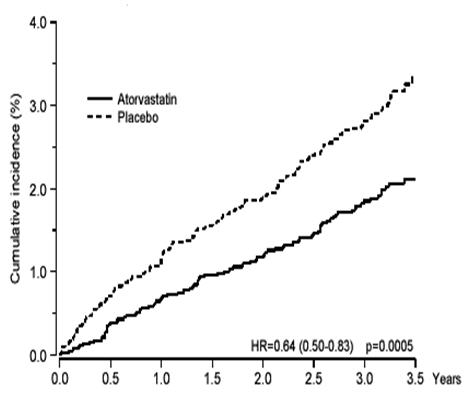
LIPITOR also significantly decreased the relative risk for revascularization procedures by 42% (incidences of 1.4% for LIPITOR and 2.5% for placebo). Although the reduction of fatal and non-fatal strokes did not reach a pre-defined significance level (p=0.01), a favorable trend was observed with a 26% relative risk reduction (incidences of 1.7% for LIPITOR and 2.3% for placebo). There was no significant difference between the treatment groups for death due to cardiovascular causes (p=0.51) or noncardiovascular causes (p=0.17).
In the Collaborative Atorvastatin Diabetes Study (CARDS), the effect of LIPITOR on cardiovascular disease (CVD) endpoints was assessed in 2838 subjects (94% White, 2% Black, 2% South Asian, 1% other; 68% male), ages 40-75 with type 2 diabetes based on WHO criteria, without prior history of cardiovascular disease and with LDL ≤160 mg/dL and triglycerides (TG) ≤600 mg/dL. In addition to diabetes, subjects had 1 or more of the following risk factors: current smoking (23%), hypertension (80%), retinopathy (30%), or microalbuminuria (9%) or macroalbuminuria (3%). No subjects on hemodialysis were enrolled in the trial. In this multicenter, placebo-controlled, double-blind clinical trial, subjects were randomly allocated to either LIPITOR 10 mg daily (1429) or placebo (1411) in a 1:1 ratio and were followed for a median duration of 3.9 years. The primary endpoint was the occurrence of any of the major cardiovascular events: myocardial infarction, acute CHD death, unstable angina, coronary revascularization, or stroke. The primary analysis was the time to first occurrence of the primary endpoint.
Baseline characteristics of subjects were: mean age of 62 years, mean HbA1c 7.7%; median LDL-C 120 mg/dL; median TC 207 mg/dL; median TG 151 mg/dL; median HDL-C 52 mg/dL.
The effect of LIPITOR 10 mg/day on lipid levels was similar to that seen in previous clinical trials.
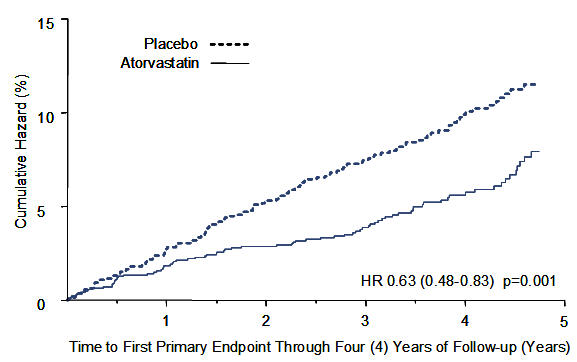
LIPITOR significantly reduced the rate of major cardiovascular events (primary endpoint events) (83 events in the LIPITOR group vs. 127 events in the placebo group) with a relative risk reduction of 37%, HR 0.63, 95% CI (0.48, 0.83) (p=0.001) (see Figure 2). An effect of LIPITOR was seen regardless of age, sex, or baseline lipid levels.
LIPITOR significantly reduced the risk of stroke by 48% (21 events in the LIPITOR group vs. 39 events in the placebo group), HR 0.52, 95% CI (0.31, 0.89) (p=0.016) and reduced the risk of MI by 42% (38 events in the LIPITOR group vs. 64 events in the placebo group), HR 0.58, 95.1% CI (0.39, 0.86) (p=0.007). There was no significant difference between the treatment groups for angina, revascularization procedures, and acute CHD death.
There were 61 deaths in the LIPITOR group vs. 82 deaths in the placebo group (HR 0.73, p=0.059).
Figure 2. Effect of LIPITOR 10 mg/day on Time to Occurrence of Major Cardiovascular Event (myocardial infarction, acute CHD death, unstable angina, coronary revascularization, or stroke) in CARDS:
In the Treating to New Targets Study (TNT), the effect of LIPITOR 80 mg/day vs. LIPITOR 10 mg/day on the reduction in cardiovascular events was assessed in 10,001 subjects (94% White, 81% male, 38% ≥65 years) with clinically evident coronary heart disease who had achieved a target LDL-C level <130 mg/dL after completing an 8-week, open-label, run-in period with LIPITOR 10 mg/day. Subjects were randomly assigned to either 10 mg/day or 80 mg/day of LIPITOR and followed for a median duration of 4.9 years. The primary endpoint was the time-to-first occurrence of any of the following major cardiovascular events (MCVE): death due to CHD, non-fatal myocardial infarction, resuscitated cardiac arrest, and fatal and non-fatal stroke. The mean LDL-C, TC, TG, non-HDL, and HDL cholesterol levels at 12 weeks were 73, 145, 128, 98, and 47 mg/dL during treatment with 80 mg of LIPITOR and 99, 177, 152, 129, and 48 mg/dL during treatment with 10 mg of LIPITOR.
Treatment with LIPITOR 80 mg/day significantly reduced the rate of MCVE (434 events in the 80 mg/day group vs. 548 events in the 10 mg/day group) with a relative risk reduction of 22%, HR 0.78, 95% CI (0.69, 0.89), p=0.0002 (see Figure 3 and Table 7). The overall risk reduction was consistent regardless of age (<65, ≥65) or sex.
Figure 3. Effect of LIPITOR 80 mg/day vs. 10 mg/day on Time to Occurrence of Major Cardiovascular Events (TNT):
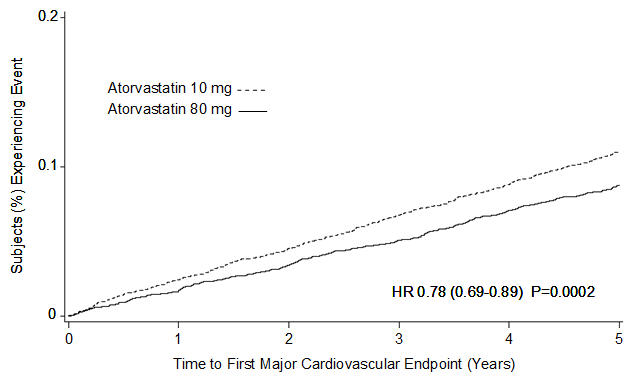
Table 7. Overview of Efficacy Results in TNT:
| Endpoint | Atorvastatin 10 mg (N=5006) | Atorvastatin 80 mg (N=4995) | HR* (95%CI) | ||
|---|---|---|---|---|---|
| PRIMARY ENDPOINT | n | (%) | n | (%) | |
| First major cardiovascular endpoint | 548 | (10.9) | 434 | (8.7) | 0.78 (0.69, 0.89) |
| Components of the Primary Endpoint | |||||
| CHD death | 127 | (2.5) | 101 | (2.0) | 0.80 (0.61, 1.03) |
| Non-fatal, non-procedure related MI | 308 | (6.2) | 243 | (4.9) | 0.78 (0.66, 0.93) |
| Resuscitated cardiac arrest | 26 | (0.5) | 25 | (0.5) | 0.96 (0.56, 1.67) |
| Stroke (fatal and non-fatal) | 155 | (3.1) | 117 | (2.3) | 0.75 (0.59, 0.96) |
| SECONDARY ENDPOINTS† | |||||
| First CHF with hospitalization | 164 | (3.3) | 122 | (2.4) | 0.74 (0.59, 0.94) |
| First PVD endpoint | 282 | (5.6) | 275 | (5.5) | 0.97 (0.83, 1.15) |
| First CABG or other coronary revascularization procedure‡ | 904 | (18.1) | 667 | (13.4) | 0.72 (0.65, 0.80) |
| First documented angina endpoint‡ | 615 | (12.3) | 545 | (10.9) | 0.88 (0.79, 0.99) |
| All-cause mortality | 282 | (5.6) | 284 | (5.7) | 1.01 (0.85, 1.19) |
| Components of All-Cause Mortality | |||||
| Cardiovascular death | 155 | (3.1) | 126 | (2.5) | 0.81 (0.64, 1.03) |
| Noncardiovascular death | 127 | (2.5) | 158 | (3.2) | 1.25 (0.99, 1.57) |
| Cancer death | 75 | (1.5) | 85 | (1.7) | 1.13 (0.83, 1.55) |
| Other non-CV death | 43 | (0.9) | 58 | (1.2) | 1.35 (0.91, 2.00) |
| Suicide, homicide, and other traumatic non-CV death | 9 | (0.2) | 15 | (0.3) | 1.67 (0.73, 3.82) |
* Atorvastatin 80 mg: atorvastatin 10 mg
† Secondary endpoints not included in primary endpoint
‡ Component of other secondary endpoints
HR=hazard ratio; CHD=coronary heart disease; CI=confidence interval; MI=myocardial infarction; CHF=congestive heart failure; CV=cardiovascular; PVD=peripheral vascular disease; CABG=coronary artery bypass graft
Confidence intervals for the Secondary Endpoints were not adjusted for multiple comparisons
Of the events that comprised the primary efficacy endpoint, treatment with LIPITOR 80 mg/day significantly reduced the rate of non-fatal, non-procedure related MI and fatal and non-fatal stroke, but not CHD death or resuscitated cardiac arrest (Table 7). Of the predefined secondary endpoints, treatment with LIPITOR 80 mg/day significantly reduced the rate of coronary revascularization, angina, and hospitalization for heart failure, but not peripheral vascular disease. The reduction in the rate of CHF with hospitalization was only observed in the 8% of patients with a prior history of CHF.
There was no significant difference between the treatment groups for all-cause mortality (Table 7). The proportions of subjects who experienced cardiovascular death, including the components of CHD death and fatal stroke, were numerically smaller in the LIPITOR 80 mg group than in the LIPITOR 10 mg treatment group. The proportions of subjects who experienced noncardiovascular death were numerically larger in the LIPITOR 80 mg group than in the LIPITOR 10 mg treatment group.
Primary Hyperlipidemia in Adults
LIPITOR reduces total-C, LDL-C, apo B, and TG, and increases HDL-C in patients with hyperlipidemia (heterozygous familial and nonfamilial) and mixed dyslipidemia. Therapeutic response is seen within 2 weeks, and maximum response is usually achieved within 4 weeks and maintained during chronic therapy.
In two multicenter, placebo-controlled, dose-response trials in patients with hyperlipidemia, LIPITOR given as a single dose over 6 weeks, significantly reduced total-C, LDL-C, apo B, and TG. (Pooled results are provided in Table 8.)
Table 8. Dose Response in Patients with Primary Hyperlipidemia (Adjusted Mean % Change From Baseline)*:
| Dose | N | TC | LDL‑C | Apo B | TG | HDL‑C |
|---|---|---|---|---|---|---|
| Placebo | 21 | 4 | 4 | 3 | 10 | -3 |
| 10 | 22 | -29 | -39 | -32 | -19 | 6 |
| 20 | 20 | -33 | -43 | -35 | -26 | 9 |
| 40 | 21 | -37 | -50 | -42 | -29 | 6 |
| 80 | 23 | -45 | -60 | -50 | -37 | 5 |
* Results are pooled from 2 dose response trials.
In three multicenter, double-blind trials in patients with hyperlipidemia, LIPITOR was compared to other statins. After randomization, patients were treated for 16 weeks with either LIPITOR 10 mg per day or a fixed dose of the comparative agent (Table 9).
Table 9. Mean Percentage Change From Baseline at Endpoint (Double-Blind, Randomized, Active-Controlled Trials):
| Treatment (Daily Dose) | N | Total‑C | LDL‑C | Apo B | TG | HDL‑C |
|---|---|---|---|---|---|---|
| Trial 1 | ||||||
| LIPITOR 10 mg | 707 | -27* | -36* | -28* | -17* | +7 |
| Lovastatin 20 mg | 191 | -19 | -27 | -20 | -6 | +7 |
| 95% CI for Diff† | -9.2, -6.5 | -10.7, -7.1 | -10.0, -6.5 | -15.2, -7.1 | -1.7, 2.0 | |
| Trial 2 | ||||||
| LIPITOR 10 mg | 222 | -25‡ | -35‡ | -27‡ | -17‡ | +6 |
| Pravastatin 20 mg | 77 | -17 | -23 | -17 | -9 | +8 |
| 95% CI for Diff† | -10.8, -6.1 | -14.5, -8.2 | -13.4, -7.4 | -14.1, -0.7 | -4.9, 1.6 | |
| Trial 3 | ||||||
| LIPITOR 10 mg | 132 | -29§ | -37§ | -34§ | -23§ | +7 |
| Simvastatin 10 mg | 45 | -24 | -30 | -30 | -15 | +7 |
| 95% CI for Diff† | -8.7, -2.7 | -10.1, -2.6 | -8.0, -1.1 | -15.1, -0.7 | -4.3, 3.9 |
* Significantly different from lovastatin, ANCOVA, p≤0.05
† A negative value for the 95% CI for the difference between treatments favors LIPITOR for all except HDL-C, for which a positive value favors LIPITOR. If the range does not include 0, this indicates a statistically significant difference.
‡ Significantly different from pravastatin, ANCOVA, p≤0.05
§ Significantly different from simvastatin, ANCOVA, p≤0.05
Table 9 does not contain data comparing the effects of LIPITOR 10 mg and higher doses of lovastatin, pravastatin, and simvastatin. The drugs compared in the trials summarized in the table are not necessarily interchangeable.
Hypertriglyceridemia in Adults
The response to LIPITOR in 64 patients with isolated hypertriglyceridemia treated across several clinical trials is shown in the table below (Table 10). For the LIPITOR-treated patients, median (min, max) baseline TG level was 565 (267-1502).
Table 10. Combined Patients with Isolated Elevated TG: Median (min, max) Percentage Change From Baseline:
| Placebo (N=12) | LIPITOR 10 mg (N=37) | LIPITOR 20 mg (N=13) | LIPITOR 80 mg (N=14) | |
|---|---|---|---|---|
| Triglycerides | -12.4 (-36.6, 82.7) | -41.0 (-76.2, 49.4) | -38.7 (-62.7, 29.5) | -51.8 (-82.8, 41.3) |
| Total-C | -2.3 (-15.5, 24.4) | -28.2 (-44.9, -6.8) | -34.9 (-49.6, -15.2) | -44.4 (-63.5, -3.8) |
| LDL-C | 3.6 (-31.3, 31.6) | -26.5 (-57.7, 9.8) | -30.4 (-53.9, 0.3) | -40.5 (-60.6, -13.8) |
| HDL-C | 3.8 (-18.6, 13.4) | 13.8 (-9.7, 61.5) | 11.0 (-3.2, 25.2) | 7.5 (-10.8, 37.2) |
| non-HDL-C | -2.8 (-17.6, 30.0) | -33.0 (-52.1, -13.3) | -42.7 (-53.7, -17.4) | -51.5 (-72.9, -4.3) |
Dysbetalipoproteinemia in Adults
The results of an open-label crossover trial of 16 patients (genotypes: 14 apo E2/E2 and 2 apo E3/E2) with dysbetalipoproteinemia are shown in the table below (Table 11).
Table 11. Open-Label Crossover Trial of 16 Patients with Dysbetalipoproteinemia (Fredrickson Type III):
| Median % Change (min, max) | |||
|---|---|---|---|
| Median (min, max) at Baseline (mg/dL) | LIPITOR 10 mg | LIPITOR 80 mg | |
| Total-C | 442 (225, 1320) | -37 (-85, 17) | -58 (-90, -31) |
| Triglycerides | 678 (273, 5990) | -39 (-92, -8) | -53 (-95, -30) |
| IDL-C + VLDL-C | 215 (111, 613) | -32 (-76, 9) | -63 (-90, -8) |
| non-HDL-C | 411 (218, 1272) | -43 (-87, -19) | -64 (-92, -36) |
HoFH in Adults and Pediatric Patients
In a trial without a concurrent control group, 29 patients (mean age of 22 years, median age of 24 years, 31% <18 years) with HoFH received maximum daily doses of 20 to 80 mg of LIPITOR. The mean LDL-C reduction in this trial was 18%. Twenty-five patients with a reduction in LDL-C had a mean response of 20% (range of 7% to 53%, median of 24%); the remaining 4 patients had 7% to 24% increases in LDL-C. Five of the 29 patients had absent LDL-receptor function. Of these, 2 patients also had a portacaval shunt and had no significant reduction in LDL-C. The remaining 3 receptor-negative patients had a mean LDL-C reduction of 22%.
HeFH in Pediatric Patients
In a double-blind, placebo-controlled trial followed by an open-label phase, 187 boys and post-menarchal girls 10 years to 17 years of age (mean age 14.1 years; 31% female; 92% White, 1.6% Blacks, 1.6% Asians, 4.8% other) with heterozygous familial hypercholesterolemia (HeFH) or severe hypercholesterolemia, were randomized to LIPITOR (n=140) or placebo (n=47) for 26 weeks and then all received LIPITOR for 26 weeks. Inclusion in the trial required 1) a baseline LDL-C level ≥ 190 mg/dL or 2) a baseline LDL-C level ≥160 mg/dL and positive family history of FH or documented premature cardiovascular disease in a first or second-degree relative. The mean baseline LDL-C value was 219 mg/dL (range: 139-385 mg/dL) in the LIPITOR group compared to 230 mg/dL (range: 160-325 mg/dL) in the placebo group. The dosage of LIPITOR (once daily) was 10 mg for the first 4 weeks and uptitrated to 20 mg if the LDL-C level was >130 mg/dL. The number of LIPITOR-treated patients who required uptitration to 20 mg after Week 4 during the double-blind phase was 78 (56%).
LIPITOR significantly decreased plasma levels of total-C, LDL-C, triglycerides, and apolipoprotein B during the 26-week double‑blind phase (see Table 12).
Table 12. Lipid-altering Effects of LIPITOR in Adolescent Boys and Girls with Heterozygous Familial Hypercholesterolemia or Severe Hypercholesterolemia (Mean Percentage Change From Baseline at Endpoint in Intention‑to‑Treat Population):
| DOSAGE | N | Total-C | LDL-C | HDL-C | TG | Apolipoprotein B |
|---|---|---|---|---|---|---|
| Placebo | 47 | -1.5 | -0.4 | -1.9 | 1.0 | 0.7 |
| LIPITOR | 140 | -31.4 | -39.6 | 2.8 | -12.0 | -34.0 |
The mean achieved LDL-C value was 130.7 mg/dL (range: 70.0-242.0 mg/dL) in the LIPITOR group compared to 228.5 mg/dL (range: 152.0-385.0 mg/dL) in the placebo group during the 26-week double-blind phase.
Atorvastatin was also studied in a three year open-label, uncontrolled trial that included 163 patients with HeFH who were 10 years to 15 years old (82 boys and 81 girls). All patients had a clinical diagnosis of HeFH confirmed by genetic analysis (if not already confirmed by family history). Approximately 98% were White, and less than 1% were Black or Asian. Mean LDL-C at baseline was 232 mg/dL. The starting atorvastatin dosage was 10 mg once daily and doses were adjusted to achieve a target of <130 mg/dL LDL-C. The reductions in LDL-C from baseline were generally consistent across age groups within the trial as well as with previous clinical trials in both adult and pediatric placebo-controlled trials.
© All content on this website, including data entry, data processing, decision support tools, "RxReasoner" logo and graphics, is the intellectual property of RxReasoner and is protected by copyright laws. Unauthorized reproduction or distribution of any part of this content without explicit written permission from RxReasoner is strictly prohibited. Any third-party content used on this site is acknowledged and utilized under fair use principles.