PRANDIN Tablet Ref.[27459] Active ingredients: Repaglinide
Source: FDA, National Drug Code (US) Revision Year: 2019
12.1. Mechanism of Action
Repaglinide lowers blood glucose levels by stimulating the release of insulin from the pancreas. This action is dependent upon functioning beta (β) cells in the pancreatic islets. Insulin release is glucose-dependent and diminishes at low glucose concentrations.
Repaglinide closes ATP-dependent potassium channels in the β-cell membrane by binding at characterizable sites. This potassium channel blockade depolarizes the ß-cell, which leads to an opening of calcium channels. The resulting increased calcium influx induces insulin secretion. The ion channel mechanism is highly tissue selective with low affinity for heart and skeletal muscle.
12.2. Pharmacodynamics
A four-week, double-blind, placebo-controlled dose-response trial was conducted in 138 patients with type 2 diabetes using doses ranging from 0.25 (not an approved dose) to 4 mg taken with each of three meals. PRANDIN therapy resulted in dose-proportional glucose lowering over the full dose range. Plasma insulin levels increased after meals and reverted toward baseline before the next meal. Most of the fasting blood glucose-lowering effect was demonstrated within 1 to 2 weeks.
In a double-blind, placebo-controlled, 3-month dose titration study, PRANDIN or placebo doses for each patient were increased weekly from 0.25 mg (not an approved dose) through 0.5, 1, and 2 mg, to a maximum of 4 mg, until a fasting plasma glucose (FPG) level <160 mg/dL was achieved or the maximum dose reached. The dose that achieved the targeted control or the maximum dose was continued to end of study. FPG and 2-hour post-prandial glucose (PPG) increased in patients receiving placebo and decreased in patients treated with repaglinide. Differences between the repaglinide- and placebo-treated groups were -61 mg/dL (FPG) and -104 mg/dL (PPG) (Table 4).
Table 4. PRANDIN vs Placebo:
| Mean Change from Baseline after 3 Months of Treatment | ||
|---|---|---|
| Repaglinide | Placebo | |
| N | 66 | 33 |
| Fasting Plasma Glucose (mg/dL) | ||
| Baseline | 220.2 | 215.3 |
| Change from baseline (at last visit) | -31.0* | 30.3 |
| Post Prandial Glucose (mg/dL) | ||
| Baseline | 261.7 | 245.2 |
| Change from baseline (at last visit) | -47.6* | 56.5 |
*: p<0.05 for between group difference
The dosing of PRANDIN relative to meal-related insulin release was studied in three trials including 58 patients. Glycemic control was maintained during a period in which the meal and dosing pattern was varied (2, 3 or 4 meals per day; before meals x 2, 3, or 4) compared with a period of 3 regular meals and 3 doses per day (before meals x 3). Blood glucose-lowering effect did not differ when PRANDIN was administered at the start of a meal, 15 minutes before, or 30 minutes before the meal.
12.3. Pharmacokinetics
The pharmacokinetic parameters of repaglinide obtained from a single-dose, crossover study in healthy subjects and from a multiple-dose, parallel, dose-proportionality (0.5, 1, 2 and 4 mg) study in patients with type 2 diabetes are summarized in Tables 5 and 6. These data indicate that repaglinide did not accumulate in serum. Clearance of oral repaglinide did not change over the 0.5 to 4 mg dose range, indicating a linear relationship between dose and plasma drug levels.
Table 5. Pharmacokinetic Parameters for Repaglinide in Healthy Subjects:
| Parameter | |
|---|---|
| CL (based on i.v.) | 38 ± 16 L/hr |
| Vss (based on i.v.) | 31 ± 12 L |
| AbsBio | 56 ± 9% |
CL = total body clearance
Vss = volume of distribution at steady-state
AbsBio = absolute bioavailability
Table 6. Pharmacokinetic Parameters for Repaglinide in Patients with Type 2 Diabetes*:
| Pharmacokinetic Parameter | ||
|---|---|---|
| Dose (mg) | AUC0-24hr (ng/mL*hr) Mean (SD) | Cmax0-5hr (ng/mL) Mean (SD) |
| 0.5 | 68.9 (154.4) | 9.8 (10.2) |
| 1 | 125.8 (129.8) | 18.3 (9.1) |
| 2 | 152.4 (89.60) | 26.0 (13.0) |
| 4 | 447.4 (211.3) | 65.8 (30.1) |
| Tmax0-5 hr Means (SD) | T½ Means (Ind Range) | |
| 0.5 to 4 | 1.0 to 1.4 (0.3 to 0.5) hr | 1.0 to 1.4 (0.4 to 8.0) hr |
* dosed preprandially with three meals
Absorption
After oral administration, repaglinide is completely absorbed from the gastrointestinal tract. After single and multiple oral doses in healthy subjects or in patients, peak plasma drug levels (Cmax) occur within 1 hour (Tmax). Repaglinide is eliminated from the blood stream with a half-life of approximately 1 hour. The mean absolute bioavailability is 56%. When repaglinide was given with food, the mean Tmax was not changed, but the mean Cmax and AUC (area under the time/plasma concentration curve) were decreased 20% and 12.4%, respectively.
Distribution
After intravenous (IV) dosing in healthy subjects, the volume of distribution at steady-state (Vss) was 31 L, and the total body clearance (CL) was 38 L/h. Protein binding and binding to human serum albumin was greater than 98%.
Metabolism and Elimination
Repaglinide is completely metabolized by oxidative biotransformation and direct conjugation with glucuronic acid after either an IV or oral dose. The major metabolites are an oxidized dicarboxylic acid (M2), the aromatic amine (M1), and the acyl glucuronide (M7). The cytochrome P-450 enzyme system, specifically 2C8 and 3A4, have been shown to be involved in the N-dealkylation of repaglinide to M2 and the further oxidation to M1. Metabolites do not contribute to the glucose-lowering effect of repaglinide. Within 96 hours after dosing with 14C-repaglinide as a single, oral dose, approximately 90% of the radiolabel was recovered in the feces and approximately 8% in the urine. Only 0.1% of the dose is cleared in the urine as parent compound. The major metabolite (M2) accounted for 60% of the administered dose. Less than 2% of parent drug was recovered in feces. Repaglinide appears to be a substrate for active hepatic uptake transporter (organic anion transporting protein OATP1B1).
Variability of Exposure
Repaglinide AUC after multiple doses of 0.25 to 4 mg with each meal varies over a wide range. The intra-individual and inter- individual coefficients of variation were 36% and 69%, respectively. AUC over the therapeutic dose range included 69 to 1005 ng/mL*hr, but AUC exposure up to 5417 ng/mL*hr was reached in dose escalation studies without apparent adverse consequences.
Specific Populations
Geriatric
Healthy volunteers were treated with a regimen of 2 mg PRANDIN taken before each of 3 meals. There were no significant differences in repaglinide pharmacokinetics between the group of patients <65 years of age and a comparably sized group of patients ≥65 years of age [see Use in Specific Populations (8.5)].
Gender
A comparison of pharmacokinetics in males and females showed the AUC over the 0.5 mg to 4 mg dose range to be 15% to 70% higher in females with type 2 diabetes. This difference was not reflected in the frequency of hypoglycemic episodes (male: 16%; female: 17%) or other adverse events.
Race
No pharmacokinetic studies to assess the effects of race have been performed, but in a U.S. 1-year study in patients with type 2 diabetes, the blood glucose-lowering effect was comparable between Caucasians (n=297) and African-Americans (n=33). In a U.S. dose-response study, there was no apparent difference in exposure (AUC) between Caucasians (n=74) and Hispanics (n=33).
Renal Impairment
Single-dose and steady-state pharmacokinetics of repaglinide were compared between patients with type 2 diabetes and normal renal function (CrCl > 80 mL/min), mild to moderate renal function impairment (CrCl = 40 to 80 mL/min), and severe renal function impairment (CrCl = 20 to 40 mL/min). Both AUC and Cmax of repaglinide were similar in patients with normal and mild to moderately impaired renal function (mean values 56.7 ng/mL*hr vs 57.2 ng/mL*hr and 37.5 ng/mL vs 37.7 ng/mL, respectively.) Patients with severely reduced renal function had elevated mean AUC and Cmax values (98.0 ng/mL*hr and 50.7 ng/mL, respectively), but this study showed only a weak correlation between repaglinide levels and creatinine clearance.
Hepatic Impairment
A single-dose, open-label study was conducted in 12 healthy subjects and 12 patients with chronic liver disease (CLD) classified by Child-Pugh scale and caffeine clearance. Patients with moderate to severe impairment of liver function had higher and more prolonged serum concentrations of both total and unbound repaglinide than healthy subjects (AUChealthy: 91.6 ng/mL*hr; AUCCLD patients: 368.9 ng/mL*hr; Cmax, healthy: 46.7 ng/mL; Cmax, CLD patients: 105.4 ng/mL). AUC was statistically correlated with caffeine clearance. No difference in glucose profiles was observed across patient groups.
Drug-Drug Interactions
Drug interaction studies performed in healthy volunteers show that PRANDIN had no clinically relevant effect on the pharmacokinetic properties of digoxin, theophylline, or warfarin. Co-administration of cimetidine with PRANDIN did not significantly alter the absorption and disposition of repaglinide.
Additionally, the following drugs were studied in healthy volunteers with co-administration of PRANDIN.
Table 7. Effect of Other Drugs on AUC and Cmax of Repaglinide:
| Study Drug | Dosing | Repaglinide Dosing1 | Repaglinide | |
|---|---|---|---|---|
| AUC | Cmax | |||
| Clarithromycin* | 250 mg BID for 4 days | 40% ↑ | 67% ↑ | |
| Clopidogrel* | 300 mg (Day 1) 75 mg QD (Day 2 to 3) | 0.25 mg (Day 1 and 3) | (day 1) 5.1 fold ↑ (3.9 to 6.6) (day 3) 3.9 fold ↑ (2.9 to 5.3) | 2.5 fold ↑ (1.8 to 3.5) 2.0 fold ↑ (1.3 to 3.1) |
| Cyclosporine | 100 mg (2 doses 12 hours apart) | 2.5 fold ↑ | 1.8 fold ↑ | |
| Deferasirox* | 30 mg/kg QD for 4 days | 0.5 mg | 2.3 fold ↑ | 62% ↑ |
| Fenofibrate | 200 mg QD for 5 days | 0% | 0% | |
| Gemfibrozil* | 600 mg BID for 3 days | 8.1 fold ↑ | 2.4 fold ↑ | |
| Itraconazole* | 100 mg BID for 3 days | 1.4 fold ↑ | 1.5 fold↑ | |
| Gemfibrozil + Itraconazole* Co-administration | Gem: 600 mg BID for 3 days Itra: 100 mg BID for 3 days | 19 fold ↑ | 2.8 fold ↑ | |
| Ketoconazole | 200 mg QD for 4 days | 2 mg | 15% ↑ | 16% ↑ |
| Levonorgestrel/ethinyl Estradiol | (0.15 mg/0.03 mg) Combination tablet QD for 21 days | 2 mg | 0% | 20% ↑ |
| Nifedipine* | 10 mg TID for 4 days | 2 mg | 0% | 0% |
| Rifampin* | 600 mg QD for 6 to 7 days | 4 mg | 32% to 80% ↓ | 17% to 79% ↓ |
| Simvastatin | 20 mg QD for 4 days | 2 mg | 0% | 26% ↑ |
| Trimethoprim* | 160 mg BID for 2 days 160 mg QD for 1 day | 61% ↑ | 41% ↑ | |
1 Unless indicated all drug interactions were observed with single dose of 0.25 mg repaglinide
↑ indicates increase
↓ indicates decrease
* Indicates data are from published literature
13.1. Carcinogenesis, Mutagenesis, Impairment of Fertility
In a 104-week carcinogenicity study in rats at doses up to 120 mg/kg/day, which is approximately 60 times clinical exposure on a mg/m² basis, the incidences of benign adenomas of the thyroid and liver were increased in male rats. No evidence of carcinogenicity was found in female rats. The higher incidences of thyroid and liver tumors in male rats were not seen at lower dose of 30 mg/kg/day and 60 mg/kg/day respectively (which are over 15 and 30 times, respectively, clinical exposures on a mg/m² basis). In a 104-week carcinogenicity study in mice at doses up to 500 mg/kg/day, no evidence of carcinogenicity was found in mice (which is approximately 125 times clinical exposure on a mg/m² basis).
Repaglinide was non-genotoxic in a battery of in vivo and in vitro studies: Bacterial mutagenesis (Ames test), in vitro forward cell mutation assay in V79 cells (HGPRT), in vitro chromosomal aberration assay in human lymphocytes, unscheduled and replicating DNA synthesis in rat liver, and in vivo mouse and rat micronucleus tests.
In a rat fertility study, repaglinide was administered to male and female rats at doses up to 300 and 80 mg/kg/day, respectively. No adverse effects on fertility were observed (which are over 40 times clinical exposure on a mg/m² basis).
14. Clinical Studies
14.1 Monotherapy Trials
A double-blind, placebo-controlled trial was carried out in 362 patients treated for 24 weeks. HbA1c for the PRANDIN- treated groups (1 and 4 mg groups combined) at the end of the study was decreased compared to the placebo-treated group in treatment naïve patients and in patients previously treated with oral hypoglycemic agents by 2.1% and 1.7%, respectively. In this fixed-dose trial, patients who were treatment naïve to oral hypoglycemic agent therapy and patients with a HbA1c below 8% at baseline showed greater blood glucose-lowering.
14.2 Combination Trials
PRANDIN in Combination With Metformin
PRANDIN was studied in combination with metformin in 83 patients not satisfactorily controlled on exercise, diet, and metformin alone. PRANDIN dosage was titrated for 4 to 8 weeks, followed by a 3-month maintenance period. Combination therapy with PRANDIN and metformin resulted in statistically significant improvement in HbA1c and fasting plasma glucose (FPG) compared to PRANDIN or metformin monotherapy (Table 8). In this study where metformin dosage was kept constant, the combination therapy of PRANDIN and metformin showed dose-sparing effects with respect to PRANDIN. The improvement in HbA1c and FPG of the combination group was achieved at a lower daily PRANDIN dosage than in the PRANDIN monotherapy group (Table 8).
Table 8. PRANDIN in Combination with Metformin: Mean Change from Baseline after 4 to 5 Months of Treatment1:
| PRANDIN Monotherapy | PRANDIN Combination Therapy with Metformin | Metformin Monotherapy | |
|---|---|---|---|
| N | 28 | 27 | 27 |
| Median Final Dose (mg/day) | 12 | 6 (PRANDIN) 1500 (metformin) | 1500 |
| HbA1c (%) | |||
| Baseline | 8.6 | 8.3 | 8.6 |
| Change from baseline | -0.38 | -1.41* | -0.33 |
| Fasting Plasma Glucose (mg/dL) | |||
| Baseline | 174 | 184 | 194 |
| Change from baseline | 8.8 | -39.2* | -4.5 |
| Weight (kg) | |||
| Baseline | 87 | 93 | 91 |
| Change from baseline | 3.0 | 2.4# | -0.90 |
1: based on intent-to-treat analysis
*: p<0.05, for pairwise comparisons with PRANDIN and metformin monotherapy.
#: p<0.05, for pairwise comparison with metformin.
PRANDIN in Combination With Pioglitazone
A combination therapy regimen of PRANDIN and pioglitazone (N=123) was compared to PRANDIN alone (N=61) and pioglitazone alone (N=62) in a 24-week trial that enrolled 246 patients previously treated with sulfonylurea or metformin monotherapy (HbA1c >7.0%). PRANDIN dosage was titrated during the first 12 weeks, followed by a 12-week maintenance period. Combination therapy resulted in statistically significant improvement in HbA1c and FPG compared to monotherapy (Figure 1). The changes from baseline for completers in FPG (mg/dL) and HbA1c (%), respectively were: -39.8 mg/dL and -0.1% for PRANDIN, -35.3 mg/dL and -0.1% for pioglitazone and -92.4 mg/dL and -1.9% for the combination. In this study where pioglitazone dosage was kept constant, the combination therapy group showed dose-sparing effects with respect to PRANDIN (see Figure 1 Legend). The improvement in HbA1c and FPG of the combination group was achieved at a lower daily PRANDIN dosage than in the PRANDIN monotherapy group.
Figure 1. PRANDIN in Combination with Pioglitazone: HbA1c Values:
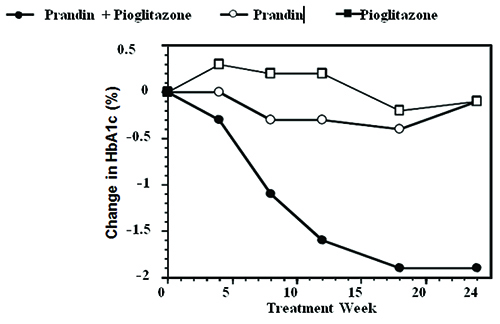
LEGEND: HbA1c values by study week for patients who completed study (combination, N=101; PRANDIN, N=35, pioglitazone, N=26). Subjects with FPG above 270 mg/dL were withdrawn from the study.
Pioglitazone dose: fixed at 30 mg/day; PRANDIN median final dose: 6 mg/day for combination and 10 mg/day for monotherapy.
PRANDIN in Combination With Rosiglitazone
A combination therapy regimen of PRANDIN and rosiglitazone was compared to monotherapy with either agent alone in a 24-week trial that enrolled 252 patients previously treated with sulfonylurea or metformin (HbA1c>7.0%). Combination therapy resulted in statistically significant improvement in HbA1c and FPG compared to monotherapy (Table 9 below). The glycemic effects of the combination therapy were dose-sparing with respect to both total daily PRANDIN dosage and total daily rosiglitazone dosage (see Table 9 Legend). The improvement in HbA1c and FPG of the combination therapy group was achieved with lower daily dose of PRANDIN and rosiglitazone, as compared to the respective monotherapy groups.
Table 9. PRANDIN in Combination with Rosiglitazone: Mean Change from Baseline in a 24-Week Study1:/b>
| PRANDIN Monotherapy | PRANDIN Combination Therapy with Rosiglitazone | Rosiglitazone Monotherapy | |
|---|---|---|---|
| N | 63 | 127 | 62 |
| Median Final Dose (mg/day) | 12 | 6 (PRANDIN) 4 (Rosiglitazone) | 8 |
| HbA1c (%) | |||
| Baseline | 9.3 | 9.1 | 9.0 |
| Change from baseline | -0.17 | -1.43* | -0.56 |
| Fasting Plasma Glucose (mg/dL) | |||
| Baseline | 269 | 257 | 252 |
| Change from baseline | -54 | -94* | -67 |
| Change in Weight (kg) | +1.3 | +4.5# | +3.3 |
1: based on intent-to-treat analysis
*: p<0.001 for comparison to either monotherapy
#: p<0.05 for comparison to PRANDIN
© All content on this website, including data entry, data processing, decision support tools, "RxReasoner" logo and graphics, is the intellectual property of RxReasoner and is protected by copyright laws. Unauthorized reproduction or distribution of any part of this content without explicit written permission from RxReasoner is strictly prohibited. Any third-party content used on this site is acknowledged and utilized under fair use principles.