QSYMIA Extended release capsule Ref.[50588] Active ingredients: Phentermine Topiramate
Source: FDA, National Drug Code (US) Revision Year: 2022
12.2. Pharmacodynamics
Typical actions of amphetamines include central nervous system stimulation and elevation of blood pressure. Tachyphylaxis and tolerance have been demonstrated with drugs in this class.
Cardiac Electrophysiology
The effect of QSYMIA on the QTc interval was evaluated in a randomized, double-blind, placebo- and active-controlled (400 mg moxifloxacin), and parallel group/crossover thorough QT/QTc study. A total of 54 healthy subjects were administered QSYMIA 7.5 mg/46 mg at steady state and then titrated to QSYMIA 22.5 mg/138 mg at steady state. QSYMIA 22.5 mg/138 mg [a supra-therapeutic dose resulting in a phentermine and topiramate maximum concentration (Cmax) of 4- and 3-times higher than those at QSYMIA 7.5 mg/46 mg, respectively] did not affect cardiac repolarization as measured by the change from baseline in QTc.
Glomerular Filtration Rate (GFR)
Healthy obese men and women received QSYMIA daily for 4 weeks (3.75 mg/23 mg on Days 1 to 3, 7.5 mg/46 mg on Days 4 to 6, 11.25 mg/69 mg on Days 7 to 9, and 15 mg/92 mg on Days 10 to 28). The glomerular filtration rate (GFR) of these participants was assessed via iohexol clearance. On average, GFR decreased during QSYMIA treatment and returned to baseline within 4 weeks after discontinuing QSYMIA [see Warnings and Precautions (5.9)].
12.3. Pharmacokinetics
Absorption
Phentermine
Upon oral administration of a single QSYMIA 15 mg/92 mg, the resulting mean plasma phentermine maximum concentration (Cmax), time to Cmax (Tmax), area under the concentration curve from time zero to the last time with measurable concentration (AUC0-t), and area under the concentration curve from time zero to infinity (AUC0-∞) are 49.1 ng/mL, 6 hr, 1990 ng∙hr/mL, and 2000 ng∙hr/mL, respectively. A high fat meal does not affect phentermine pharmacokinetics for QSYMIA 15 mg/92 mg. Phentermine pharmacokinetics are approximately dose-proportional from QSYMIA 3.75 mg/23 mg to phentermine 15 mg/topiramate 100 mg. Upon dosing phentermine 15 mg/topiramate 100 mg fixed dose combination capsule to steady state, the mean phentermine accumulation ratios for AUC and Cmax are both approximately 2.5.
Topiramate
Upon oral administration of a single QSYMIA 15 mg/92 mg, the resulting mean plasma topiramate Cmax, Tmax, AUC0-t, and AUC0-∞, are 1020 ng/mL, 9 hr, 61600 ng∙hr/mL, and 68000 ng∙hr/mL, respectively. A high fat meal does not affect topiramate pharmacokinetics for QSYMIA 15 mg/92 mg. Topiramate pharmacokinetics are approximately dose-proportional from QSYMIA 3.75 mg/23 mg to phentermine 15 mg/topiramate 100 mg. Upon dosing phentermine 15 mg/topiramate 100 mg fixed dose combination capsule to steady state, the mean topiramate accumulation ratios for AUC and Cmax are both approximately 4.0.
Distribution
Phentermine
Phentermine is 17.5% plasma protein bound. The estimated phentermine apparent volume of distribution (Vd/F) is 348 L via population pharmacokinetic analysis.
Topiramate
Topiramate is 15-41% plasma protein bound over the blood concentration range of 0.5 to 250 µg/mL. The fraction bound decreased as blood topiramate increased. The estimated topiramate Vc/F (volume of the central compartment), and Vp/F (volume of the peripheral compartment) are 50.8 L, and 13.1 L, respectively, via population pharmacokinetic analysis.
Elimination
Metabolism and Excretion
Phentermine
Phentermine has two metabolic pathways, namely p-hydroxylation on the aromatic ring and N-oxidation on the aliphatic side chain. Cytochrome P450 (CYP) 3A4 primarily metabolizes phentermine but does not show extensive metabolism. Monoamine oxidase (MAO)-A and MAO-B do not metabolize phentermine. Seventy to 80% of a dose exists as unchanged phentermine in urine when administered alone. The mean phentermine terminal half-life is about 20 hours. The estimated phentermine oral clearance (CL/F) is 8.79 L/h via population pharmacokinetic analysis.
Topiramate
Topiramate does not show extensive metabolism. Six topiramate metabolites (via hydroxylation, hydrolysis, and glucuronidation) exist, none of which constitutes more than 5% of an administered dose. About 70% of a dose exists as unchanged topiramate in urine when administered alone. The mean topiramate terminal half-life is about 65 hours. The estimated topiramate CL/F is 1.17 L/h via population pharmacokinetic analysis.
Specific Populations
Patients with Renal Impairment
A single-dose, open-label study was conducted to evaluate the pharmacokinetics of QSYMIA 15 mg/92 mg in adult patients with varying degrees of chronic renal impairment compared to healthy volunteers with normal renal function. The study included patients with renal impairment classified on the basis of creatinine clearance as mild (greater or equal to 50 and less than 80 mL/min), moderate (greater than or equal to 30 and less than 50 mL/min), and severe (less than 30 mL/min). Creatinine clearance was estimated from serum creatinine based on the Cockcroft-Gault equation.
Compared to healthy volunteers, phentermine AUC0-inf was 91%, 45%, and 22% higher in patients with severe, moderate, and mild renal impairment, respectively; phentermine Cmax was 2% to 15% higher. Compared to healthy volunteers, topiramate AUC0-inf was 126%, 85%, and 25% higher for patients with severe, moderate, and mild renal impairment, respectively; topiramate Cmax was 6% to 17% higher. An inverse relationship between phentermine or topiramate Cmax or AUC and creatinine clearance was observed.
QSYMIA has not been studied in patients with end-stage renal disease on dialysis [see Dosage and Administration (2.5), and Use in Specific Populations (8.6)].
Patients with Hepatic Impairment
A single-dose, open-label study was conducted to evaluate the pharmacokinetics of QSYMIA 15 mg/92 mg in healthy volunteers with normal hepatic function compared with patients with mild (Child-Pugh score 5-6) and moderate (Child-Pugh score 7-9) hepatic impairment. In patients with mild and moderate hepatic impairment, phentermine AUC was 37% and 60% higher compared to healthy volunteers. Pharmacokinetics of topiramate was not affected in patients with mild and moderate hepatic impairment when compared with healthy volunteers. QSYMIA has not been studied in patients with severe hepatic impairment (Child-Pugh score 10-15) [see Dosage and Administration (2.6), and Use in Specific Populations (8.7)].
Pediatric Patients 12 to 17 years old
A randomized, double-blind, placebo-controlled study was conducted to evaluate the population pharmacokinetics of QSYMIA using data from 37 pediatric patients (12 to 17 years of age) with obesity. QSYMIA dosages of 3.75 mg/23 mg, 7.5 mg/46 mg, and 15 mg/92 mg were studied. QSYMIA exposure in the pediatric patients appeared comparable to that in adults.
Drug Interaction Studies
In Vitro Assessment of Drug Interactions
Phentermine:
Phentermine is not an inhibitor of CYP isozymes CYP1A2, CYP2C9, CYP2C19, CYP2D6, CYP2E1, and CYP3A4, and is not an inhibitor of monoamine oxidases. Phentermine is not an inducer of CYP1A2, CYP2B6, and CYP3A4. Phentermine is not a P-glycoprotein substrate.
Topiramate:
Topiramate is not an inhibitor of CYP isozymes CYP1A2, CYP2A6, CYP2B6, CYP2C9, CYP2D6, CYP2E1, and CYP3A4/5. However, topiramate is a mild inhibitor of CYP2C19. Topiramate is a mild inducer of CYP3A4. Topiramate is not a P-glycoprotein substrate.
Effects of Phentermine/Topiramate on Other Drugs
Table 8 describes the effect of phentermine/topiramate on the pharmacokinetics of co-administered drugs.
Table 8. Effect of Phentermine/Topiramate on the Pharmacokinetics of Co-administered Drugs:
| Phentermine/Topiramate | Co-administered Drug and Dosing Regimen | ||
|---|---|---|---|
| Drug and Dose (mg) | Change in AUC | Change in Cmax | |
| *15 mg/92 mg dose QD for 16 days | Metformin 500 mg BID for 5 days | ↑ 23% | ↑ 16% |
| *15 mg/92 mg dose QD for 21 days | Sitagliptin 100 mg QD for 5 days | ↓ 3% | ↓ 9% |
| †15 mg/92 mg dose QD for 15 days | Oral contraceptive single dose norethindrone 1 mg ethinyl estradiol 35 mcg | ↑ 16% ↓ 16% | ↑ 22% ↓ 8% |
- A single study examined the effect of multiple-dose QSYMIA 15 mg/92 mg once daily on the pharmacokinetics of multiple-dose 500 mg metformin twice daily and multiple-dose 100 mg sitagliptin once daily in 10 men and 10 women (mean BMI of 27.1 kg/m 2 and range of 22.2–32.7 kg/m²). The study participants received metformin, sitagliptin, phentermine/topiramate only, phentermine/topiramate plus probenecid, phentermine/topiramate plus metformin, and phentermine/topiramate plus sitagliptin on Days 1–5, 6–10, 11–28, 29, 30–34, and 35–39, respectively. The significance of these interactions are unknown.
† See Drug Interactions (7)
Effect of Other Drugs on Phentermine/Topiramate
Table 9 describes the effect of other drugs on the pharmacokinetics of phentermine/topiramate.
Table 9. Effect of Co-administered Drugs on the Pharmacokinetics of Phentermine/Topiramate:
| Co-administered Drug and Dosing Regimen | Phentermine/Topiramate | ||
|---|---|---|---|
| Dose (mg) | Change in AUC | Change in Cmax | |
| Topiramate 92 mg single dose | 15 mg phentermine single dose | ↑ 42% | ↑ 13% |
| Phentermine 15 mg single dose | 92 mg topiramate single dose | ↑ 6% | ↑ 2% |
| *Metformin 500 mg BID for 5 days | 15 mg/92 mg dose QD for 16 days phentermine topiramate | ↑ 5% ↓ 5% | ↑ 7% ↓ 4% |
| *Sitagliptin 100 mg QD for 5 days | 15 mg/92 mg dose QD for 21 days phentermine topiramate | ↑ 9% ↓ 2% | ↑ 10% ↓ 2% |
| *Probenecid 2 g QD | 15 mg/92 mg dose QD for 11 days phentermine topiramate | ↓ 0.3% ↑ 0.7% | ↑ 4% ↑ 3% |
* The same single study examined the effect of multiple-dose 500 mg metformin twice daily, a single-dose 2 g probenecid, and multiple-dose 100 mg sitagliptin once daily on the pharmacokinetics of multiple-dose phentermine/topiramate 15 mg/92 mg once daily in 10 men and 10 women (mean BMI of 27.1 kg/m² and range of 22.2–32.7 kg/m²). The study participants received metformin, sitagliptin, phentermine/topiramate only, phentermine/topiramate plus probenecid, phentermine/topiramate plus metformin, and phentermine/topiramate plus sitagliptin on Days 1–5, 6–10, 11–28, 29, 30–34, and 35–39, respectively.
Effects of Topiramate Alone on Other Drugs and Effects of Other Drugs on Topiramate
Antiepileptic Drugs:
Potential interactions between topiramate and standard antiepileptic (AED) drugs were assessed in controlled clinical pharmacokinetic studies in patients with epilepsy. The effects of these interactions on mean plasma AUCs are summarized in Table 10.
In Table 10, the second column (AED concentration) describes what happens to the concentration of the AED listed in the first column when topiramate is added. The third column (topiramate concentration) describes how the co-administration of a drug listed in the first column modifies the concentration of topiramate in experimental settings when topiramate was given alone [see Drug Interactions (7)].
Table 10. Summary of AED Interactions with Topiramate:
| AED Co-administered | AED Concentration | Topiramate Concentration |
|---|---|---|
| Phenytoin | NC or 25% increase* | 48% decrease |
| Carbamazepine (CBZ) | NC | 40% decrease |
| CBZ epoxide† | NC | NE |
| Valproic acid | 11% decrease | 14% decrease |
| Phenobarbital | NC | NE |
| Primidone | NC | NE |
| Lamotrigine | NC at TPM doses up to 400 mg/day | 13% decrease |
NC = Less than 10% change in plasma concentration; NE = Not Evaluated; TPM = topiramate
* Plasma concentration increased 25% in some patients, generally those on a twice a day dosing regimen of phenytoin.
† Is not administered but is an active metabolite of carbamazepine.
Digoxin:
In a single-dose study, serum digoxin AUC was decreased by 12% with concomitant topiramate administration. The clinical relevance of this observation has not been established.
Hydrochlorothiazide:
A drug-drug interaction study conducted in healthy volunteers evaluated the steady-state pharmacokinetics of hydrochlorothiazide (HCTZ) (25 mg q24h) and topiramate (96 mg q12h) when administered alone and concomitantly. The results of this study indicate that topiramate Cmax increased by 27% and AUC increased by 29% when HCTZ was added to topiramate. The clinical significance of this change is unknown. The steady-state pharmacokinetics of HCTZ were not significantly influenced by the concomitant administration of topiramate. Clinical laboratory results indicated decreases in serum potassium after topiramate or HCTZ administration, which were greater when HCTZ and topiramate were administered in combination [see Drug Interactions (7) and Warnings and Precautions (5.15)].
Pioglitazone:
A drug-drug interaction study conducted in healthy volunteers evaluated the steady-state pharmacokinetics of topiramate (96 mg twice daily) and pioglitazone (30 mg daily) when administered alone and concomitantly for 7 days. A 15% decrease in the area under the concentration-time curve during a dosage interval at steady state (AUCτ,ss) of pioglitazone with no alteration in maximum steady-state plasma drug concentration during a dosage interval (Cmax,ss) was observed. This finding was not statistically significant. In addition, a 13% and 16% decrease in Cmax,ss and AUCτ,ss respectively, of the active hydroxy-metabolite was noted as well as a 60% decrease in Cmax,ss and AUCτ,ss of the active keto-metabolite [see Drug Interactions (7)].
Glyburide:
A drug-drug interaction study conducted in patients with type 2 diabetes evaluated the steady-state pharmacokinetics of glyburide (5 mg/day) alone and concomitantly with topiramate (150 mg/day). There was a 22% decrease in Cmax and a 25% reduction in AUC24 for glyburide during topiramate administration. Systemic exposure (AUC) of the active metabolites, 4-transhydroxyglyburide (M1), and 3cis-hydroxyglyburide (M2), was reduced by 13% and 15%, and Cmax was reduced by 18% and 25%, respectively. The steady-state pharmacokinetics of topiramate were unaffected by concomitant administration of glyburide.
Lithium:
In patients, the pharmacokinetics of lithium were unaffected during treatment with topiramate at doses of 200 mg/day; however, there was an observed increase in systemic exposure of lithium (27% for Cmax and 26% for AUC) following topiramate doses up to 600 mg/day.
Haloperidol:
The pharmacokinetics of a single dose of haloperidol (5 mg) were not affected following multiple dosing of topiramate (100 mg every 12 hours) in 13 healthy adults (6 males, 7 females).
Amitriptyline:
There was a 12% increase in AUC and Cmax for amitriptyline (25 mg per day) in 18 normal subjects (9 males, 9 females) receiving 200 mg/day of topiramate [see Drug Interactions (7)].
Sumatriptan:
Multiple dosing of topiramate (100 mg every 12 hrs) in 24 healthy volunteers (14 males, 10 females) did not affect the pharmacokinetics of single-dose sumatriptan either orally (100 mg) or subcutaneously (6 mg).
Risperidone:
When administered concomitantly with topiramate at escalating doses of 100, 250, and 400 mg/day, there was a reduction in risperidone systemic exposure (16% and 33% for steady-state AUC at the 250 and 400 mg/day doses of topiramate). No alterations of 9-hydroxyrisperidone levels were observed. Co-administration of topiramate 400 mg/day with risperidone resulted in a 14% increase in Cmax and a 12% increase in AUC12 of topiramate. There were no clinically significant changes in the systemic exposure of risperidone plus 9-hydroxyrisperidone or of topiramate; therefore, this interaction is not likely to be of clinical significance.
Propranolol:
Multiple dosing of topiramate (200 mg/day) in 34 healthy volunteers (17 males, 17 females) did not affect the pharmacokinetics of propranolol following daily 160 mg doses. Propranolol doses of 160 mg/day in 39 volunteers (27 males, 12 females) had no effect on the exposure to topiramate, at a dose of 200 mg/day of topiramate.
Dihydroergotamine:
Multiple dosing of topiramate (200 mg/day) in 24 healthy volunteers (12 males, 12 females) did not affect the pharmacokinetics of a 1 mg subcutaneous dose of dihydroergotamine. Similarly, a 1 mg subcutaneous dose of dihydroergotamine did not affect the pharmacokinetics of a 200 mg/day dose of topiramate in the same study.
Diltiazem:
Co-administration of diltiazem (240 mg Cardizem CD ) with topiramate (150 mg/day) resulted in a 10% decrease in Cmax and a 25% decrease in diltiazem AUC, a 27% decrease in Cmax and an 18% decrease in des-acetyl diltiazem AUC, and no effect on N-desmethyl diltiazem. Co-administration of topiramate with diltiazem resulted in a 16% increase in Cmax and a 19% increase in AUC12 of topiramate.
Venlafaxine:
Multiple dosing of topiramate (150 mg/day) in healthy volunteers did not affect the pharmacokinetics of venlafaxine or O-desmethyl venlafaxine. Multiple dosing of venlafaxine (150 mg extended release) did not affect the pharmacokinetics of topiramate.
13.1. Carcinogenesis, Mutagenesis, Impairment of Fertility
Phentermine/Topiramate
No animal studies have been conducted with the combination of phentermine/topiramate to evaluate carcinogenesis, mutagenesis, or impairment of fertility. The following data are based on findings in studies performed individually with phentermine or topiramate, QSYMIA's two active ingredients.
Phentermine
Phentermine was not mutagenic or clastogenic with or without metabolic activation in the Ames bacterial mutagenicity assay, a chromosomal aberration test in Chinese hamster lung (CHL-K1) cells, or an in vivo micronucleus assay.
Rats were administered oral doses of 3, 10, and 30 mg/kg/day phentermine for 2 years. There was no evidence of carcinogenicity at the highest dose of phentermine (30 mg/kg) which is approximately 11 to 15 times the maximum recommended clinical dose of QSYMIA 15 mg/92 mg based on AUC exposure.
No animal studies have been conducted with phentermine to determine the potential for impairment of fertility.
Topiramate
Topiramate did not demonstrate genotoxic potential when tested in a battery of in vitro and in vivo assays. Topiramate was not mutagenic in the Ames test or the in vitro mouse lymphoma assay; it did not increase unscheduled DNA synthesis in rat hepatocytes in vitro; and it did not increase chromosomal aberrations in human lymphocytes in vitro or in rat bone marrow in vivo.
An increase in urinary bladder tumors was observed in mice given topiramate (20, 75, and 300 mg/kg) in the diet for 21 months. The elevated bladder tumor incidence, which was statistically significant in males and females receiving 300 mg/kg, was primarily due to the increased occurrence of a smooth muscle tumor considered histomorphologically unique to mice. Plasma exposures in mice receiving 300 mg/kg were approximately 2 to 4 times steady-state exposures measured in patients receiving topiramate monotherapy at the MRHD of QSYMIA 15 mg/92 mg. The relevance of this finding to human carcinogenic risk is uncertain. No evidence of carcinogenicity was seen in rats following oral administration of topiramate for 2 years at doses up to 120 mg/kg (approximately 4 to 10 times the MRHD of QSYMIA based on AUC estimates).
No adverse effects on male or female fertility were observed in rats at doses up to 100 mg/kg (approximately 4 to 8 times male and female MRHD exposures of QSYMIA based on AUC).
14. Clinical Studies
Clinical Studies in Adults
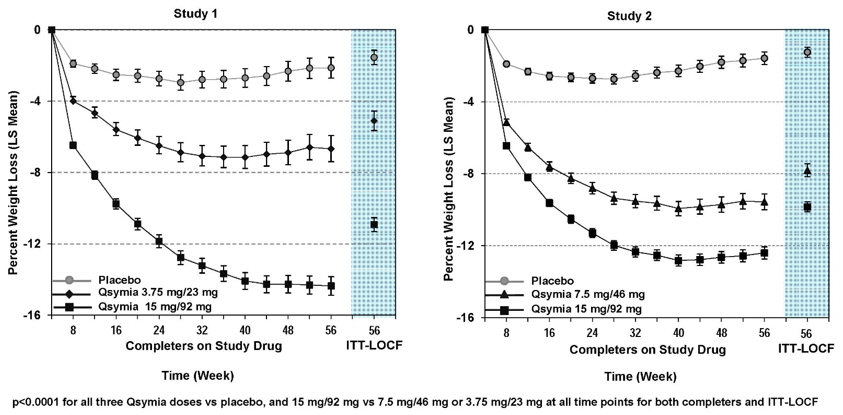
The effect of QSYMIA on weight loss in conjunction with reduced caloric intake and increased physical activity was studied in two randomized, double-blind, placebo-controlled studies in patients with obesity (Study 1) and patients with obesity or overweight with two or more significant co-morbidities (Study 2). Both studies had a 4-week titration period, followed by 52 weeks of treatment. There were two co-primary efficacy outcomes measured after 1 year of treatment (Week 56): 1) the percent weight loss from baseline; and 2) treatment response defined as achieving at least 5% weight loss from baseline.
In Study 1, patients with obesity (BMI greater than or equal to 35 kg/m²) were randomized to receive 1 year of treatment with placebo (N=514), QSYMIA 3.75 mg/23 mg (N=241), or QSYMIA 15 mg/92 mg (N=512) in a 2:1:2 ratio. Patients ranged in age from 18-71 years old (mean age 43) and 83% were female. Approximately 80% were Caucasian, 18% were African American, and 15% were Hispanic/Latino. At the beginning of the study the average weight and BMI of patients was 116 kg and 42 kg/m², respectively. Patients with type 2 diabetes were excluded from participating in Study 1. During the study, a well-balanced, reduced-calorie diet to result in an approximate 500 kcal/day decrease in caloric intake was recommended to all patients and patients were offered nutritional and lifestyle modification counseling.
In Study 2, patients with overweight or obesity were randomized to receive 1 year of treatment with placebo (N=994), QSYMIA 7.5 mg/46 mg (N=498), or QSYMIA 15 mg/92 mg (N=995) in a 2:1:2 ratio. Eligible patients had to have a BMI greater than or equal to 27 kg/m² and less than or equal to 45 kg/m² (there was no lower limit on BMI for patients with type 2 diabetes) and two or more of the following obesity-related co-morbid conditions:
- Elevated blood pressure (greater than or equal to 140/90 mmHg, or greater than or equal to 130/85 mmHg for diabetics) or requirement for greater than or equal to 2 antihypertensive medications;
- Triglycerides greater than 200-400 mg/dL or were receiving treatment with 2 or more lipid-lowering agents;
- Elevated fasting blood glucose (greater than 100 mg/dL) or diabetes; and/or
- Waist circumference greater than or equal to 102 cm for men or greater than or equal to 88 cm for women.
Patients ranged in age from 19-71 years old (mean age 51) and 70% were female. Approximately 86% were Caucasian, 12% were African American, and 13% were Hispanic/Latino. The average weight and BMI of patients at the start of the study was 103 kg and 36.6 kg/m², respectively. Approximately half (53%) of patients had hypertension at the start of the study. There were 388 (16%) patients with type 2 diabetes at the start of the study. During the study, a well-balanced, reduced-calorie diet to result in an approximate 500 kcal/day decrease in caloric intake was recommended to all patients and patients were offered nutritional and lifestyle modification counseling.
The percentage of randomized patients who withdrew from each study prior to week 56 was 40% in Study 1, and 31% in Study 2.
Table 11 provides the results for weight loss at 1 year in Studies 1 and 2. After 1 year of treatment with QSYMIA, all dose levels resulted in statistically significant weight loss compared to placebo (see Table 11, Figure 1 and Figure 2). A statistically significant greater proportion of the patients randomized to QSYMIA than placebo achieved 5% and 10% weight loss.
Table 11. Weight Loss at One Year in Adult Patients in Studies 1 and 2:
| Study 1 (Obesity) | Study 2 (Obesity or Overweight with Co-morbidities) | |||||
|---|---|---|---|---|---|---|
| Analysis Method | Placebo | QSYMIA 3.75 mg/23 mg | QSYMIA 15 mg/92 mg | Placebo | QSYMIA 7.5 mg/46 mg | QSYMIA 15 mg/92 mg |
| ITT-LOCF (Primary)* | n = 498 | n = 234 | n = 498 | n = 979 | n = 488 | n = 981 |
| Weight (kg) | ||||||
| Baseline mean (SD) | 115.7 (21.4) | 118.6 (21.9) | 115.2 (20.8) | 103.3 (18.1) | 102.8 (18.2) | 103.1 (17.6) |
| % LS Mean Change from baseline (SE)† | -1.6 (0.4) | -5.1 (0.5)‡ | -10.9 (0.4)‡§ | -1.2 (0.3) | -7.8 (0.4)‡ | -9.8 (0.3)‡§ |
| Difference from placebo (95% CI) | 3.5 (2.4-4.7) | 9.4 (8.4-10.3) | 6.6 (5.8-7.4) | 8.6 (8.0-9.3) | ||
| Percentage of patients losing greater than or equal to 5% body weight | 17% | 45%‡ | 67%‡§ | 21% | 62%‡ | 70%‡§ |
| Risk Difference vs. placebo (95% CI) | 27.6 (20.4-34.8) | 49.4 (44.1-54.7) | 41.3 (36.3-46.3) | 49.2 (45.4-53.0) | ||
| Percentage of patients losing greater than or equal to 10% body weight | 7% | 19%‡ | 47%‡§ | 7% | 37%‡ | 48%‡§ |
| Risk Difference vs. placebo (95% CI) | 11.4 (5.9-16.9) | 39.8 (34.8-44.7) | 29.9 (25.3-34.5) | 40.3 (36.7-43.8) | ||
SD=standard deviation; LS=least-squares; SE=standard error; CI=confidence interval
Type 1 error was controlled across all pairwise treatment comparisons.
* Uses all available data from subjects in ITT population, including data collected from subjects who discontinued drug but remained on study. Last Observation Carried Forward (LOCF) method used to impute missing data.
† Adjusted for baseline bodyweight (Study 1) and baseline bodyweight and diabetic status (Study 2).
‡ p<0.0001 vs. placebo based on least-squares (LS) mean from an analysis of covariance.
§ p<0.01 vs. 3.75 mg/23 mg (Study 1) or 7.5 mg/46 mg (Study 2) dose.
Figure 1. Study 1 Percent Weight Change from Baseline to Week 56 in Adults with Obesity - Figure 2. Study 2 Percent Weight Change from Baseline to Week 56 in Adults with Obesity or Overweight with Co-morbidities:
The changes in cardiovascular, metabolic, and anthropometric risk factors associated with obesity from Study 1 and 2 are presented in Table 12 and Table 13. One year of therapy with QSYMIA resulted in relative improvement over placebo in several risk factors associated with obesity with the exception of heart rate [see Warnings and Precautions (5.2)].
Table 12. Least-Squares (LS) Mean* Change from Baseline and Treatment Difference from Placebo in Cardiometabolic Parameters in Adults Following One Year of Treatment in Study 1 (Obesity):
| Study 1 (Obesity) | Placebo (N=498) | QSYMIA 3.75 mg/23 mg (N=234) | QSYMIA 15 mg/92 mg (N=498) | QSYMIA – Placebo: LS Mean | |
|---|---|---|---|---|---|
| QSYMIA 3.75 mg/23 mg | QSYMIA 15 mg/92 mg | ||||
| Heart Rate, bpm | |||||
| Baseline mean (SD) | 73.2 (8.8) | 72.3 (9.2) | 73.1 (9.6) | +1.1 | +1.8 |
| LS Mean Change (SE) | -0.8 (0.5) | +0.3 (0.6) | +1.0 (0.5) | ||
| Systolic Blood Pressure, mmHg | |||||
| Baseline mean (SD) | 121.9 (11.5) | 122.5 (11.1) | 121.9 (11.6) | -2.8 | -3.8 |
| LS Mean Change (SE) | +0.9 (0.6) | -1.8 (0.8) | -2.9 (0.6) | ||
| Diastolic Blood Pressure, mmHg | |||||
| Baseline mean (SD) | 77.2 (7.9) | 77.8 (7.5) | 77.4 (7.7) | -0.5 | -1.9 |
| LS Mean Change (SE) | +0.4 (0.4) | -0.1 (0.6) | -1.5 (0.4) | ||
| Total Cholesterol, % | |||||
| Baseline mean (SD) | 194.3 (36.7) | 196.3 (36.5) | 192.7 (33.8) | -1.9 | -2.5 |
| LS Mean Change (SE) | -3.5 (0.6) | -5.4 (0.9) | -6.0 (0.6) | ||
| LDL-Cholesterol, % | |||||
| Baseline mean (SD) | 120.9 (32.2) | 122.8 (33.4) | 120.0 (30.1) | -2.2 | -2.8 |
| LS Mean Change (SE) | -5.5 (1.0) | -7.7 (1.3) | -8.4 (0.9) | ||
| HDL-Cholesterol, % | |||||
| Baseline mean (SD) | 49.5 (13.3) | 50.0 (11.1) | 49.7 (11.7) | +0.5 | +3.5 |
| LS Mean Change (SE) | +0.0 (0.8) | +0.5 (1.1) | +3.5 (0.8) | ||
| Triglycerides, % | |||||
| Baseline mean (SD) | 119.0 (39.3) | 117.5 (40.3) | 114.6 (37.1) | -3.9 | -14.3 |
| LS Mean Change (SE) | +9.1 (2.3) | +5.2 (3.1) | -5.2 (2.2) | ||
| Fasting Glucose, mg/dL | |||||
| Baseline mean (SD) | 93.1 (8.7) | 93.9 (9.2) | 93.0 (9.5) | -1.2 | -2.5 |
| LS Mean Change (SE) | +1.9 (0.5) | +0.8 (0.7) | -0.6 (0.5) | ||
| Waist Circumference, cm | |||||
| Baseline mean (SD) | 120.5 (14.0) | 121.5 (15.2) | 120.0 (14.7) | -2.5† | -7.8† |
| LS Mean Change (SE) | -3.1 (0.5) | -5.6 (0.6) | -10.9 (0.5) | ||
SD=standard deviation; SE=standard error
* Study 1 adjusted for baseline bodyweight
† Statistically significant versus placebo based on the pre-specified method for controlling Type I error across multiple doses
Table 13. Least-Squares (LS) Mean* Change from Baseline and Treatment Difference from Placebo in Cardiometabolic Parameters in Adults Following One Year of Treatment in Study 2 (Obese or Overweight with Comorbidities):
| Study 2 (Overweight and Obese with Comorbidities) | Placebo (N=979) | QSYMIA 7.5 mg/46 mg (N=488) | QSYMIA 15 mg/92 mg (N=981) | QSYMIA – Placebo: LS Mean | |
|---|---|---|---|---|---|
| QSYMIA 7.5 mg/46 mg | QSYMIA 15 mg/92 mg | ||||
| Heart Rate, bpm | |||||
| Baseline mean (SD) | 72.1 (9.9) | 72.2 (10.1) | 72.6 (10.1) | +0.6 | +1.7 |
| LS Mean Change (SE) | -0.3 (0.3) | +0.3 (0.4) | +1.4 (0.3) | ||
| Systolic Blood Pressure, mmHg | |||||
| Baseline mean (SD) | 128.9 (13.5) | 128.5 (13.6) | 127.9 (13.4) | -2.3 | -3.2 |
| LS Mean Change (SE) | -2.4 (0.48) | -4.7 (0.63) | -5.6 (0.5) | ||
| Diastolic Blood Pressure, mmHg | |||||
| Baseline mean (SD) | 81.1 (9.2) | 80.6 (8.7) | 80.2 (9.1) | -0.7 | -1.1 |
| LS Mean Change (SE) | -2.7 (0.3) | -3.4 (0.4) | -3.8 (0.3) | ||
| Total Cholesterol, % | |||||
| Baseline mean (SD) | 205.8 (41.7) | 201.0 (37.9) | 205.4 (40.4) | -1.6 | -3.0 |
| LS Mean Change (SE) | -3.3 (0.5) | -4.9 (0.7) | -6.3 (0.5) | ||
| LDL-Cholesterol, % | |||||
| Baseline mean (SD) | 124.2 (36.2) | 120.3 (33.7) | 123.9 (35.6) | +0.4 | -2.8 |
| LS Mean Change (SE) | -4.1 (0.9) | -3.7 (1.1) | -6.9 (0.9) | ||
| HDL-Cholesterol, % | |||||
| Baseline mean (SD) | 48.9 (13.8) | 48.5 (12.8) | 49.1 (13.8) | +4.0 | +5.6 |
| LS Mean Change (SE) | +1.2 (0.7) | +5.2 (0.9) | +6.8 (0.7) | ||
| Triglycerides, % | |||||
| Baseline mean (SD) | 163.5 (76.3) | 161.1 (72.2) | 161.9 (73.4) | -13.3 | -15.3 |
| LS Mean Change (SE) | +4.7 (1.7) | -8.6 (2.2) | -10.6 (1.7) | ||
| Fasting Insulin, (µIU/mL) | |||||
| Baseline mean (SD) | 17.8 (13.2) | 18.0 (12.9) | 18.4 (17.5) | -4.2 | -4.7 |
| LS Mean Change (SE) | +0.7 (0.8) | -3.5 (1.1) | -4.0 (0.8) | ||
| Fasting Glucose, mg/dL | |||||
| Baseline mean (SD) | 106.6 (23.7) | 106.2 (21.0) | 105.7 (21.4) | -2.4 | -3.6 |
| LS Mean Change (SE) | +2.3 (0.6) | -0.1 (0.8) | -1.3 (0.6) | ||
| Waist Circumference, cm | |||||
| Baseline mean (SD) | 113.4 (12.2) | 112.7 (12.4) | 113.2 (12.2) | -5.2† | -6.8† |
| LS Mean Change (SE) | -2.4 (0.3) | -7.6 (0.4) | -9.2 (0.3) | ||
SD=standard deviation; SE=standard error
* Study 2 adjusted for baseline bodyweight and diabetic status
† Statistically significant versus placebo based on the pre-specified method for controlling Type I error across multiple doses
Among the 388 subjects with type 2 diabetes treated in Study 2, reductions in HbA1c from baseline (6.8%) were 0.1% for placebo compared to 0.4% and 0.4% with QSYMIA 7.5 mg/46 mg and QSYMIA 15 mg/92 mg, respectively [see Warnings and Precautions (5.10)].
Clinical Studies in Pediatric Patients Aged 12 Years and Older
The effect of QSYMIA on BMI in conjunction with reduced caloric intake and increased physical activity was evaluated in Study 3 (NCT 03922945), a 56-week, randomized, double-blind, placebo-controlled study in pediatric patients (12 to 17 years of age) with BMI ≥ 95th percentile standardized by age and sex. Patients were randomized to receive treatment with placebo (N=56), QSYMIA 7.5 mg/46 mg (N=54), or QSYMIA 15 mg/92 mg (N=113) in a 1:1:2 ratio. During the study, a well-balanced, reduced-calorie diet to result in an approximate 500 kcal/day decrease in caloric intake was recommended to all patients and patients were offered a family-based lifestyle modification program for adolescents.
Patients' mean age was 14 years old, approximately 55% were female, 67% were Caucasian, 26% were African American, and 33% were Hispanic/Latino. At the beginning of the study, the average weight and BMI of patients was 106 kg and 38 kg/m², respectively, with approximately 81% considered severely obese (120% of the 95th percentile or greater for BMI standardized by age and sex). Thirty-eight (38%) of randomized patients withdrew from the study prior to week 56.
The primary efficacy parameter was mean percent change in BMI. Table 14 provides results for BMI reduction at Week 56 in Study 3. After 56 weeks of treatment with QSYMIA, all dose levels resulted in statistically significant reduction in BMI compared to placebo (see Table 14, Figure 3). A greater proportion of patients randomized to QSYMIA than placebo achieved 5%, 10%, and 15% BMI reduction.
Table 14. Change in BMI at Week 56 in Pediatric Patients Aged 12 to 17 Years in Study 3 (Obesity):
| Analysis Method | Placebo | QSYMIA 7.5 mg/46 mg | QSYMIA 15 mg/92 mg |
|---|---|---|---|
| ITT-Washout (Primary)* | n = 56 | n = 54 | n = 113 |
| BMI (kg/m²) Primary Efficacy Endpoint | |||
| Baseline mean (SD) | 36.4 (6.4) | 36.9 (6.7) | 39.0 (7.4) |
| % LS Mean Change from baseline (SE) | +3.3 (1.4) | -4.8 (1.3) | -7.1 (1.0) |
| Difference from placebo (95% CI) | -8.1 (-11.9, -4.3) | -10.4 (-13.9, -7.0) | |
| Percentage of patients with a reduction of greater than or equal to 5% BMI | 13.6% | 44.0% | 52.2% |
| Difference vs. placebo (95% CI) | 29.7% (11.2, 48.3) | 38.6% (23.1, 54.1) | |
| Percentage of patients with a reduction of greater than or equal to 10% BMI | 4.5% | 33.5% | 44.4% |
| Difference vs. placebo (95% CI) | 28.8% (13.6, 44.0) | 40.5% (28.4, 52.6) | |
| Percentage of patients with a reduction of greater than or equal to 15% BMI | 2.9% | 13.6% | 28.9% |
| Difference vs. placebo (95% CI) | 11.7% (1.3, 22.2) | 27.4% (17.7, 37.1) | |
SD=standard deviation; LS=least-squares; SE=standard error; CI=confidence interval
* Missing data were imputed using a washout multiple imputation method based on placebo response.
Figure 3. Study 3 Percent BMI Change from Baseline to Week 56 in Pediatric Patients Aged 12 to 17 Years with Obesity:
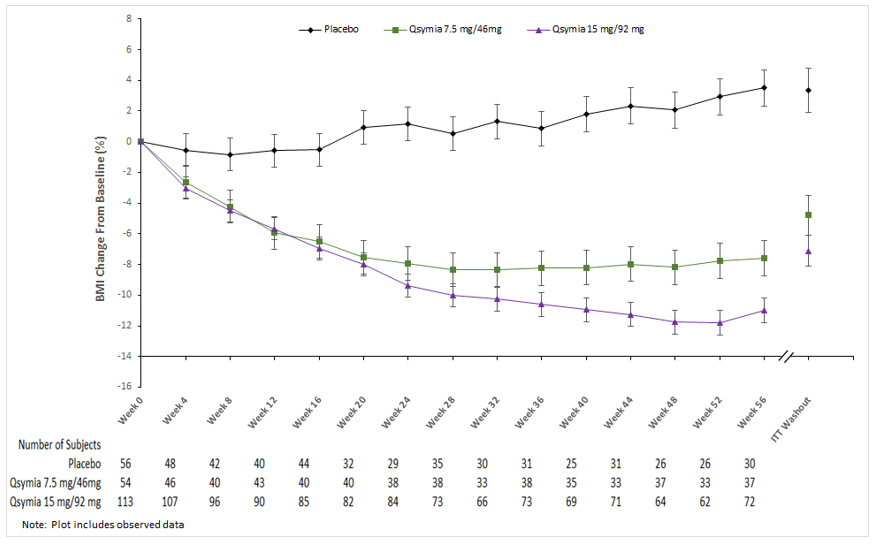
Table 15. Change from Baseline and Treatment Difference from Placebo in Cardiometabolic Parameters in Pediatric Patients Aged 12 to 17 Years Following 56 Weeks of Treatment in Study 3 (Obesity):
| Study 3 (Obesity) ITT Population | Placebo (N=56) | QSYMIA 7.5 mg/46 mg (N=54) | QSYMIA 15 mg/92 mg (N=113) | QSYMIA – Placebo | |
|---|---|---|---|---|---|
| QSYMIA 7.5 mg/46 mg | QSYMIA 15 mg/92 mg | ||||
| Heart Rate, bpm* | |||||
| Baseline mean (SD) | 76.8 (9.9) | 78.6 (9.6) | 76.2 (9.6) | -5.6 | 3.2 |
| Mean Change (SD) | 2.5 (12.4) | -3.1 (8.4) | 5.7 (11.4) | ||
| Systolic Blood Pressure, mmHg | |||||
| Baseline mean (SD) | 117.7 (10.4) | 121.4 (9.2) | 117.4 (10.2) | -2.8 | -1.0 |
| LS Mean Change (SE) | +2.9 (1.6) | +0.1 (1.5) | +1.8 (1.1) | ||
| Diastolic Blood Pressure, mmHg | |||||
| Baseline mean (SD) | 71.7 (8.3) | 75.8 (6.7) | 72.9 (7.3) | -3.2 | -2.2 |
| LS Mean Change (SE) | +3.4 (1.5) | +0.2 (1.3) | +1.2 (1.0) | ||
| Total Cholesterol, mg/dL* | |||||
| Baseline mean (SD) | 164.9 (30.9) | 160.6 (26.1) | 159.3 (32.7) | -1.4 | -1.2 |
| Mean % Change (SD) | -1.8 (10.7) | -3.2 (13.1) | -3.0 (14.5) | ||
| LDL-Cholesterol, mg/dL* | |||||
| Baseline mean (SD) | 94.1 (26.8) | 89.4 (23.7) | 90.2 (27.3) | -3.9 | -2.1 |
| Mean % Change (SD) | 0.2 (23.3) | -3.7 (15.5) | -2.3 (21.6) | ||
| HDL-Cholesterol, mg/dL | |||||
| Baseline mean (SD) | 47.2 (9.7) | 47.2 (8.9) | 46.7 (10.1) | 6.4 | 5.0 |
| LS Mean % Change (SE) | -4.3 (15.1) | +2.1 (11.5) | +0.7 (9.6) | ||
| Triglycerides, mg/dL | |||||
| Baseline mean (SD) | 118.3 (46.1) | 120.1 (61.6) | 112.2 (63.2) | -11.7 | -11.2 |
| LS Mean % Change (SE) | +5.6 (8.4) | -6.2 (8.0) | -5.6 (7.2) | ||
| HbA1c, %* | |||||
| Baseline mean (SD) | 5.5 (0.3) | 5.6 (0.4) | 5.5 (0.4) | -0.2 | 0.0 |
| Mean Change (SD) | -0.2 (0.2) | -0.4 (0.3) | -0.2 (0.3) | ||
| Waist Circumference, cm | |||||
| Baseline mean (SD) | 111.1 (14.0) | 111.9 (15.5) | 116.5 (16.8) | -5.6 | -7.6 |
| LS Mean Change (SE) | +0.6 (1.4) | -5.0 (1.4) | -7.0 (1.1) | ||
SD=standard deviation; SE=standard error
© All content on this website, including data entry, data processing, decision support tools, "RxReasoner" logo and graphics, is the intellectual property of RxReasoner and is protected by copyright laws. Unauthorized reproduction or distribution of any part of this content without explicit written permission from RxReasoner is strictly prohibited. Any third-party content used on this site is acknowledged and utilized under fair use principles.