RINVOQ Extended-release tablet Ref.[10384] Active ingredients: Upadacitinib
Source: FDA, National Drug Code (US) Revision Year: 2020
12.1. Mechanism of Action
Upadacitinib is a Janus kinase (JAK) inhibitor. JAKs are intracellular enzymes which transmit signals arising from cytokine or growth factor-receptor interactions on the cellular membrane to influence cellular processes of hematopoiesis and immune cell function. Within the signaling pathway, JAKs phosphorylate and activate Signal Transducers and Activators of Transcription (STATs) which modulate intracellular activity including gene expression. Upadacitinib modulates the signaling pathway at the point of JAKs, preventing the phosphorylation and activation of STATs.
JAK enzymes transmit cytokine signaling through their pairing (e.g., JAK1/JAK2, JAK1/JAK3, JAK1/TYK2, JAK2/JAK2, JAK2/TYK2). In a cell-free isolated enzyme assay, upadacitinib had greater inhibitory potency at JAK1 and JAK2 relative to JAK3 and TYK2. In human leukocyte cellular assays, upadacitinib inhibited cytokine-induced STAT phosphorylation mediated by JAK1 and JAK1/JAK3 more potently than JAK2/JAK2 mediated STAT phosphorylation. However, the relevance of inhibition of specific JAK enzymes to therapeutic effectiveness is not currently known.
12.2. Pharmacodynamics
Inhibition of IL-6 induced STAT3 and IL-7 induced STAT5 phosphorylation
In healthy volunteers, the administration of upadacitinib (immediate release formulation) resulted in a dose- and concentration-dependent inhibition of IL-6 (JAK1/JAK2)-induced STAT3 and IL-7 (JAK1/JAK3)-induced STAT5 phosphorylation in whole blood. The maximal inhibition was observed 1 hour after dosing which returned to near baseline by the end of dosing interval.
Lymphocytes
Treatment with upadacitinib was associated with a small, transient increase in mean ALC from baseline up to Week 36 which gradually returned to, at or near baseline levels with continued treatment.
Immunoglobulins
In the controlled period, small decreases from baseline in mean IgG and IgM levels were observed with upadacitinib treatment; however, the mean values at baseline and at all visits were within the normal reference range.
Cardiac Electrophysiology
At 6 times the mean maximum exposure of the 15 mg once daily dose, there was no clinically relevant effect on the QTc interval.
12.3. Pharmacokinetics
Upadacitinib plasma exposures are proportional to dose over the therapeutic dose range. Steady-state plasma concentrations are achieved within 4 days with minimal accumulation after multiple once-daily administrations.
Absorption
Following oral administration of upadacitinib extended-release formulation, upadacitinib is absorbed with a median Tmax of 2 to 4 hours.
Coadministration of upadacitinib with a high-fat/ high-calorie meal had no clinically relevant effect on upadacitinib exposures (increased AUCinf by 29% and Cmax by 39%). In clinical trials, upadacitinib was administered without regard to meals [see Dosage and Administration (2.1)].
Distribution
Upadacitinib is 52% bound to plasma proteins. Upadacitinib partitions similarly between plasma and blood cellular components with a blood to plasma ratio of 1.0.
Metabolism
Upadacitinib metabolism is mediated by mainly CYP3A4 with a potential minor contribution from CYP2D6. The pharmacologic activity of upadacitinib is attributed to the parent molecule. In a human radiolabeled study, unchanged upadacitinib accounted for 79% of the total radioactivity in plasma while the main metabolite detected (product of monooxidation followed by glucuronidation) accounted for 13% of the total plasma radioactivity. No active metabolites have been identified for upadacitinib.
Elimination
Following single dose administration of [14C]-upadacitinib immediate-release solution, upadacitinib was eliminated predominantly as the unchanged parent substance in urine (24%) and feces (38%). Approximately 34% of upadacitinib dose was excreted as metabolites. Upadacitinib mean terminal elimination half-life ranged from 8 to 14 hours.
Specific Populations
Body Weight, Gender, Race, and Age
Body weight, gender, race, ethnicity, and age did not have a clinically meaningful effect on upadacitinib exposure [see Use in Specific Populations (8.5)].
Renal Impairment
Renal impairment has no clinically relevant effect on upadacitinib exposure. Upadacitinib AUCinf was 18%, 33%, and 44% higher in subjects with mild, moderate, and severe renal impairment, respectively, compared to subjects with normal renal function. Upadacitinib Cmax was similar in subjects with normal and impaired renal function.
Hepatic Impairment
Mild (Child-Pugh A) and moderate (Child-Pugh B) hepatic impairment has no clinically relevant effect on upadacitinib exposure. Upadacitinib AUCinf was 28% and 24% higher in subjects with mild and moderate hepatic impairment, respectively, compared to subjects with normal liver function. Upadacitinib Cmax was unchanged in subjects with mild hepatic impairment and 43% higher in subjects with moderate hepatic impairment compared to subjects with normal liver function. Upadacitinib was not studied in patients with severe hepatic impairment (Child-Pugh C).
Drug Interaction Studies
Potential for Other Drugs to Influence the Pharmacokinetics of Upadacitinib
Upadacitinib is metabolized in vitro by CYP3A4 with a minor contribution from CYP2D6. The effect of co-administered drugs on upadacitinib plasma exposures is provided in Table 3 [see Drug Interactions (7)].
Table 3. Change in Pharmacokinetics of Upadacitinib in the Presence of Co-administered Drugs:
| Co-administered Drug | Regimen of Co-administered Drug | Ratio (90% CI)a | |
|---|---|---|---|
| Cmax | AUC | ||
| Methotrexate | 10 to 25 mg/week | 0.97 (0.86-1.09) | 0.99 (0.93-1.06) |
| Strong CYP3A4 inhibitor: Ketoconazole | 400 mg once daily x 6 days | 1.70 (1.55-1.89) | 1.75 (1.62-1.88) |
| Strong CYP3A4 inducer: Rifampin | 600 mg once daily x 9 days | 0.49 (0.44-0.55) | 0.39 (0.37-0.42) |
| OATP1B inhibitor: Rifampin | 600 mg single dose | 1.14 (1.02-1.28) | 1.07 (1.01-1.14) |
CI: Confidence interval
a Ratios for Cmax and AUC compare co-administration of the medication with upadacitinib vs. administration of upadacitinib alone.
pH modifying medications (e.g., antacids or proton pump inhibitors) are not expected to affect upadacitinib plasma exposures based on in vitro assessments and population pharmacokinetic analyses. CYP2D6 metabolic phenotype had no effect on upadacitinib pharmacokinetics (based on population pharmacokinetic analyses), indicating that inhibitors of CYP2D6 have no clinically relevant effect on upadacitinib exposures.
Potential for Upadacitinib to Influence the Pharmacokinetics of Other Drugs
In vitro studies indicate that upadacitinib does not inhibit or induce the activity of cytochrome P450 (CYP) enzymes (CYP1A2, CYP2B6, CYP2C8, CYP2C9, CYP2C19, CYP2D6, and CYP3A4) at clinically relevant concentrations. In vitro studies indicate that upadacitinib does not inhibit the transporters P-gp, BCRP, OATP1B1, OATP1B3, OCT1, OCT2, OAT1, OAT3, MATE1, and MATE2K at clinically relevant concentrations.
Clinical studies indicate that upadacitinib has no clinically relevant effects on the pharmacokinetics of co-administered drugs. Summary of results from clinical studies which evaluated the effect of upadacitinib on other drugs is provided in Table 4.
Table 4. Change in Pharmacokinetics of Co-administered Drugs or In Vivo Markers of CYP Activity in the Presence of Upadacitinib:
| Co-administered Drug or CYP Activity Marker | Multiple-Dose Regimen of Upadacitinib | Ratio (90% CI)a | |
|---|---|---|---|
| Cmax | AUC | ||
| Methotrexate | 6 mg to 24 mg BIDb | 1.03 (0.86-1.23) | 1.14 (0.91-1.43) |
| Sensitive CYP1A2 Substrate: Caffeine | 30 mg QDc | 1.13 (1.05-1.22) | 1.22 (1.15-1.29) |
| Sensitive CYP3A Substrate: Midazolam | 30 mg QDc | 0.74 (0.68-0.80) | 0.74 (0.68-0.80) |
| Sensitive CYP2D6 Substrate: Dextromethorphan | 30 mg QDc | 1.09 (0.98-1.21) | 1.07 (0.95-1.22) |
| Sensitive CYP2C9 Substrate: S-Warfarin | 30 mg QDc | 1.07 (1.02-1.11) | 1.11 (1.07-1.15) |
| Sensitive CYP2C19 Marker: 5-OH Omeprazole to Omeprazole metabolic ratio | 30 mg QD c | -- | 1.09 (1.00-1.19) |
| CYP2B6 Substrate: Bupropion | 30 mg QD c | 0.87 (0.79-0.96) | 0.92 (0.87-0.98) |
| Rosuvastatin | 30 mg QDc | 0.77 (0.63-0.94) | 0.67 (0.56-0.82) |
| Atorvastatin | 30 mg QDc | 0.88 (0.79-0.97) | 0.77 (0.70-0.85) |
| Ethinylestradiol | 30 mg QDc | 0.96 (0.89-1.02) | 1.11 (1.04-1.19) |
| Levonorgestrel | 30 mg QDc | 0.96 (0.87-1.06) | 0.96 (0.85-1.07) |
CYP: cytochrome P450; CI: Confidence interval; BID: twice daily; QD: once daily
a Ratios for Cmax and AUC compare co-administration of the medication with upadacitinib vs. administration of medication alone.
b Immediate-release formulation
c Extended-release formulation
13.1. Carcinogenesis, Mutagenesis, Impairment of Fertility
Carcinogenesis
The carcinogenic potential of upadacitinib was evaluated in Sprague-Dawley rats and Tg.rasH2 mice. No evidence of tumorigenicity was observed in male or female rats that received upadacitinib for up to 101 weeks at oral doses up to 15 or 20 mg/kg/day, respectively (approximately 4 and 10 times the MRHD on an AUC basis, respectively). No evidence of tumorigenicity was observed in male or female Tg.rasH2 mice that received upadacitinib for 26 weeks at oral doses up to 20 mg/kg/day.
Mutagenesis
Upadacitinib tested negatively in the following genotoxicity assays: the in vitro bacterial mutagenicity assay (Ames assay), in vitro chromosome aberration assay in human peripheral blood lymphocytes, and in vivo rat bone marrow micronucleus assay.
Impairment of Fertility
Upadacitinib had no effect on fertility in male or female rats at oral doses up to 50 mg/kg/day in males and 75 mg/kg/day in females (approximately 42 and 84 times the MRHD in males and females, respectively, on an AUC basis). However, maintenance of pregnancy was adversely affected at oral doses of 25 mg/kg/day and 75 mg/kg/day based upon dose-related findings of increased post-implantation losses (increased resorptions) and decreased numbers of mean viable embryos per litter (approximately 22 and 84 times the MRHD on an AUC basis, respectively). The number of viable embryos was unaffected in female rats that received upadacitinib at an oral dose of 5 mg/kg/day and were mated to males that received the same dose (approximately 2 times the MRHD on an AUC basis).
14. Clinical Studies
The efficacy and safety of RINVOQ 15 mg once daily were assessed in five Phase 3 randomized, double-blind, multicenter studies in patients with moderately to severely active rheumatoid arthritis and fulfilling the ACR/EULAR 2010 classification criteria. Patients 18 years of age and older were eligible to participate. The presence of at least 6 tender and 6 swollen joints and evidence of systemic inflammation based on elevation of hsCRP was required at baseline. Although other doses have been studied, the recommended dose of RINVOQ is 15 mg once daily.
Study RA-I (NCT02706873) was a 24-week monotherapy trial in 947 patients with moderately to severely active rheumatoid arthritis who were naïve to methotrexate (MTX). Patients received RINVOQ 15 mg or upadacitinib 30 mg once daily or MTX as monotherapy. At Week 26, non-responding patients on upadacitinib could be rescued with the addition of MTX, while patients on MTX could be rescued with the addition of blinded RINVOQ 15 mg or upadacitinib 30 mg once daily. The primary endpoint was the proportion of patients who achieved an ACR50 response at Week 12. Key secondary endpoints included disease activity score (DAS28-CRP) ≤3.2 at Week 12, DAS28-CRP <2.6 at Week 24, change from baseline in HAQ-DI at Week 12, and change from baseline in van der Heijde-modified total Sharp Score (mTSS) at Week 24.
Study RA-II (NCT02706951) was a 14-week monotherapy trial in 648 patients with moderately to severely active rheumatoid arthritis who had an inadequate response to MTX. Patients received RINVOQ 15 mg or upadacitinib 30 mg once daily monotherapy or continued their stable dose of MTX monotherapy. At Week 14, patients who were randomized to MTX were advanced to RINVOQ 15 mg or upadacitinib 30 mg once daily monotherapy in a blinded manner based on pre-determined assignment at baseline. The primary endpoint was the proportion of patients who achieved an ACR20 response at Week 14. Key secondary endpoints included DAS28-CRP ≤3.2, DAS28-CRP <2.6, and change from baseline in HAQ-DI at Week 14.
Study RA-III (NCT02675426) was a 12-week trial in 661 patients with moderately to severely active rheumatoid arthritis who had an inadequate response to conventional disease modifying anti-rheumatic drugs (cDMARDs). Patients received RINVOQ 15 mg or upadacitinib 30 mg once daily or placebo added to background cDMARD therapy. At Week 12, patients who were randomized to placebo were advanced to RINVOQ 15 mg or upadacitinib 30 mg once daily in a blinded manner based on pre-determined assignment at baseline. The primary endpoint was the proportion of patients who achieved an ACR20 response at Week 12. Key secondary endpoints included DAS28-CRP ≤3.2, DAS28-CRP<2.6, and change from baseline in HAQ-DI at Week 12.
Study RA-IV (NCT02629159) was a 48-week trial in 1629 patients with moderately to severely active rheumatoid arthritis who had an inadequate response to MTX. Patients received RINVOQ 15 mg once daily, active comparator, or placebo added to background MTX. From Week 14, non-responding patients on RINVOQ 15 mg could be rescued to active comparator in a blinded manner, and non-responding patients on active comparator or placebo could be rescued to RINVOQ 15 mg in a blinded manner. At Week 26, all patients randomized to placebo were switched to RINVOQ 15 mg once daily in a blinded manner. The primary endpoint was the proportion of patients who achieved an ACR20 response at Week 12 versus placebo. Key secondary endpoints versus placebo included DAS28-CRP ≤3.2, DAS28-CRP <2.6, change from baseline in HAQ-DI at Week 12, and change from baseline in mTSS at Week 26.
Study RA-V (NCT02706847) was a 12-week trial in 499 patients with moderately to severely active rheumatoid arthritis who had an inadequate response or intolerance to biologic DMARDs. Patients received RINVOQ 15 mg or upadacitinib 30 mg once daily or placebo added to background cDMARD therapy. At Week 12, patients who were randomized to placebo were advanced to RINVOQ 15 mg or upadacitinib 30 mg once daily in a blinded manner based on pre-determined assignment at baseline. The primary endpoint was the proportion of patients who achieved an ACR20 response at Week 12. Key secondary endpoints included DAS28-CRP ≤3.2 and change from baseline in HAQ-DI at Week 12.
Clinical Response
The percentages of RINVOQ-treated patients achieving ACR20, ACR50, and ACR70 responses, and DAS28(CRP) <2.6 in all studies are shown in Table 5.
Patients treated with RINVOQ 15 mg, alone or in combination with cDMARDs, achieved higher ACR response rates compared to MTX monotherapy or placebo, respectively, at the primary efficacy timepoint (Table 5).
In Study IV, the percent of patients achieving ACR20 response by visit is shown in Figure 1.
In Studies RA-III and RA-V, higher ACR20 response rates were observed at 1 week with RINVOQ 15 mg versus placebo.
Treatment with RINVOQ 15 mg, alone or in combination with cDMARDs, resulted in greater improvements in the ACR components compared to MTX or placebo at the primary efficacy timepoint (Table 6).
Table 5. Clinical Response:
| Study RA-I MTX-Naïve | Study RA-II MTX-IR | Study RA-III cDMARD-IR | Study RA-IV MTX-IR | Study RA-V bDMARD-IR | |||||||
|---|---|---|---|---|---|---|---|---|---|---|---|
| Monotherapy | Monotherapy | Background cDMARDs | Background MTX | Background cDMARDs | |||||||
| MTX | RINVOQ 15 mg % Δ (95% CI) | MTX | RINVOQ 15 mg % Δ (95% CI) | PBO | RINVOQ 15 mg % Δ (95% CI) | PBO | RINVOQ 15 mg % Δ (95% CI) | PBO | RINVOQ 15 mg % Δ (95% CI) | ||
| N | 314 | 317 | 216 | 217 | 221 | 221 | 651 | 651 | 169 | 164 | |
| Week | |||||||||||
| ACR20 | |||||||||||
| 12a/14b | 54 | 76 22 (14, 29) | 41 | 68 26 (17, 36) | 36 | 64 28 (19, 37) | 36 | 71 34 (29, 39) | 28 | 65 36 (26, 46) | |
| 24c/26d | 59 | 79 20 (13, 27) | 36 | 67 32 (27, 37) | |||||||
| ACR50 | |||||||||||
| 12a/14b | 28 | 52 24 (16, 31) | 15 | 42 27 (18, 35) | 15 | 38 23 (15, 31) | 15 | 45 30 (26, 35) | 12 | 34 22 (14, 31) | |
| 24c/26d | 33 | 60 27 (19, 34) | 21 | 54 33 (28, 38) | |||||||
| ACR70 | |||||||||||
| 12a/14b | 14 | 32 18 (12, 25) | 3 | 23 20 (14, 26) | 6 | 21 15 (9, 21) | 5 | 25 20 (16, 24) | 7 | 12 5 (-1, 11) | |
| 24c/26d | 18 | 44 26 (19, 33) | 10 | 35 25 (21, 29) | |||||||
| DAS28-CRP <2.6 | |||||||||||
| 12a/14b | 14 | 36 22 (15, 28) | 8 | 28 20 (13, 27) | 10 | 31 21 (14, 28) | 6 | 29 23 (19, 27) | 9 | 29 19 (11, 27) | |
| 24c/26d | 18 | 48 30 (23, 37) | 9 | 41 32 (27, 36) | |||||||
Abbreviations: ACR20 (or 50 or 70) = American College of Rheumatology ≥20% (or ≥50% or ≥70%) improvement; bDMARD = biologic disease-modifying anti-rheumatic drug; CRP = c-reactive protein; DAS28 = Disease Activity Score 28 joints; cDMARDs = conventional disease-modifying anti-rheumatic drugs; MTX = methotrexate; PBO = placebo; IR = inadequate responder
Patients who discontinued randomized treatment, or had cross-over between randomized treatments, or were missing data at week of evaluation were imputed as non-responders in the analyses.
a Study RA-I, Study RA-III, Study RA-IV, Study RA-V
b Study RA-II
c Study RA-I
d Study RA-IV
Table 6. Components of ACR Response at Primary Efficacy Timepointa:
| Study RA-I MTX-Naïve | Study RA-IIb MTX-IR | Study RA-III cDMARD-IR | Study RA-IV MTX-IR | Study RA-V bDMARD-IR | ||||||
|---|---|---|---|---|---|---|---|---|---|---|
| Monotherapy | Monotherapy | Background cDMARDs | Background MTX | Background cDMARDs | ||||||
| MTX | RINVOQ 15 mg | MTX | RINVOQ 15 mg | PBO | RINVOQ 15 mg | PBO | RINVOQ 15 mg | PBO | RINVOQ 15 mg | |
| N | 314 | 317 | 216 | 217 | 221 | 221 | 651 | 651 | 169 | 164 |
| Number of tender joints (0-68) | ||||||||||
| Baseline | 26 (16) | 25 (14) | 25 (16) | 24 (15) | 25 (15) | 25 (14) | 26 (14) | 26 (15) | 28 (15) | 28 (16) |
| Week 12/14 | 13 (15) | 9 (12) | 15 (16) | 10 (13) | 16 (17) | 12 (14) | 16 (15) | 10 (13) | 18 (17) | 11 (14) |
| Number of swollen joints (0-66) | ||||||||||
| Baseline | 17 (11) | 17 (10) | 17 (12) | 16 (11) | 15 (9) | 16 (10) | 16 (9) | 17 (10) | 16 (10) | 17 (11) |
| Week 12/14 | 6 (8) | 5 (7) | 9 (11) | 6 (9) | 9 (10) | 7 (10) | 9 (9) | 5 (7) | 9 (10) | 6 (8) |
| Painc | ||||||||||
| Baseline | 66 (21) | 68 (21) | 63 (21) | 62 (23) | 62 (21) | 64 (19) | 65 (21) | 66 (21) | 69 (21) | 68 (20) |
| Week 12/14 | 41 (25) | 31 (25) | 49 (25) | 36 (27) | 51 (26) | 33 (24) | 49 (25) | 33 (24) | 55 (28) | 41 (28) |
| Patient global assessmentc | ||||||||||
| Baseline | 66 (21) | 67 (22) | 60 (22) | 62 (22) | 60 (20) | 63 (22) | 64 (21) | 64 (22) | 66 (23) | 67 (20) |
| Week 12/14 | 42 (25) | 31 (24) | 48 (26) | 37 (27) | 50 (26) | 32 (24) | 48 (24) | 33 (24) | 54 (28) | 40 (26) |
| Disability Index (HAQ-DI)d | ||||||||||
| Baseline | 1.60 (0.67) | 1.60 (0.67) | 1.47 (0.66) | 1.47 (0.66) | 1.42 (0.63) | 1.48 (0.61) | 1.61 (0.61) | 1.63 (0.64) | 1.56 (0.60) | 1.67 (0.64) |
| Week 12/14 | 1.08 (0.72) | 0.76 (0.69) | 1.19 (0.69) | 0.86 (0.67) | 1.13 (0.70) | 0.85 (0.66) | 1.28 (0.67) | 0.98 (0.68) | 1.33 (0.66) | 1.24 (0.77) |
| Physician global assessmentc | ||||||||||
| Baseline | 69 (16) | 67 (17) | 62 (17) | 66 (18) | 64 (18) | 64 (16) | 66 (18) | 66 (17) | 67 (17) | 69 (17) |
| Week 12/14 | 32 (22) | 22 (19) | 37 (24) | 26 (21) | 41 (24) | 26 (21) | 41 (25) | 27 (21) | 39 (25) | 29 (22) |
| CRP (mg/L) | ||||||||||
| Baseline | 21.2 (22.1) | 23.0 (27.4) | 14.5 (17.3) | 14.0 (16.5) | 12.6 (14.0) | 16.6 (19.2) | 18.0 (21.5) | 17.9 (22.5) | 16.3 (21.1) | 16.3 (18.6) |
| Week 12/14 | 10.9 (14.9) | 4.2 (8.8) | 12.8 (21.4) | 3.7 (7.8) | 13.1 (15.5) | 4.6 (9.6) | 16.2 (19.8) | 5.5 (10.9) | 13.9 (17.3) | 5.0 (14.0) |
Abbreviations: ACR = American College of Rheumatology; bDMARD = biologic disease-modifying anti-rheumatic drug; CRP = c-reactive protein; cDMARDs = conventional disease-modifying anti-rheumatic drugs; HAQ-DI = Health Assessment Questionnaire Disability Index; IR = inadequate responder; MTX = methotrexate; PBO = placebo
a Data shown are mean (standard deviation).
b Primary efficacy timepoint is at Week 14.
c Visual analog scale: 0 = best, 100 = worst.
d Health Assessment Questionnaire-Disability Index: 0=best, 3=worst; 20 questions; 8 categories: dressing and grooming, arising, eating, walking, hygiene, reach, grip, and activities.
Figure 1. Percent of Patients Achieving ACR20 in Study RA-IV:
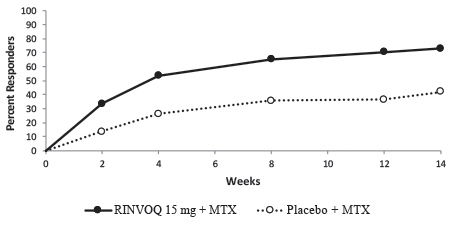
Abbreviations: ACR20 = American College of Rheumatology ≥20% improvement; MTX = methotrexate
Patients who discontinued randomized treatment, or were missing ACR20 results, or were lost-to-follow-up or withdrawn from the study were imputed as non-responders.
In RA-I and RA-IV, a higher proportion of patients treated with RINVOQ 15 mg alone or in combination with MTX, achieved DAS28-CRP <2.6 compared to MTX or placebo at the primary efficacy timepoint (Table 7).
Table 7. Proportion of Patients with DAS28-CRP Less Than 2.6 with Number of Residual Active Joints at Primary Efficacy Timepoint:
| Study RA-I MTX-Naive | ||
|---|---|---|
| Monotherapy | ||
| DAS28-CRP Less Than 2.6 | MTX N=314 | RINVOQ 15 mg N=317 |
| Proportion of responders at Week 12 (n) | 14% (43) | 36% (113) |
| Of responders, proportion with 0 active joints (n) | 51% (22) | 45% (51) |
| Of responders, proportion with 1 active joint (n) | 35% (15) | 23% (26) |
| Of responders, proportion with 2 active joints (n) | 9% (4) | 17% (19) |
| Of responders, proportion with 3 or more active joints (n) | 5% (2) | 15% (17) |
| Study RA-IV MTX-IR | ||
| Background MTX | ||
| DAS28-CRP Less Than 2.6 | PBO N=651 | RINVOQ 15 mg N=651 |
| Proportion of responders at Week 12 (n) | 6% (40) | 29% (187) |
| Of responders, proportion with 0 active joints (n) | 60% (24) | 48% (89) |
| Of responders, proportion with 1 active joint (n) | 20% (8) | 23% (43) |
| Of responders, proportion with 2 active joints (n) | 15% (6) | 13% (25) |
| Of responders, proportion with 3 or more active joints (n) | 5% (2) | 16% (30) |
Abbreviations: CRP = c-reactive protein; DAS28 = Disease Activity Score 28 joints; MTX = methotrexate; PBO = placebo; IR = inadequate responder
Radiographic response
Inhibition of progression of structural joint damage was assessed using the modified Total Sharp Score (mTSS) and its components, the erosion score and joint space narrowing score, at Week 26 in Study RA-IV and Week 24 in Study RA-I. The proportion of patients with no radiographic progression (mTSS change from baseline ≤0) was also assessed.
In Study RA-IV, treatment with RINVOQ 15 mg inhibited the progression of structural joint damage compared to placebo in combination with cDMARDs at Week 26 (Table 8). Analyses of erosion and joint space narrowing scores were consistent with overall results.
In the placebo plus MTX group, 76% of the patients experienced no radiographic progression at Week 26 compared to 83% of the patients treated with RINVOQ 15 mg.
In Study RA-I, treatment with RINVOQ 15 mg monotherapy inhibited the progression of structural joint damage compared to MTX monotherapy at Week 24 (Table 8). Analyses of erosion and joint space narrowing scores were consistent with overall results.
In the MTX monotherapy group, 78% of the patients experienced no radiographic progression at Week 24 compared to 87% of the patients treated with RINVOQ 15 mg monotherapy.
Table 8. Radiographic Changes:
| Study RA-IV MTX-IR | |||
|---|---|---|---|
| Background MTX | |||
| mTSS | PBO (N=651) Mean (SD) | RINVOQ 15 mg (N=651) Mean (SD) | Estimated Difference vs PBO at Week 26 (95% CI)1 |
| Baseline | 35.9 (52) | 34.0 (50) | |
| Week 262 | 0.78 (0.1) | 0.15 (0.1) | -0.63 (-0.92, -0.34) |
| Study RA-I MTX-naïve | |||
| Monotherapy | |||
| MTX (N=309) Mean (SD) | RINVOQ 15 mg (N=309) Mean (SD) | Estimated Difference vs MTX at Week 24 (95% CI)3 | |
| Baseline | 13.3 (31) | 18.1 (38) | |
| Week 244 | 0.67 (2.8) | 0.14 (1.4) | -0.53 (-0.85, -0.20) |
Abbreviations: mTSS = modified Total Sharp Score, MTX = methotrexate; PBO = placebo; SD = standard deviation; IR = inadequate responders; bDMARDs = biologic disease modifying anti-rheumatic drugs; LS = least squares; CI = confidence intervals
1 LS means and 95% CI based on a random coefficient model fit to the mTSS value adjusting for time, treatment group, prior bDMARDs use, treatment group-by-time interaction, with random slopes and random intercept.
2 Estimated linear rate of structural progression by Week 26 and standard errors are presented.
3 LS means and 95% CI based on a linear regression model fit to change from baseline in mTSS adjusting for treatment group, baseline mTSS, and geographic region.
4 Mean change from baseline and standard deviation are presented.
Physical Function Response
Treatment with RINVOQ 15 mg, alone or in combination with cDMARDs, resulted in a greater improvement in physical function at Week 12/14 compared to all comparators as measured by HAQ-DI.
Other Health-Related Outcomes
In all studies except for Study RA-V, patients receiving RINVOQ 15 mg had greater improvement from baseline in physical component summary (PCS) score, mental component summary (MCS) scores, and in all 8 domains of the Short Form Health Survey (SF-36) compared to placebo in combination with cDMARDs or MTX monotherapy at Week 12/14.
Fatigue was assessed by the Functional Assessment of Chronic Illness Therapy-Fatigue score (FACIT-F) in Studies RA-I, RA-III, and RA-IV. Improvement in fatigue at Week 12 was observed in patients treated with RINVOQ 15 mg compared to patients on placebo in combination with cDMARDs or MTX monotherapy.
© All content on this website, including data entry, data processing, decision support tools, "RxReasoner" logo and graphics, is the intellectual property of RxReasoner and is protected by copyright laws. Unauthorized reproduction or distribution of any part of this content without explicit written permission from RxReasoner is strictly prohibited. Any third-party content used on this site is acknowledged and utilized under fair use principles.