XOSPATA Tablet Ref.[10305] Active ingredients: Gilteritinib
Source: FDA, National Drug Code (US) Revision Year: 2019
12.1. Mechanism of Action
Gilteritinib is a small molecule that inhibits multiple receptor tyrosine kinases, including FMS-like tyrosine kinase 3 (FLT3). Gilteritinib demonstrated the ability to inhibit FLT3 receptor signaling and proliferation in cells exogenously expressing FLT3 including FLT3-ITD, tyrosine kinase domain mutations (TKD) FLT3-D835Y and FLT3-ITD-D835Y, and it induced apoptosis in leukemic cells expressing FLT3-ITD.
12.2. Pharmacodynamics
In patients with relapsed or refractory AML administered gilteritinib 120 mg, substantial (>90%) inhibition of FLT3 phosphorylation was rapid (within 24 hours after first dose) and sustained, as characterized by an ex vivo plasma inhibitory activity (PIA) assay.
Cardiac Electrophysiology
The effect of XOSPATA 120 mg once a day on the QTc interval has been evaluated in patients, which showed an absence of large mean increases (i.e., 20 msec) in the QTc interval.
Of 317 patients with a post-baseline QTc measurement on treatment with gilteritinib at 120 mg in clinical trials, 4 patients (1.3%) experienced a QTcF >500 msec. Additionally, across all doses 2.3% of patients with relapse/refractory AML had a maximum post-baseline QTcF interval >500 msec [see Warnings and Precautions (5.3)].
12.3. Pharmacokinetics
The following pharmacokinetic parameters were observed following administration of gilteritinib 120 mg once daily, unless otherwise specified.
Gilteritinib exposure (Cmax and AUC24) increases proportionally with once daily doses ranging from 20 mg to 450 mg (0.17 to 3.75 times the recommended dosage) in patients with relapsed or refractory AML. Gilteritinib mean (±SD) steady-state Cmax is 374 ng/mL (±190) and AUC24 is 6943 ng•hr/mL (±3221). Steady-state plasma levels are reached within 15 days of dosing with an approximate 10-fold accumulation.
Absorption
The time to maximum gilteritinib concentration (tmax) observed is approximately between 4 and 6 hours postdose in the fasted state.
Effect of Food
In healthy adults administered a single gilteritinib 40 mg dose (0.3 times the recommended dosage), gilteritinib Cmax decreased by 26% and AUC decreased by less than 10% when co-administered with a high-fat meal (approximately 800 to 1,000 total calories with 500 to 600 fat calories, 250 carbohydrate calories, 150 protein calories) compared to a fasted state. Median tmax was delayed 2 hours when gilteritinib was administered with a high-fat meal.
Distribution
The population mean (%CV) estimates of apparent central and peripheral volume of distribution were 1092 L (9.22%) and 1100 L (4.99%), respectively, which may indicate extensive tissue distribution. In vivo, gilteritinib is approximately 94% bound to human plasma proteins. In vitro, gilteritinib is primarily bound to human serum albumin.
Elimination
The estimated half-life of gilteritinib is 113 hours, and the estimated apparent clearance is 14.85 L/h.
Metabolism
Gilteritinib is primarily metabolized via CYP3A4 in vitro. At steady state, the primary metabolites in humans include M17 (formed via N-dealkylation and oxidation), M16 and M10 (both formed via N‑dealkylation). None of these 3 metabolites exceeded 10% of overall parent exposure.
Excretion
After a single radiolabeled dose, gilteritinib is excreted in feces with 64.5% of the total administered dose recovered in feces. Of the total radiolabeled dose of gilteritinib, 16.4% was recovered in urine as unchanged drug and metabolites.
Specific Populations
Age (20-87 years), sex, race, mild (Child-Pugh Class A) or moderate (Child-Pugh Class B) hepatic impairment and mild (creatinine clearance (CLCr) 50-80 mL/min) or moderate (CLCr 30-50 mL/min) renal impairment do not have clinically meaningful effects on the pharmacokinetics of gilteritinib.
The effect of severe hepatic (Child-Pugh Class C) or severe renal impairment (CLCr ≤29 mL/min) on gilteritinib pharmacokinetics is unknown.
Drug Interaction Studies
Clinical Studies
Combined P-gp and Strong CYP3A Inducers:
Gilteritinib Cmax decreased approximately 30% and AUC decreased approximately 70% when co-administered with rifampin (a combined P-gp and strong CYP3A inducer).
Strong CYP3A Inhibitors:
Gilteritinib Cmax increased approximately 20% and AUC increased approximately 120% when co-administered with itraconazole (a strong CYP3A inhibitor).
Moderate CYP3A Inhibitors:
Gilteritinib Cmax increased approximately 16% and AUC increased approximately 40% when co-administered with fluconazole (a moderate CYP3A inhibitor).
CYP3A Substrates:
Midazolam (a CYP3A substrate) Cmax and AUC increased approximately 10% when co-administered with gilteritinib.
MATE1 Substrates:
Cephalexin (a MATE1 substrate) Cmax and AUC decreased by less than 10% when co-administered with gilteritinib.
In Vitro Studies
Gilteritinib inhibits human 5HT2B receptor or sigma nonspecific receptors, which may reduce the effects of drugs that target these receptors such as escitalopram, fluoxetine and sertraline.
Gilteritinib is a substrate of P-gp transporter and has the potential to inhibit breast cancer resistance protein (BCRP) and organic cation transporter 1 (OCT1) transporters.
13.1. Carcinogenesis, Mutagenesis, Impairment of Fertility
Carcinogenicity studies have not been performed with gilteritinib.
Gilteritinib was not mutagenic in a bacterial mutagenesis (Ames) assay and was not clastogenic in a chromosome aberration test assay in Chinese hamster lung cells. Gilteritinib was positive for the induction of micronuclei in mouse bone marrow cells from 65 mg/kg (195 mg/m2) the mid dose tested (approximately 2.6 times the recommended human dose of 120 mg).
The effect of XOSPATA on human fertility is unknown. Administration of 10 mg/kg/day gilteritinib in the 4-week study in dogs (12 days of dosing) resulted in degeneration and necrosis of germ cells and spermatid giant cell formation in the testis as well as single cell necrosis of the epididymal duct epithelia of the epididymal head.
13.2. Animal Toxicology and/or Pharmacology
In the 13-week oral repeated dose toxicity studies in rats and dogs, target organs of toxicity included the eye and kidney.
14. Clinical Studies
14.1 Relapsed or Refractory Acute Myeloid Leukemia
The efficacy of XOSPATA was assessed in the ADMIRAL Trial (NCT02421939), which included adult patients with relapsed or refractory AML having a FLT3 ITD, D835, or I836 mutation by the LeukoStrat CDx FLT3 Mutation Assay. XOSPATA was given orally at a starting dose of 120 mg daily until unacceptable toxicity or lack of clinical benefit.
First Interim Analysis
The efficacy of XOSPATA was established on the basis of the rate of complete remission (CR)/CR with partial hematological recovery (CRh), the duration of CR/CRh (DOR), and the rate of conversion from transfusion dependence to transfusion independence at the first interim analysis in the ADMIRAL trial (n=138). The median follow-up was 4.6 months (95% CI: 2.8, 15.8). Fourteen patients were still in remission at the time of the first interim DOR analysis. The efficacy results are shown in Table 5. For patients who achieved a CR/CRh, the median time to first response was 3.6 months (range, 0.9 to 9.6 months). The CR/CRh rate was 29 of 126 in patients with FLT3-ITD or FLT3-ITD/TKD and 0 of 12 in patients with FLT3-TKD only.
Among the 106 patients who were dependent on red blood cell (RBC) and/or platelet transfusions at baseline, 33 (31.1%) became independent of RBC and platelet transfusions during any 56-day post-baseline period. For the 32 patients who were independent of both RBC and platelet transfusions at baseline, 17 (53.1%) remained transfusion-independent during any 56-day post-baseline period.
Table 5. Efficacy Results in Patients with Relapsed or Refractory AML Treated with XOSPATA in the First Interim Analysis (ADMIRAL Trial):
| Remission Rate | XOSPATAN=138 |
|---|---|
| CR*/CRh† n/N (%) | 29/138 (21) |
| 95% CI‡ | 14.5, 28.8 |
| Median DOR§ (months) | 4.6 |
| Range (months) | 0.1 to 15.8¶ |
| CR* n/N (%) | 16/138 (11.6) |
| 95% CI‡ | 6.8, 18.1 |
| Median DOR§ (months) | 8.6 |
| Range (months) | 1 to 13.8 |
| CRh† n/N (%) | 13/138 (9.4) |
| 95% CI‡ | 5.1, 15.6 |
| Median DOR§ (months) | 2.9 |
| Range (months) | 0.1 to 15.8¶ |
* CI: confidence interval; NE: not estimable; NR: not reached; Only responses prior to HSCT were included in response rate.
† CRh was defined as marrow blasts <5%, partial hematologic recovery absolute neutrophil count ≥0.5 x 10 /L and platelets ≥50 x 10 /L, no evidence of extramedullary leukemia and could not have been classified as CR.
‡ The 95% CI rate was calculated using the exact method based on binomial distribution.
§ DOR was defined as the time from the date of either first CR or CRh until the date of a documented relapse of any type. Deaths were counted as events.
¶ Response was ongoing
Final Analysis
The final analysis of the ADMIRAL trial included 371 adult patients randomized 2:1 to receive XOSPATA 120 mg once daily (n=247) over continuous 28-day cycles or a prespecified chemotherapy regimen (n=124). Randomization was stratified by response to first-line AML therapy and prespecified chemotherapy. The prespecified chemotherapy regimens included high intensity combinations (MEC and FLAG-IDA) and low intensity regimens (LDAC and AZA).
The demographic and disease characteristics of the randomized patients are shown in Table 6.
Table 6. Baseline Demographic and Disease Characteristics in Patients with Relapsed or Refractory AML in the Final Analysis (ADMIRAL Trial):
| Demographic and Disease Characteristics | Xospata(120 mg daily)N=247 | ChemotherapyN=124 |
|---|---|---|
| Demographics | ||
| Median Age (Years) (Range) | 62 (20, 84) | 62 (19, 85) |
| Age Categories, n (%) | ||
| <65 years | 141 (57) | 75 (60) |
| ≥65 years | 106 (43) | 49 (40) |
| Sex, n (%) | ||
| Male | 116 (47) | 54 (44) |
| Female | 131 (53) | 70 (57) |
| Race, n (%) | ||
| White | 145 (59) | 75 (60) |
| Asian | 69 (28) | 33 (27) |
| Black or African American | 14 (6) | 7 (6) |
| Native Hawaiian or Other Pacific Islander | 1 (0.4) | 0 |
| Other | 5 (2) | 1 (0.8) |
| Unknown/Missing | 13 (5) | 8 (6) |
| Baseline ECOG, n (%) | ||
| 0-1 | 206 (83) | 105 (85) |
| ≥2 | 41 (17) | 19 (15) |
| Disease Characteristics | ||
| Untreated relapse AML, n (%) | 151 (61) | 74 (60) |
| Primary refractory AML, n (%) | 96 (39) | 49 (40) |
| Refractory relapse AML, n (%) | 0 | 1 (0.8) |
| Number of Relapses, n (%) | ||
| 0 | 96 (39) | 49 (40) |
| 1 | 149 (60) | 74 (60) |
| 2 or more | 2 (0.8) | 1 (0.8) |
| Median number of relapses (Range) | 1 (0, 2) | 1 (0, 2) |
| Transfusion Dependent at Baseline, n (%)* | 197 (80) | 97 (89) |
| FLT3 Mutation Status, n (%) | ||
| ITD alone | 215 (87) | 113 (91) |
| TKD alone | 21 (9) | 10 (8) |
| ITD and TKD | 7 (3) | 0 |
| Prior Use of FLT3 Inhibitor†, n (%) | ||
| No | 215 (87) | 110 (89) |
| Yes | 32 (13) | 14 (11) |
| Prespecified Chemotherapy | ||
| High Intensity | 149 (60) | 75 (60) |
| MEC‡ | - | 33 (27) |
| FLAG-IDA§ | - | 42 (34) |
| Low Intensity | 98 (40) | 49 (40) |
| LDAC¶ | - | 17 (14) |
| AZA# | - | 32 (26) |
AML: acute myeloid leukemia; FLT3: FMS-related tyrosine kinase 3; ITD: internal tandem duplication; TKD: D835/I836 tyrosine kinase domain point mutation; ECOG PS: Eastern Cooperative Oncology Group performance status; CRc: Composite complete remission (complete remission [CR] + complete remission with incomplete hematologic recovery [CRi] + complete remission with incomplete platelet recovery [CRp]); HSCT: Hematopoietic stem cell transplantation.
* Patients were defined as transfusion dependent at baseline if they were dosed and received any red blood cell or platelet transfusions within the 56-day baseline period.
† Prior use of FLT3 inhibitor is defined as "Yes" if patients received prior AML therapy of midostaurin, sorafenib or quizartinib; otherwise, prior use of FLT3 inhibitor was assigned as "No."
‡ MEC: mitoxantrone 8 mg/m , etoposide 100 mg/m and cytarabine 1000 mg/m once daily by IV for 5 days
§ FLAG-IDA: granulocyte colony-stimulating factor 300 mcg/m once daily by SC days 1 to 5, fludarabine 30 mg/m once daily by IV days 2 through 6, cytarabine 2000 mg/m once daily by IV for days 2 through 6, idarubicin 10 mg/m once daily by IV days 2 through 4
¶ LDAC: cytarabine 20 mg twice daily by subcutaneous (SC) or intravenous (IV) for 10 days
# AZA: azacitidine 75 mg/m once daily by SC or IV for 7 days
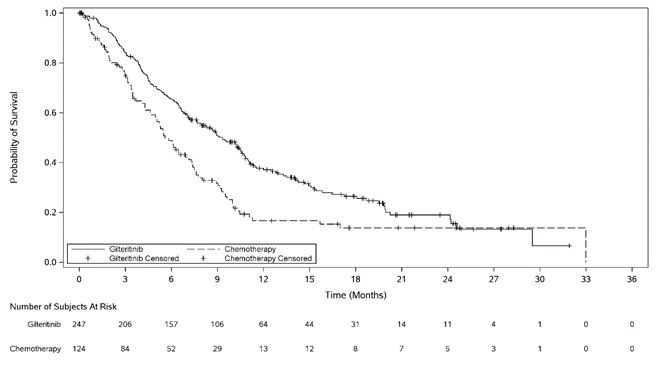
The final analysis included an assessment of OS, measured from the date of randomization until death by any cause. At the time of analysis, median follow-up was 17.8 months (range, 14.9 to 19.1). Patients randomized to the XOSPATA arm had significantly longer survival compared to the chemotherapy arm (HR 0.64; 95% CI: 0.49 – 0.83; 1-sided p-value: 0.0004). Figure 1 and Table 7 show the results of the OS analysis.
Exploratory subgroup analyses demonstrated that the hazard ratio for survival was 0.66 (95% CI: 0.47 – 0.93) for patients in the high intensity chemotherapy stratum and 0.56 (95% CI: 0.38 – 0.84) for patients in the low intensity chemotherapy stratum. The CR rates are shown in Table 7. For patients on XOSPATA and chemotherapy arms, the CR rates were 15.4% (95% CI: 10% – 22.3%) and 16% (95% CI: 8.6% – 26.3%), respectively, for patients in the high intensity chemotherapy stratum, and 12.2% (95% CI: 6.5% – 20.4%) and 2% (95% CI 0.1% – 10.9%), respectively, for patients in the low intensity chemotherapy stratum.
Table 7. OS and CR* in Patients with Relapsed or Refractory AML in the Final Analysis (ADMIRAL Trial):
| XOSPATA N=247 | Chemotherapy N=124 | |
|---|---|---|
| Overall Survival | ||
| Deaths, n (%) | 171 (69.2%) | 90 (72.6%) |
| Median in months (95% CI) | 9.3 (7.7, 10.7) | 5.6 (4.7, 7.3) |
| Hazard Ratio (95% CI) | 0.64 (0.49, 0.83) | |
| p-value (1-sided) | 0.0004 | |
| Complete Remission | ||
| CR, n (%) | 35 (14.2%) | 13 (10.5%) |
| (95% CI ) | (10.1, 19.2) | (5.7, 17.3) |
| Median DOR (range) (months) | 14.8 (0.6 to 23.1+) | 1.8 (<0.1+ to 1.8) |
CI: confidence interval; Only responses prior to HSCT were included in response rate.
* CR was defined as an absolute neutrophil count ≥1.0 x 10 /L, platelets ≥100 x 10/L, normal marrow differential with <5% blasts, must have been red blood cells, platelet transfusion independent and no evidence of extramedullary leukemia.
† The 95% CI rate was calculated using the exact method based on binomial distribution.
‡ DOR was defined as the time from the date of first remission until the date of a documented relapse.
Figure 1. Kaplan-Meier Plot of Overall Survival in ADMIRAL Trial:
In the final analysis, the CR/CRh rate in the gilteritinib arm was 22.6% (55/243) and the DOR was 7.4 months (range, <0.1+ to 23.1+). For patients who achieved a CR/CRh, the median time to first response was 2 months (range, 0.9 to 9.6 months). The CR/CRh rate was 49 of 215 in patients with FLT3-ITD only, 3 of 7 in patients with FLT3-ITD/TKD and 3 of 21 in patients with FLT3-TKD only.
Among the 197 patients who were dependent on red blood cell (RBC) and/or platelet transfusions at baseline, 68 (34.5%) became independent of RBC and platelet transfusions during any 56-day post-baseline period. For the 49 patients who were independent of both RBC and platelet transfusions at baseline, 29 (59.2%) remained transfusion-independent during any 56-day post-baseline period.
© All content on this website, including data entry, data processing, decision support tools, "RxReasoner" logo and graphics, is the intellectual property of RxReasoner and is protected by copyright laws. Unauthorized reproduction or distribution of any part of this content without explicit written permission from RxReasoner is strictly prohibited. Any third-party content used on this site is acknowledged and utilized under fair use principles.