LUCEMYRA Film-coated tablet Ref.[10120] Active ingredients: Lofexidine
Source: FDA, National Drug Code (US) Revision Year: 2019
12.1. Mechanism of Action
Lofexidine is a central alpha-2 adrenergic agonist that binds to receptors on adrenergic neurons. This reduces the release of norepinephrine and decreases sympathetic tone.
12.2. Pharmacodynamics
Cardiac Electrophysiology
Single LUCEMYRA doses of 1.44 to 1.8 mg produced maximum mean change from baseline in QTcF (ΔQTcF) of 14.4 msec (upper two-sided 90% CI: 22.3 msec) and 13.6 msec (17.4 msec) for 1.44 and 1.8 mg respectively in healthy normal volunteers.
In a Phase 3 placebo-controlled, dose response study in opioid dependent subjects, LUCEMYRA was associated with a maximum mean prolongation of the QTcF interval 7.3 (8.8) and 9.3 (10.9) msec at doses of 2.16 and 2.88 mg/day, respectively.
Patients with hepatic impairment
Administration of LUCEMYRA to subjects with hepatic impairment was associated with prolongation of the QTc interval, which was more pronounced in subjects with severe hepatic impairment [see Use in Specific Populations (8.6)].
Patients with renal impairment
Administration of LUCEMYRA to subjects with renal impairment was associated with prolongation of the QTc interval, which was more pronounced in subjects with severe renal impairment [see Use in Specific Populations (8.7)].
LUCEMYRA coadministered with methadone
LUCEMYRA (2.88 mg/day) coadministered with methadone in 18 methadone-maintained patients (80-120 mg/day) resulted in a maximum mean increase from methadone-alone baseline in QTcF of 9.1 (14.2) msec.
LUCEMYRA coadministered with buprenorphine
LUCEMYRA (2.88 mg/day) coadministered with buprenorphine in 21 buprenorphine-maintained patients (16-24 mg/day) resulted in a maximum mean QTcF increase in QTcF of 15 (5.6) msec compared to a buprenorphine-alone baseline.
In Vitro Binding
LUCEMYRA exhibits in vitro binding affinity and functional agonist activity with alpha-2A and alpha-2C adrenoreceptors at concentrations within clinical exposure plasma levels (Ki values of approximately 7.2 nM and 12 nM, and EC50 values of 4.9 nM and 0.9 nM, respectively).
12.3. Pharmacokinetics
Absorption
LUCEMYRA is well absorbed and achieves peak plasma concentration 3 to 5 hours after administration of a single dose.
LUCEMYRA shows approximately dose-proportional pharmacokinetics. Administration of LUCEMYRA with food does not alter its pharmacokinetics.
The absolute bioavailability of a single oral LUCEMYRA dose (0.36 mg in solution) compared with an intravenous infusion (0.2 mg infused for 200 minutes) was 72%. Mean LUCEMYRA Cmax after the oral dose and intravenous infusion was 0.82 ng/mL (at median Tmax of 3 hours) and 0.64 ng/mL (at median Tmax of 4 hours), respectively. Mean estimates of overall systemic exposure (AUCinf) were 14.9 ng∙h/mL and 12.0 ng∙h/mL, respectively.
Distribution
Mean LUCEMYRA apparent volume of distribution and volume of distribution values following the administration of an oral dose and an intravenous dose were 480.0 L and 297.9 L, respectively, which are appreciably greater than total body volume, suggesting extensive LUCEMYRA distribution into body tissue.
LUCEMYRA protein binding is approximately 55%.
LUCEMYRA is not preferentially taken up by blood cells. In a study comparing LUCEMYRA concentrations in plasma and whole blood at the time of peak LUCEMYRA concentrations in human volunteers, it was determined that red blood cells contain approximately 27% the LUCEMYRA concentration of the plasma.
Elimination
Metabolism
From absolute bioavailability results, approximately 30% of the administered LUCEMYRA dose is converted to inactive metabolites during the first pass effect associated with drug absorption from the gut.
LUCEMYRA and its major metabolites did not induce or inhibit any CYP450 isoforms, with the exception of a slight inhibition of CYP2D6 by LUCEMYRA, with an IC50 of 4551 nM (approximately 225 times the steady-state Cmax for LUCEMYRA with 0.72 mg 4 times daily dosing). Any LUCEMYRA interaction with CYP2D6 substrates is not expected to be clinically significant.
LUCEMYRA is metabolized when incubated in vitro with human liver microsomes, the major contributor to the hepatic metabolism of LUCEMYRA is CYP2D6, with CYP1A2 and CYP2C19 also capable of metabolizing LUCEMYRA.
Excretion
The elimination half-life is approximately 12 hours and mean clearance is 17.6 L/h following an IV infusion.
LUCEMYRA has a terminal half-life of approximately 11 to 13 hours following the first dose. At steady-state, the terminal half-life is approximately 17 to 22 hours. Accumulation occurs up to 4 days with repeat dosing, following the recommended dosing regimen.
A mass balance study of LUCEMYRA showed nearly complete recovery of radiolabel in urine (93.5%) over 144 hours postdose, with an additional 0.92% recovered in the feces over 216 hours postdose. Thus, it appears that all, or nearly all, of the dose was absorbed, and that the primary route of elimination of the parent drug and its metabolites is via the kidney. Renal elimination of unchanged drug accounts for approximately 15% to 20% of the administered dose.
Specific Populations
Hepatic Impairment
Hepatic impairment slows the elimination of LUCEMYRA, but exhibits less effect on the peak plasma concentration following a single dose. In a study comparing the pharmacokinetics of LUCEMYRA (0.36 mg) in mild, moderate, and severe hepatically impaired subjects to subjects with normal hepatic function (6 subjects in each hepatic function group), mean Cmax values were similar for subjects with normal, mild, and moderate hepatic impairment as shown in Table 6.
Table 6. LUCEMYRA Pharmacokinetics in Subjects with Hepatic Impairment:
| Normal | Mild Impairment | Moderate Impairment | Severe Impairment | |
|---|---|---|---|---|
| Child-Pugh Class & Score | Normal Function | Class A 5-6 | Class B 7-9 | Class C 10-15 |
| Cmax % of normal | 100 | 114 | 117 | 166 |
| AUClast % of normal | 100 | 127 | 190 | 304 |
| AUC∞ % of normal | 100 | 117 | 185 | 260 |
| t1/2 % of normal | 100 | 139 | 281 | 401 |
Renal Impairment
Renal impairment slows the elimination of LUCEMYRA but exhibits less effect on the peak plasma concentration following a single dose. In a study comparing the pharmacokinetics of LUCEMYRA (0.36 mg) in 8 end-stage renal disease subjects on 3 times weekly hemodialysis to 8 subjects with normal renal function matched for sex, age, and body mass index, mean Cmax values were similar for end-stage renal disease and normal renal function subjects, indicating no change in maximum LUCEMYRA exposure with renal impairment as shown in Table 7.
The impact of dialysis on the overall pharmacokinetics of LUCEMYRA during a typical 4-hour dialysis was minimal; the drop in LUCEMYRA plasma concentrations produced during the dialysis session was transient, with a rebound to nearly predialysis concentrations after re-equilibration within a few hours following completion of the dialysis cycle [see Dosage and Administration (2.3), Use in Specific Populations (8.7)].
In a study comparing the pharmacokinetics of LUCEMYRA (0.36 mg) in 6 subjects each with normal renal function, mild renal impairment, and moderate renal impairment as well as 5 subjects with severe renal impairment but not requiring dialysis, there were similar increases in mean Cmax values in subjects with mild and moderate renal impairment in comparison to subjects with normal renal function with additional increase in mean Cmax values in subjects with severe renal impairment. Mean AUClast, AUC∞, and t1/2 increased with severity of renal impairment as shown in Table 7.
Table 7. LUCEMYRA Pharmacokinetics in Subjects with Renal Impairment:
| Normal | Mild Impairment | Moderate Impairment | Severe Impairment | ESRD or on dialysis | |
|---|---|---|---|---|---|
| eGFR (mL/min/1.73 m²) | ≥90 | 60-89 | 30-59 | 15-29 | <15 |
| Cmax % of normal | 100 | 124 | 117 | 154 | 104 |
| AUClast % of normal | 100 | 157 | 187 | 272 | 181 |
| AUC∞ % of normal | 100 | 144 | 173 | 243 | 171 |
| t1/2% of normal | 100 | 111 | 145 | 157 | 137 |
Drug Interaction Studies
LUCEMYRA coadministered with methadone
In a double-blind placebo-controlled study of 23 patients maintained on a methadone dose of 80-120 mg/day and concomitantly administered LUCEMYRA up to 2.88 mg/day, LUCEMYRA did not alter the pharmacokinetics of methadone. LUCEMYRA concentrations may be slightly increased when coadministered with methadone; however, the increase at concentrations expected with recommended dosing is not clinically meaningful [see Drug Interactions (7.1)].
LUCEMYRA coadministered with buprenorphine
In a double-blind placebo-controlled study of 30 subjects maintained on buprenorphine (16-24 mg/day) concomitantly administered LUCEMYRA up to 2.88 mg/day, no pharmacokinetic or pharmacodynamic interactions between LUCEMYRA and buprenorphine were seen.
LUCEMYRA coadministered with oral naltrexone
In an open-label, single-arm study of 24 healthy subjects, oral naltrexone (50 mg/day) did not significantly alter the single-dose pharmacokinetics of LUCEMYRA (0.36 mg). The alteration in steady-state pharmacokinetics of oral naltrexone was statistically significant in the presence of LUCEMYRA. The tmax was delayed for both naltrexone and 6ß-naltrexol (2-3 hours), and overall exposure was slightly reduced when naltrexone was administered with LUCEMYRA [see Drug Interactions (7.2)].
LUCEMYRA coadministered with paroxetine
In an open-label, single-sequence study of 24 healthy subjects, the strong CYP2D6 inhibitor paroxetine (40 mg/day) increased LUCEMYRA (0.36 mg) Cmax and AUC∞ by approximately 11% and 28%, respectively [see Drug Interactions (7.4)].
13.1. Carcinogensis, Mutagenesis, Impairment of Fertility
Carcinogenesis
No adequate long-term animal studies have been completed to evaluate the carcinogenic potential of lofexidine.
Mutagenesis
Lofexidine tested positive in the in vitro mouse lymphoma assay. Lofexidine tested negative in the in vitro bacterial reverse mutation assay (Ames assay) and in the in vivo rat micronucleus assay.
Impairment of Fertility
In a female fertility study in rabbits, fertility was not adversely impacted by administration of lofexidine hydrochloride up to 6.4 mg/kg/day (approximately 0.1 times the MRHD of 2.88 mg on an AUC basis) when administered orally to female rabbits starting 2 weeks prior to mating and through gestation and lactation. However, decreased breeding rate and higher post-implantation loss was observed at this dose, which correlated with higher resorptions and reduced litter size. Maternal toxicity, which included increased mortality rate, reduced body weight gain, and moderate sedation was observed at 6.4 mg/kg/day. The NOAEL for female fertility was 6.4 mg/kg/day and the NOAEL for female-mediated developmental parameters was 0.4 mg/kg/day (approximately 0.005 times the MRHD on an AUC basis).
In a fertility study in rats, fertility was unaffected by administration of lofexidine up to 0.88 mg/kg/day (approximately 0.2 times the MRHD on an AUC basis) via diet to male and female rats prior to mating and to the dams through gestation and lactation. No evidence of maternal toxicity was observed. However, no assessment of sperm or reproductive organs were performed in this study.
Reduced testes, epididymis, and seminiferous tubule weights, as well as delayed sexual maturation of males and females and decreases in the number of corpora lutea and implantations after mating, were noted in offspring of pregnant rats administered lofexidine hydrochloride orally from GD 6 through lactation at exposures less than the human exposure based on AUC comparisons.
14. Clinical Studies
Two randomized, double-blind, placebo-controlled trials supported the efficacy of LUCEMYRA.
Study 1, NCT01863186
Study 1 was a 2-part efficacy, safety, and dose-response study conducted in the United States in patients meeting DSM-IV criteria for opioid dependence who were physically dependent on short-acting opioids (e.g., heroin, hydrocodone, oxycodone). The first part of the study was an inpatient, randomized, double-blind, placebo-controlled design consisting of 7 days of inpatient treatment (Days 1–7) with LUCEMYRA 2.16 mg total daily dose (0.54 mg 4 times daily) (n=229), LUCEMYRA 2.88 mg total daily dose (0.72 mg 4 times daily) (n=222), or matching placebo (n=151). Patients also had access to a variety of support medications for withdrawal symptoms (guaifenesin, antacids, dioctyl sodium sulfosuccinate, psyllium hydrocolloid suspension, bismuth sulfate, acetaminophen, and zolpidem). The second part of the study (Days 8–14) was an open-label design where all patients who successfully completed Days 1–7 were eligible to receive open-label treatment with variable dose LUCEMYRA treatment (as determined by the investigator, but not to exceed 2.88 mg total daily dose) for up to an additional 7 days (Days 8–14) in either an inpatient or outpatient setting as determined by the investigator and the patient. No patient received LUCEMYRA for more than 14 days.
The two endpoints to support efficacy were the mean Short Opiate Withdrawal Scale of Gossop (SOWS-Gossop) total score on Days 1–7 of treatment and the proportion of patients that completed 7 days of treatment. The SOWS-Gossop, a patient-reported outcome (PRO) instrument, evaluates the following opioid withdrawal symptoms: feeling sick, stomach cramps, muscle spasms/twitching, feeling of coldness, heart pounding, muscular tension, aches and pains, yawning, runny eyes and insomnia/problems sleeping. For each opioid withdrawal symptom, patients are asked to rate their symptom severity using four response options (none, mild, moderate, and severe). The SOWS-Gossop total score ranges from 0 to 30 where a higher score indicates a greater withdrawal symptom severity. The SOWS-Gossop was administered at baseline and once daily 3.5 hours after the first morning dose on Days 1–7.
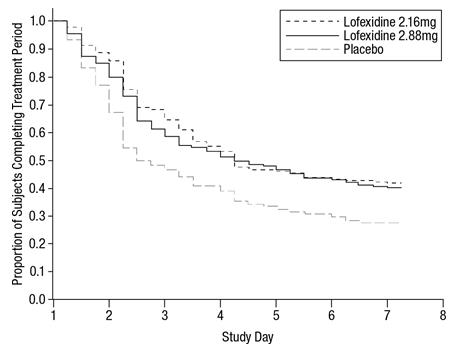
Of the randomized and treated patients, 28% of placebo patients, 41% of LUCEMYRA 2.16 mg and 40% of LUCEMYRA 2.88 mg patients completed 7 days of treatment. The difference in proportion in both LUCEMYRA groups was significant compared to placebo. See Figure 1. Patients in the placebo group were more likely to drop out of the study prematurely due to lack of efficacy than patients treated with LUCEMYRA.
Figure 1. Completion of treatment period for Study 1:
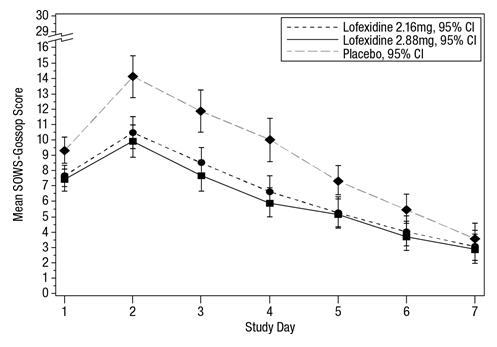
The mean SOWS-Gossop scores for Days 1–7 were 8.8, 6.5, and 6.1 for placebo, LUCEMYRA 2.16 mg and LUCEMYRA 2.88 mg, respectively. Results are shown in Figure 2. The mean difference between LUCEMYRA 2.16 mg and placebo was -2.3 with a 95% CI of (-3.4, -1.2). The mean difference between LUCEMYRA 2.88 mg and placebo was -2.7 with a 95% CI of (-3.9, -1.6). They were both significant. Symptoms assessed on the SOWS-Gossop were recorded as absent or mild for almost all patients remaining to the end of the assessment period.
Figure 2. Mean SOWS-Gossop Scores for Days 1–7 in Study 1:
Study 2, NCT00235729
Study 2 was an inpatient, randomized, multicenter, double-blind, placebo-controlled study carried out in the United States in patients meeting DSM-IV criteria for opioid dependence who were physically dependent on short-acting opioids (e.g., heroin, hydrocodone, oxycodone). Patients were treated with LUCEMYRA tablets (2.88 mg/day [0.72 mg four times daily]) or matching placebo for 5 days (Days 1–5). Patients also had access to a variety of support medications for withdrawal symptoms (guaifenesin, antacids, dioctyl sodium sulfosuccinate, psyllium hydrocolloid suspension, bismuth sulfate, acetaminophen, and zolpidem). All patients then received placebo on Days 6 and 7 and were discharged on Day 8.
The two endpoints to support efficacy were the mean SOWS-Gossop total score on Days 1–5 of treatment and the proportion of patients that completed 5 days of treatment. The SOWS-Gossop was administered at baseline and once daily 3.5 hours after the first morning dose on Days 1–5.
A total of 264 patients were randomized into the study. Of these, 134 patients were randomized to LUCEMYRA 2.88 mg/day and 130 patients to placebo.
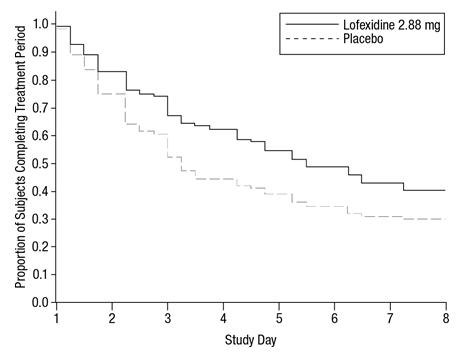
Of the randomized and treated patients, 33% of placebo patients and 49% of LUCEMYRA patients completed 5 days of treatment. The difference in proportion between the two groups was significant. See Figure 3. Patients in the placebo group were more likely to drop out of the study prematurely due to lack of efficacy than patients treated with LUCEMYRA.
Figure 3. Completion of treatment period in Study 2:
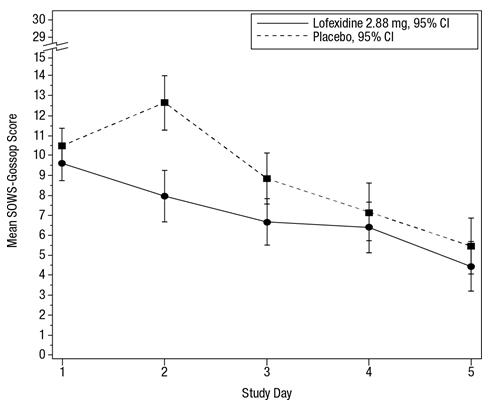
The mean SOWS-Gossop scores for Days 1–5 were 8.9 and 7.0 for placebo and LUCEMYRA 2.88 mg, respectively. Results are shown in Figure 4. The mean difference was -1.9 with a 95% CI of (-3.2, -0.6) and was statistically significant.
Figure 4. Mean SOWS-Gossop Scores for Days 1–5 in Study 2:
© All content on this website, including data entry, data processing, decision support tools, "RxReasoner" logo and graphics, is the intellectual property of RxReasoner and is protected by copyright laws. Unauthorized reproduction or distribution of any part of this content without explicit written permission from RxReasoner is strictly prohibited. Any third-party content used on this site is acknowledged and utilized under fair use principles.