MYQORZO Film-coated tablet Ref.[116119] Active ingredients: Aficamten
Source: FDA, National Drug Code (US) Revision Year: 2025
12.1. Mechanism of Action
Aficamten is an allosteric and reversible inhibitor of cardiac myosin motor activity. Aficamten reduces the force generated by myosin at the cardiac sarcomere, which contributes to the pathophysiology of HCM. In patients with HCM, myosin inhibition with aficamten reduces cardiac contractility and left ventricular outflow tract (LVOT) obstruction.
12.2. Pharmacodynamics
Left Ventricular Ejection Fraction and Left Ventricular Outflow Tract Obstruction
In SEQUOIA-HCM, reductions in LVOT-G were observed at 2 weeks after initiating treatment, and LVOT-G continued to decrease through Week 8. The reduction in LVOT-G was sustained through the remainder of the 24-week trial. At Week 24, the mean (SD) change from baseline in resting and Valsalva LVOT-G was -35 (29) mmHg and -48 (37) mmHg, respectively, for the MYQORZO group and 4 (35) mmHg and 2 (35) mmHg, respectively, for the placebo group. The reduction in LVOT-G was accompanied by a greater decrease in LVEF in the MYQORZO group compared to the placebo group with mean (SD) change from baseline in LVEF of -7 (7)% and -2 (6)%, respectively. Four weeks after discontinuation of treatment, LVEF and Valsalva LVOT-G returned to baseline.
Cardiac Structure
In SEQUOIA-HCM, maximal left ventricular wall thickness, left ventricular mass index (LVMI) and left atrial volume index (LAVI) were measured at baseline and Week 24. At Week 24, the mean (SD) maximal left ventricular wall thickness decreased in the MYQORZO group by -0.2 (0.3) cm and in the placebo group by -0.1 (0.3) cm. LVMI decreased in the MYQORZO group by -5.3 (24) g/m² and increased in the placebo group by 5.8 (25) g/m². At Week 24, LAVI decreased in the MYQORZO group by -2.6 (8) mL/m² and increased in the placebo group by 1.4 (8) mL/m². The clinical significance of these findings is unknown.
Cardiac Biomarkers
In SEQUOIA-HCM, reductions in NT-proBNP were observed in the MYQORZO group starting at Week 2 and were sustained through Week 24. At Week 24, NT-proBNP was 80% lower with MYQORZO compared to placebo (proportion of geometric mean ratio between MYQORZO and placebo, 0.20 [95% CI: 0.17, 0.23]). At both Week 12 and 24, troponin I was 40% lower with MYQORZO compared to placebo (proportion of geometric mean ratio between the two groups, 0.57 [95% CI: 0.51, 0.64]).
The clinical significance of the NT-proBNP and troponin findings is unknown.
Cardiac Electrophysiology
The results of a thorough QT study demonstrated a lack of QTc prolongation across the therapeutic concentration range of MYQORZO. At a single dose of 50 mg (similar exposure to 20 mg daily dosing to steady-state), the upper limit of the predicted placebo-corrected change from baseline in QT interval corrected by Fridericia (ΔΔQTcF) 90% confidence interval for MYQORZO was <10 msec.
12.3. Pharmacokinetics
Aficamten exposure increases dose proportionally following single doses of 1 mg to 75 mg and multiple once daily doses of 5 mg to 20 mg. Aficamten pharmacokinetics was comparable between healthy subjects and patients with oHCM. Geometric mean accumulation ratios for aficamten were similar across dose levels and ranged from 4.6 to 4.8. Steady state is predicted to be reached following approximately 17 days of once daily dosing of MYQORZO in patients with oHCM.
Absorption
Aficamten is rapidly absorbed with a median time to maximum concentration (Tmax) of 1.5 to 2.0 hours. The bioavailability of aficamten after oral administration is unknown.
Effect of Food
No clinically significant differences in aficamten AUC and Cmax were observed following its administration with a high-fat, high-calorie meal.
Distribution
Aficamten is approximately 90% bound to plasma proteins and demonstrates a volume of distribution of 313 L. The blood to plasma ratio of aficamten was 0.94.
Elimination
Aficamten has a median terminal half-life (t½) of approximately 80 hours in patients with oHCM. At steady-state, the peak-to-trough plasma concentration ratio with once daily dosing is approximately 1.2. The total clearance is 2.6 L/hr and the renal clearance is <0.1% of total clearance.
Metabolism
Aficamten is extensively metabolized in humans, primarily through CYP2C9 with contributions by CYP3A, CYP2D6, and CYP2C19. Aficamten is primarily metabolized to two pharmacologically inactive metabolites, CK-3834282 and CK-3834283, that circulate at approximately 56% and 103% of parent in plasma, respectively.
Excretion
Following a single 20 mg radiolabeled dose of aficamten, 32% (0.06% unchanged aficamten) was excreted in urine and 58% (5.1% unchanged aficamten) was excreted in feces.
Specific Populations
No clinically meaningful differences in the pharmacokinetics of aficamten were observed based on age (18–83 years), race, mild to moderate hepatic impairment (Child-Pugh Classes A and B), or mild to moderate renal impairment (estimated glomerular filtration rate (eGFR) ≥30 mL/min normalized by body surface area and based on the modification of diet in renal disease (MDRD) equation). The effects of severe renal (eGFR <30 mL/min based on MDRD equation) or hepatic (Child-Pugh Class C) impairment are unknown.
Small differences in aficamten exposure with sex and body weight were observed. Female patients demonstrated a 31% higher mean exposure (AUC) compared to male patients. The highest body weight quartile of patients (median: 105 kg) demonstrated a 34% lower aficamten mean exposure (AUC) than the lowest body weight quartile of patients (median: 64 kg). These differences are not clinically significant.
Drug Interaction Studies
Clinical Studies and Model-Informed Approaches
Inhibitors and Inducers of CYP enzymes: The predicted and observed effect of coadministration of select CYP inhibitors and inducers on the plasma exposure of aficamten is provided in Table 3.
Table 3. In Vivo Observed and Predicted Effects of CYP Inhibitors and Inducers on Aficamten Plasma Exposure:
| Concomitant Medication | Dosage | Effect on Aficamten Mean AUC |
|---|---|---|
| Inhibitors of Individual CYP Enzymes | ||
| Sulfaphenazole1 - Strong CYP2C9 Inhibitor | 2000 mg once daily | AUC: ↑ 113% |
| Itraconazole2 - Strong CYP3A Inhibitor | 200 mg once daily | AUC: ↑ 26% |
| Paroxetine2 – Strong CYP2D6 Inhibitor | 40 mg once daily | AUC: ↑ 27% |
| Inhibitors of Multiple CYP Enzymes | ||
| Fluconazole2 - Strong CYP2C19, Moderate CYP3A, and Moderate CYP2C9 Inhibitor | 400 mg once daily | AUC: ↑ 278% |
| 150 mg x 2 doses; separated by 48 hours | AUC: No change | |
| Fluvoxamine1 - Strong CYP2C19, Weak-to- Moderate CYP3A, Weak CYP2C9, and Weak CYP2D6 Inhibitor | 150 mg twice daily | AUC: ↑ 116% |
| Voriconazole1 - Strong CYP3A, Moderate CYP2C19, and Weak CYP2C9 inhibitor | 200 mg twice daily | AUC: ↑ 94% |
| Fluoxetine2 - Strong CYP2D6 and Strong CYP2C19 Inhibitor | 40 mg once daily | AUC: ↑ 32% |
| CYP Enzyme Inducers | ||
| Rifampin1 - Strong CYP3A, Strong CYP2C19, and Moderate CYP2C9 Inducer | 600 mg once daily | AUC: ↓ 79% |
| Carbamazepine2 – Moderate-to-strong CYP3A and Weak CYP2C9 Inducer | 300 mg twice daily | AUC: ↓ 51% |
1 Predicted via physiologically-based pharmacokinetic modeling.
2 Observed.
P-gp Transporter Substrates: Concomitant administration of a single 20 mg dose of aficamten increased dabigatran (administered as dabigatran etexilate) mean AUCinf by 26%.
In Vitro Drug Interaction Studies
CYP enzymes: Aficamten is not expected to inhibit CYP1A2, CYP2B6, CYP2C8, CYP2C19, CYP2D6, or CYP3A4 at clinically relevant concentrations. Aficamten is not expected to induce CYP1A2, CYP2B6 or CYP3A4 at clinically relevant concentrations.
Transporter systems: Aficamten is not a sensitive substrate of drug transporters. Aficamten is not expected to inhibit BCRP, OCT2, OCT3, OAT1, OAT3, OATP1B1, OATP1B3, MATE1 or MATE2-K drug transporters at clinically relevant concentrations.
12.5. Pharmacogenomics
Aficamten is primarily metabolized by the polymorphic enzyme, CYP2C9, with lesser contributions by other polymorphic enzymes (e.g., CYP2D6 and CYP2C19) [see Clinical Pharmacology (12.3)]. The impact of CYP2C9 genetic variants on the pharmacokinetics of aficamten has not been directly evaluated, though, a similar effect on exposure is expected as seen with strong CYP2C9 inhibitors [see Drug Interactions (7.1)].
No additional dosage modifications are required for patients who are CYP2C9 poor metabolizers, as MYQORZO dosage titration and modifications account for CYP2C9 metabolizer status [see Dosage and Administration (2.2) and (2.3)].
13.1. Carcinogenesis, Mutagenesis, Impairment of Fertility
Carcinogenesis
The carcinogenic potential of aficamten was assessed in a 26-week study in transgenic rasH2 mice and a 2-year study in Sprague Dawley rats. There was no evidence of carcinogenicity with oral administration of aficamten at dose levels up to 2.0 mg/kg/day in the mouse or 3 mg/kg/day in the rat (corresponding to 4-fold the MRHD based on free AUC).
Mutagenesis
Aficamten was not genotoxic in the in vitro bacterial (Ames) mutagenicity assay or the combined in vivo micronucleus assay and comet assay in rat.
Impairment of Fertility
In a fertility and early embryonic development toxicology study in the rat, aficamten was administered at doses up to 6 mg/kg/day in females and 3 mg/kg/day in males, with no drug-related effects on mating, fertility, estrous cycling, male reproductive assessments, or early embryonic survival.
14. Clinical Studies
The efficacy of MYQORZO was evaluated in SEQUOIA-HCM (NCT05186818), a phase 3, multicenter, randomized, double-blind, placebo-controlled study in 282 adults (142 aficamten, 140 placebo) with symptomatic New York Heart Association (NYHA) class II and III oHCM, LVEF ≥60%, and resting and post-Valsalva peak LVOT-G ≥30 and ≥50 mmHg at screening, respectively. Patients who completed SEQUOIA-HCM were eligible to participate in an ongoing, open-label, single-arm extension study (FOREST-HCM). Patients with a known infiltrative or storage disorder causing cardiac hypertrophy such as Noonan syndrome, Fabry disease or amyloidosis were excluded.
Patients were randomized in a 1:1 ratio to receive either MYQORZO or placebo once daily for 24 weeks. Randomization was stratified by use of beta-blockers (yes or no) and cardiopulmonary exercise testing (CPET) exercise modality (treadmill or bicycle).
At baseline, 76% of the randomized patients were NYHA class II and 24% were NYHA class III. The mean peak oxygen uptake (pVO 2) by CPET at baseline was 18.5 mL/kg/min with 55% using treadmill and 45% using bicycle, respectively. At baseline, the median LVEF was 76%, the mean resting LVOT-G was 55 mmHg, the mean Valsalva LVOTG was 83 mmHg, and mean Kansas City Cardiomyopathy Questionnaire – Clinical Summary Score (KCCQ-CSS) was 74. At baseline, 61% of patients were on beta-blockers, 29% were on non-dihydropyridine calcium channel blockers, 13% were on disopyramide, and 15% were not taking any background medication for oHCM.
Groups were balanced with respect to age (mean 59 years; range 18 to 84 years), sex (59% male), race (79% White, 19% Asian and 1% Black or African American), body mass index (mean 28 kg/m 2), heart rate (mean 66 bpm) and blood pressure (mean 124/74 mmHg).
Patients were initiated on MYQORZO at a dose of 5 mg once daily. Doses were individually titrated (or sham-titrated if on placebo) at Week 2, 4 and 6 if Valsalva LVOT-G was ≥30 mmHg and LVEF was ≥55% in 5 mg dose increments up to a maximum dose of 20 mg once daily. At Week 24, in the MYQORZO group, 46% of patients were on the 20 mg dose, 35% were on the 15 mg dose, 15% were on the 10 mg dose and 4% were on the 5 mg dose.
Primary Endpoint - Peak Oxygen Uptake (pVO 2)
In SEQUOIA-HCM, the primary endpoint of change from baseline in pVO 2 to Week 24 was greater with MYQORZO compared to placebo, as shown in Table 4.
Table 4. Change from Baseline in pVO2 by CPET at Week 24 in SEQUOIA-HCM:
| pVO2 | MYQORZO (N=142) | Placebo (N=140) | |
| Baseline (mL/min/kg), mean (SD) 18.4 (4.4) 18.6 (4.5) | Change from baseline to Week 24 | ||
| LS mean (SE)1 | 1.7 (0.3) | 0.0 (0.3) | |
| LS mean difference vs. placebo (95% CI)1 | 1.7 (1.0, 2.4) | ||
| p-value | <0.0001 | ||
1 LS mean (SE), and LS mean difference (95% CI) were estimated from an ANCOVA model. A placebo-based multiple imputation approach was used to impute the missing data.
A range of demographic characteristics, baseline disease characteristics, and baseline concomitant medications (e.g., use of beta-blockers) were examined for their influence on outcomes. Results of the primary endpoint analysis consistently favored MYQORZO across all subgroups analyzed (Figure 1).
Figure 1. Forest Plot for Change in Baseline pVO 2 by CPET at Week 24 by Subgroups in SEQUOIA-HCM:
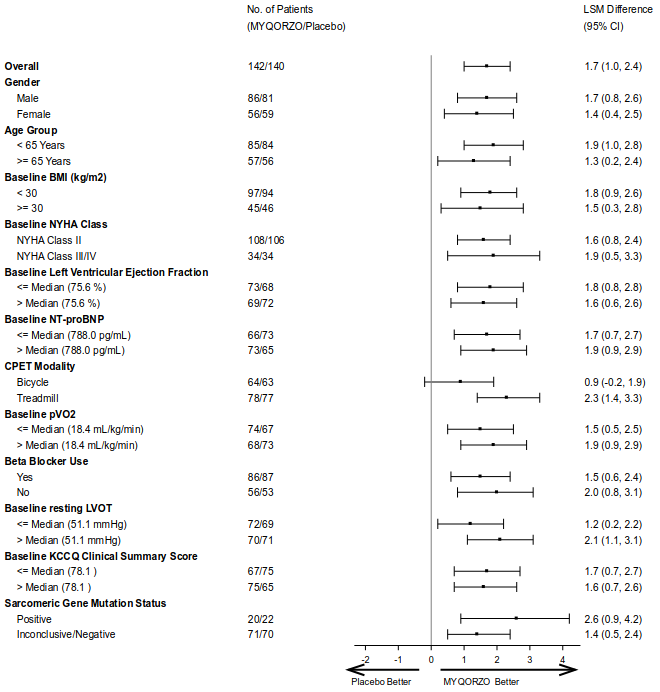
BMI: Body Mass Index; NYHA: New York Heart Association; NT-proBNP: N-terminal pro-B-type natriuretic peptic; CPET: Cardiac Pulmonary Exercise Test; pVO2: Peak Oxygen Uptake; LVOT: left ventricular outflow tract; KCCQ CSS: Kansas City Cardiomyopathy Questionnaire – Clinical Summary Score.
Secondary Endpoints
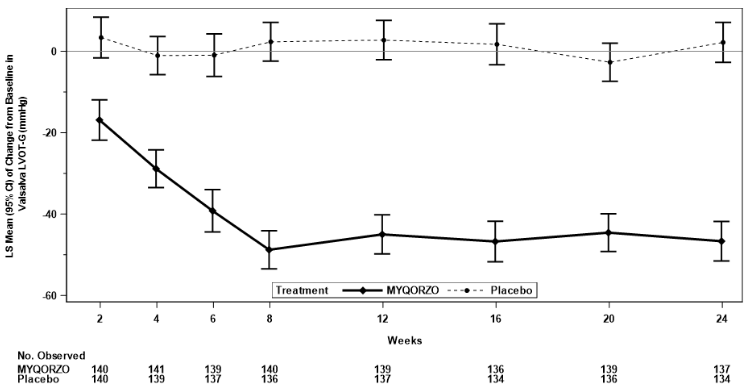
The treatment effects of MYQORZO on health status, functional capacity, and LVOT obstruction were assessed by change in the KCCQ-CSS, proportion of patients with ≥1 class improvement in NYHA functional class, change from baseline in Valsalva LVOT-G, proportion of patients with Valsalva LVOT-G ≤30 mmHg, duration of eligibility for septal reduction therapy (SRT), and change in total workload during CPET. At Week 24, patients receiving MYQORZO had greater improvement compared to the placebo group across all secondary points (Table 5, Figure 2 and Figure 3).
Table 5. Results of Secondary Efficacy Endpoints in SEQUOIA-HCM:
| Endpoints | MYQORZO N=142 | Placebo N=140 | LS Mean Difference (95% CI) | p-Value | |
|---|---|---|---|---|---|
| Mean Change from Baseline in KCCQ-CSS1,3 | |||||
| Week 12 | 11.1 (0.9) | 4.0 (0.9) | 7.0 (4.6, 9.5) | <0.0001 | |
| Week 24 | 11.6 (1.0) | 4.3 (1.0) | 7.3 (4.6, 10.1) | <0.0001 | |
| Mean Change from Baseline in Valsalva LVOT-G (mmHg)1 | |||||
| Week 12 | -45.0 (2.4) | 2.7 (2.4) | -47.7 (-54.5, -41.0) | <0.0001 | |
| Week 24 | -46.7 (2.5) | 2.2 (2.5) | -48.8 (-55.7, -42.0) | <0.0001 | |
| Mean Duration of SRT Eligibility1 | |||||
| Days spent SRT-eligible during 24 Weeks of Treatment | 35 (8) | 113 (8) | −78 (−100, −56) | <0.0001 | |
| Mean Change from Baseline in Total Workload (Watts) during CPET1 | |||||
| Week 24 13.1 (2.1) 0.9 (2.2) 12.2 (6.3, 18.1) <0.0001 | Proportion of Patients with ≥1 NYHA Class Improvement2 | ||||
| Week 12 | 69 (48.6) | 25 (17.9) | OR: 4.6 (2.6, 8.4) | <0.0001 | |
| Week 24 | 83 (58.5) | 34 (24.3) | OR: 4.4 (2.6, 7.6) | <0.0001 | |
| Proportion of Patients with Valsalva LVOT-G <30 (mmHg)2 | |||||
| Week 12 | 73 (51.4) | 8 (5.7) | OR: 16.9 (7.7, 37.2) | <0.0001 | |
| Week 24 | 70 (49.3) | 5 (3.6) | OR: 22.9 (8.8, 59.6) | <0.0001 | |
CPET: Cardiac Pulmonary Exercise Test; KCCQ CSS: Kansas City Cardiomyopathy Questionnaire – Clinical Summary Score; NYHA: New York Heart Association; LVOT-G: left ventricular outflow tract gradient; SRT: septal reduction therapy.
1. LS means (SE) and LS mean difference (95% CI) was estimated from an ANCOVA model (mixed model with repeated measures was used for longitudinal data) for continuous endpoints. Placebo-based multiple imputation approach was used to impute the missing data.
2. The number (percentage) of responders and common Odds Ratio (OR) obtained using Cochran-Mantel-Haenszel method (95% CI) are presented for binary endpoints.
3. The KCCQ-CSS score ranges from 0 to 100, with higher scores indicating better health status.
Figure 2. Change from Baseline in KCCQ-CSS through Week 24:
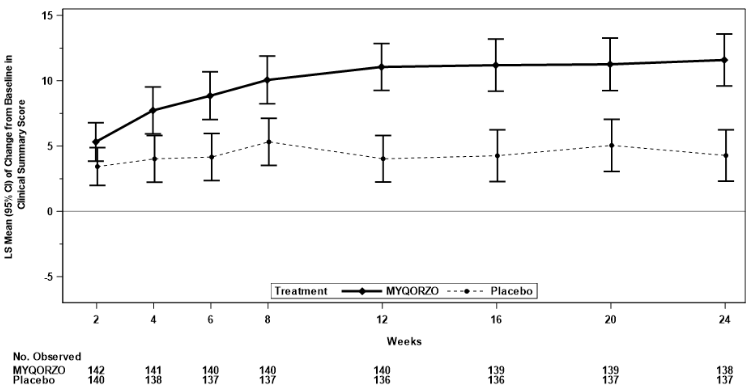
Figure 3. Change from Baseline in Valsalva LVOT-G through Week 24:
© All content on this website, including data entry, data processing, decision support tools, "RxReasoner" logo and graphics, is the intellectual property of RxReasoner and is protected by copyright laws. Unauthorized reproduction or distribution of any part of this content without explicit written permission from RxReasoner is strictly prohibited. Any third-party content used on this site is acknowledged and utilized under fair use principles.